

Key Takeaways
- Debt and Inflation Are Repricing Markets: Rising inflation and growing fiscal deficits are driving higher bond yields and increasing concerns about sovereign debt sustainability.
- Gold's Consolidation Does Not Change the Thesis: Despite recent price consolidation, inflation, central bank buying and currency debasement concerns continue to support gold.
- Central Banks Are Choosing Gold Over Treasuries: Central banks remain significant buyers of gold, reinforcing gold's role as a strategic reserve asset.
- Policy Constraints Favor Hard Assets: High debt levels limit policymakers' options, increasing the likelihood of monetary intervention and negative real rates.
- Silver's Structural Deficit Remains Intact: Constrained supply, resilient industrial demand and recovering investment demand continue to support silver's long-term fundamentals.
Performance as of May 31, 2026
| Indicator | 5/31/26 | 4/30/26 | Change | Mo % Chg | YTD % Chg | Analysis |
| Gold Bullion1 | $4,540.26 | $4,617.85 | -$77.59 | -1.68% | 5.11% | Consolidation continues above $4,500. |
| Silver Bullion2 | $75.30 | $73.75 | $1.55 | 2.10% | 5.07% | Consolidation continues above $70. |
| NYSE Arca Gold Miners (GDM)3 | 2,552.66 | 2,533.80 | 18.86 | 0.74% | 4.49% | GDM is consolidating above the 200-day moving average. |
| Bloomberg Comdty (BCOM Index)4 | 135.11 | 140.51 | -5.40 | -3.84% | 23.17% | The energy component fell 9.12%. |
| DXY U.S. Dollar Index5 | 98.94 | 98.06 | 0.89 | 0.90% | 0.63% | DXY remains range bound. |
| S&P 500 Index6 | 7,580.06 | 7,209.01 | 371.05 | 5.15% | 10.73% | New all-time highs on AI earnings. |
| U.S. Treasury 10-YR Yield* | 4.44 | 4.37 | 0.06 | 6 BPS | 27 BPS | Reached 4.69%, before falling. |
| Silver ETFs** (Total Known Holdings ETSITOTL Index Bloomberg) | 792.87 | 791.26 | 1.62 | 0.20% | -8.05% | Positioning flat in April and May. |
| Gold ETFs** (Total Known Holdings ETFGTOTL Index Bloomberg) | 98.43 | 98.78 | -0.36 | -0.36% | -0.52% | Positioning flat, drawdown at 2.5%. |
Source: Bloomberg and Sprott Asset Management LP. Data as of May 31, 2026.
* BPS stands for basis points. **Bloomberg Indices measure ETF holdings; the ETFGTOTL is the Bloomberg Total Known ETF Holdings of Gold Index; the ETSITOTL is the Bloomberg Total Known ETF Holdings of Silver Index.
Gold Market: Range-Bound Consolidation
In May, spot gold declined by $77.59 per ounce (or -1.68%) to close the month at $4,540.26, marking its third consecutive monthly decline. Since the sharp mid-March sell-off, largely driven by the unwinding of extreme leveraged positioning, gold has entered a consolidation phase. Prices have traded within a relatively narrow range, bounded by the declining 50-day moving average on the upside and strong support around $4,500 in closing prices and the 200-day moving average on intraday swings (see Figure 1). This lower bound appears to be an accumulation zone for central banks, particularly in China, suggesting continued structural demand in the market.
Structural demand continues to underpin gold prices.
Market activity has remained notably subdued. Positioning data from the CFTC is muted, ETF flows7 continue to show gradual outflows, and overall liquidity remains thin. Trading activity appears dominated by systematic participants, such as commodity trading advisors using quantitative and algorithmic strategies, which largely react to short-term movements in currencies and yields rather than macro fundamentals. Despite persistent geopolitical and macroeconomic volatility, gold’s price action is consistent with a consolidation phase rather than a breakdown.
Figure 1. Gold’s Accumulation Zone (2024-2026)
Gold bullion spot price in US$/oz with 14-day relative strength index
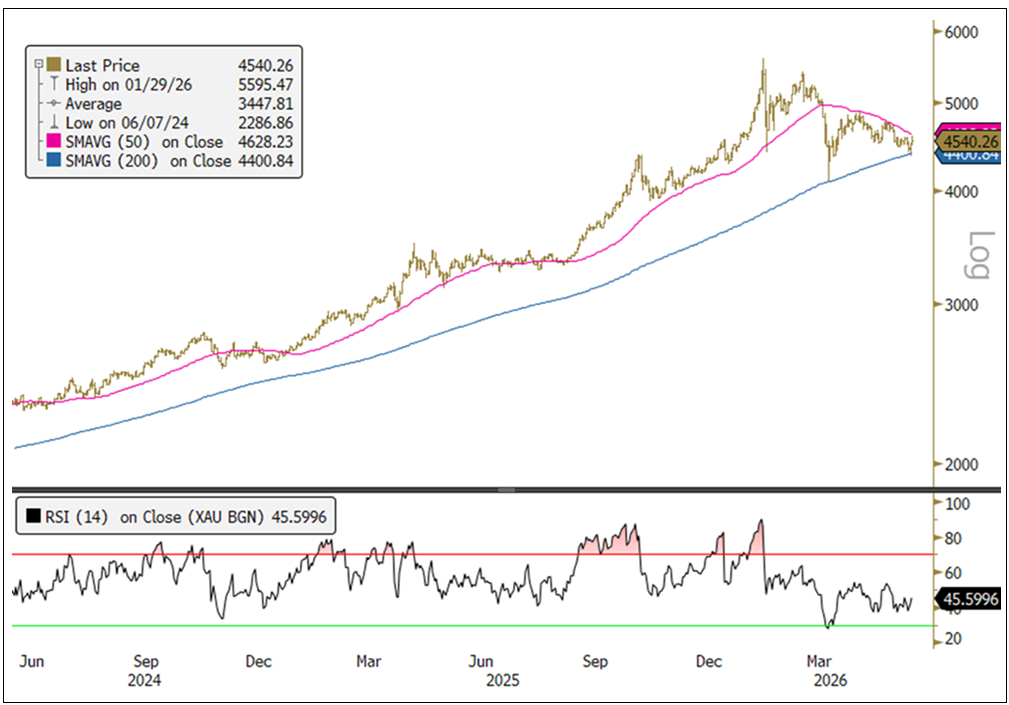
Source: Bloomberg. Gold bullion spot price, $/oz, daily. Data as of 6/2/2026. The 14-day RSI (relative strength index) is a momentum oscillator that measures the speed and change of price movements over a 14-day period, ranging from 0 to 100. Levels above 70 indicate overbought conditions while levels below 30 indicate oversold conditions. Past performance is no guarantee of future results.
While gold has stabilized, financial markets have moved decisively. Equities extended their AI-driven rally in May. The S&P 500 Index gained 5.15%, led by a surge in semiconductor stocks, which in turn followed strong gains in April. In contrast, global bond markets experienced a sharp sell-off. Yields across the curve rose to levels not seen in nearly two decades before stabilizing somewhat toward month-end. The market was reacting to resurgent inflation pressures, initially energy-driven but increasingly broad-based, and rising concerns about fiscal sustainability and debt issuance.
Inflation data continues to surprise to the upside and is now expanding beyond energy. The latest U.S. consumer price index and producer price index figures (April 2026) were higher than expected, with core and headline measures indicating that price pressures are becoming more entrenched. Notably, services inflation has contributed meaningfully to recent figures, signaling that upstream cost pressures are feeding into the broader economy. Personal consumption expenditures (PCE) show that inflation8 is somewhat less acute month-to-month but remains well above the Federal Reserve’s 2% target. This raises questions about the Fed’s credibility on inflation and whether monetary conditions are sufficiently restrictive. Over the past five years, PCE inflation year-over-year has been consistently well above the Fed’s 2% target and is now accelerating higher (see Figure 2).
Figure 2. Inflation is Missing the Fed’s 2% Target (2017-2026)
U.S. PCE core price index YoY by month compared to the Fed inflation target
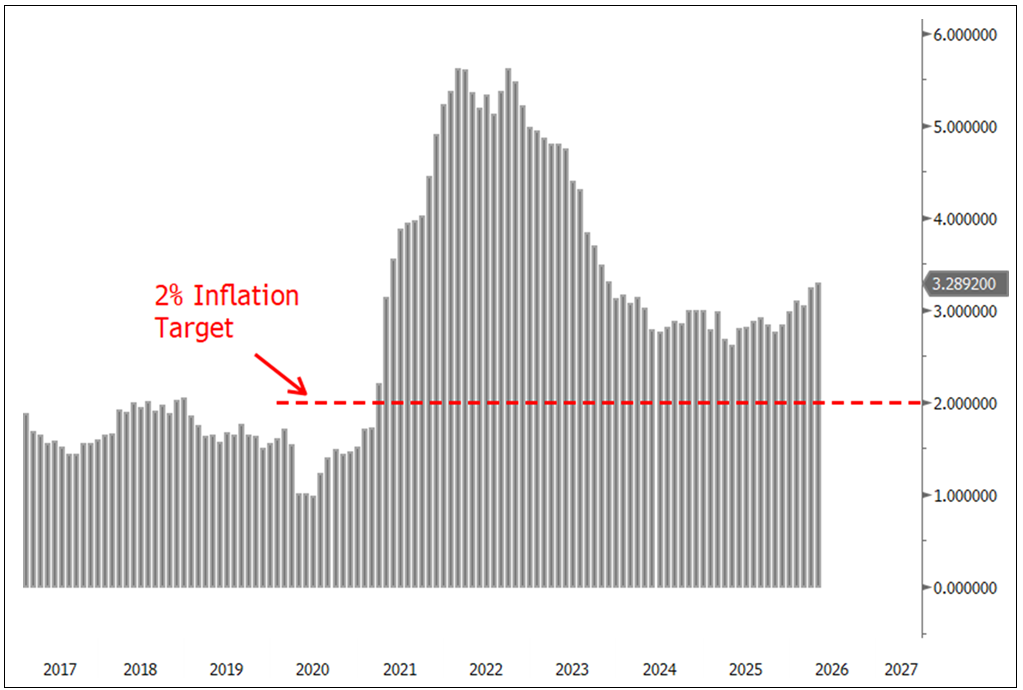
Source: Bloomberg. U.S. Personal Consumption Expenditure (PCE) core price index YoY, monthly. Data as of 6/3/2026. Included for illustrative purposes only. Past performance is no guarantee of future results.
Bond markets have responded with a synchronized global repricing. Yields have risen across both the front and long ends of the curve, reflecting not only cyclical inflation dynamics but also a structural increase in term premia. Short-end rates have moved higher as markets reprice the path of monetary policy, with U.S. two-year yields exceeding the Fed funds rate, implying renewed risk of monetary policy tightening. At the same time, long-end yields have climbed sharply, with the 30-year yield reaching levels last seen in 2007. This simultaneous rise across the curve points to deeper structural concerns about inflation, rising sovereign debt supply, and diminished confidence in fiscal discipline.
Central Banks are Holding Gold, Selling Treasuries
Central banks are increasingly using reserve assets to manage external shocks. This is one of the more notable recent market developments. Central banks continue to accumulate gold, buying a net 244 tonnes in the first quarter of 2026—higher than the quarterly and longer-term averages. At the same time, during the quarter, Turkey liquidated an estimated $14 billion (roughly 85-90%) of its U.S. Treasury holdings. To access liquidity, Turkey also sold 60 tonnes of gold via gold swaps9 rather than through outright sales. This distinction highlights the functional hierarchy within central bank reserve assets. Treasuries serve as transactional liquidity instruments, whereas gold is retained as core collateral, even in periods of stress.
Central banks continue to hold gold as core collateral, even in periods of stress.
These actions were largely driven by the surge in energy and fertilizer costs due to supply disruptions, particularly those linked to the closure of the Strait of Hormuz. For import-dependent economies, it has created a need to raise U.S. dollars, often by selling liquid reserve assets such as Treasuries. This heightens the potential for more central banks to sell sovereign debt, adds pressure to global bond markets and reinforces gold’s role as a strategic reserve asset.
Repricing Global Bonds
Global bond markets are undergoing a synchronized and structural repricing. Yields across major economies have risen sharply, tightening financial conditions and raising global borrowing costs (see Figure 3). Whereas prior cycles were largely driven by central bank policy and liquidity conditions, the dominant drivers now seem to be concerns about fiscal sustainability at the long end and inflation risk at the short end.
Figure 3. Investors Demand More (2022-2026)
Average G-7 10-year bond yields
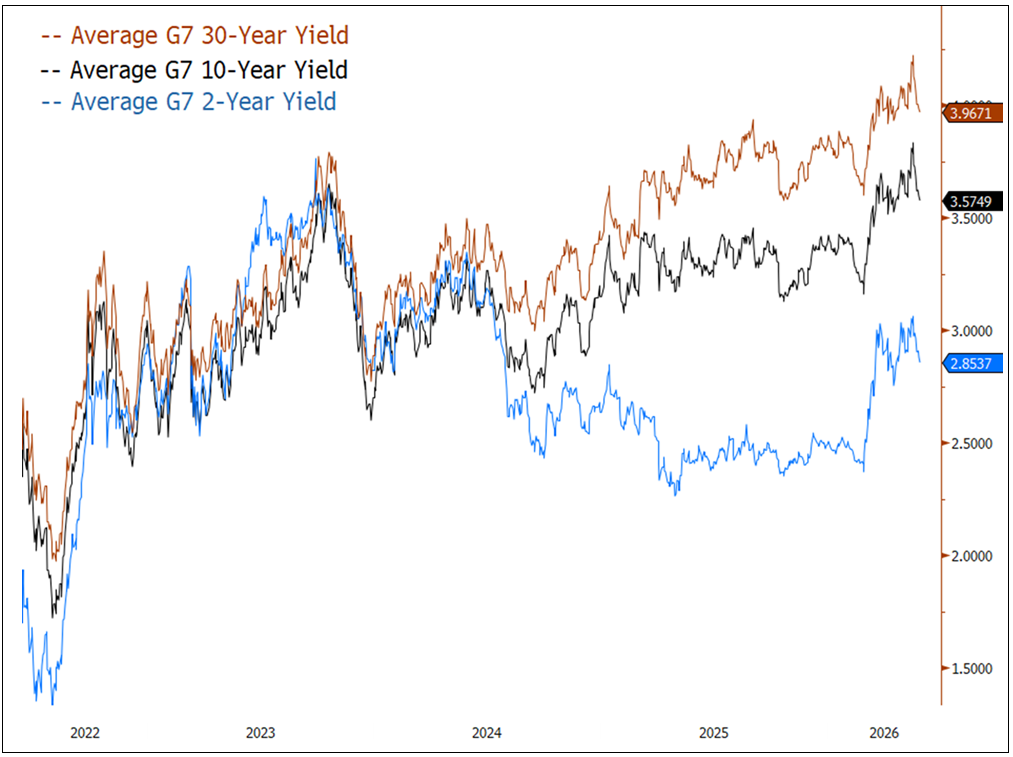
Source: Bloomberg. Average G-7 10-year bond yields, daily. Data as of 6/3/2026. Included for illustrative purposes only. Past performance is no guarantee of future results.
This repricing is the result of post-pandemic fiscal expansion, persistently high debt levels and a transition away from the low-inflation regime that defined the prior decade. Elevated deficits, combined with supply-driven inflationary pressures, particularly in energy, have forced markets to reassess the trajectory of interest rates. Term premia (the extra return investors demand for holding long-term bonds) are rising as bond buyers seek compensation for inflation uncertainty, increased bond issuance and concerns over long-term debt. As shown in Figure 4, after the GFC (global financial crisis), the term premia declined amid the Fed's QE and ZIRP10 policies. Post-COVID, term premia have risen steadily as inflation returned, QE and ZIRP ended, and debt and deficits accelerated. Until the cycle of higher inflation, rising debt and deficits ends, term premia may continue to climb.
Figure 4. Focus on Structural Risk (2011-2026)
10-year U.S. Treasury term premium in percentage points
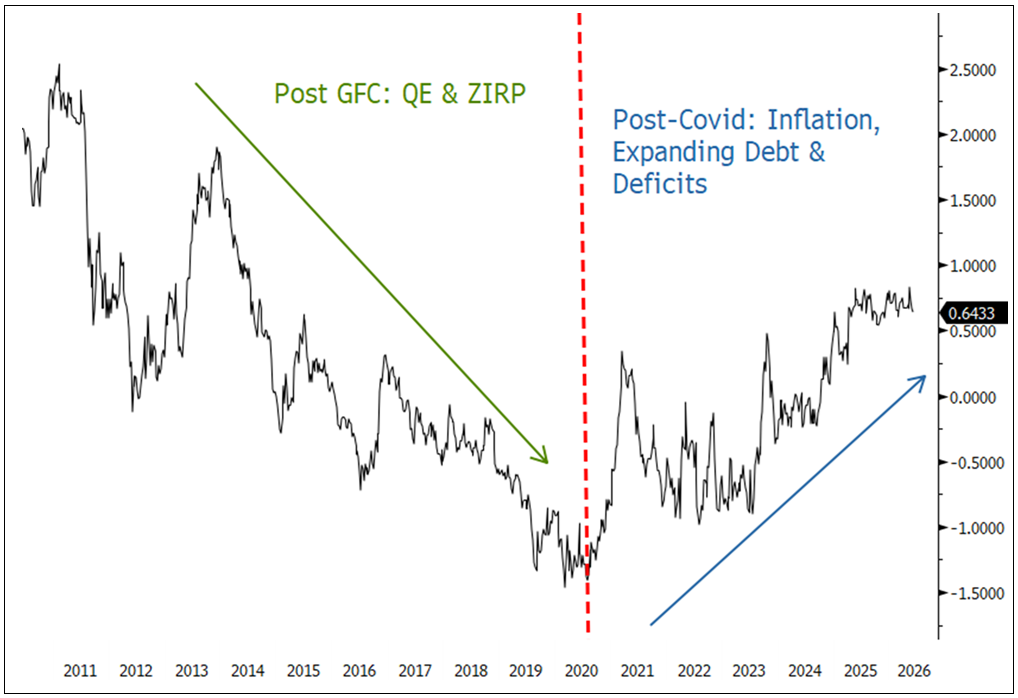
Source: Bloomberg. U.S. 10-year Treasury term premium, weekly. Data as of 6/3/2026. Included for illustrative purposes only. Past performance is no guarantee of future results.
Concurrently, the effectiveness of traditional policy signaling has weakened. Despite recent Fed rate cuts in 2024-2025, long-term bond yields have continued to rise. This is different from past cycles, and it suggests markets are increasingly focused on structural risks rather than central bank guidance. In some cases, developed markets are beginning to look a bit like emerging economies, with rising bond yields alongside weaker currencies, pointing to a decline in the credibility of official policy and a re-rating of sovereign risk. The UK and Japan are recent examples.
As bond market risks grow, investors are turning to gold as a store of value.
Fiscal dynamics are central to this shift. U.S. deficits remain structurally large, currently around 5% of gross domestic product (GDP) and projected to rise over the coming decade to 7% of GDP. Total debt-to-GDP is already at a historically high level of about 120% and is expected to rise further. Interest expense is becoming a critical pressure point. Annual net interest payments are currently $1.0-$1.2 trillion and are forecast to keep growing due to the compounding effect of issuing more debt at ever-higher rates.
This dynamic increasingly constrains policymakers. If they tighten policy, they may trigger fiscal instability and cause financial stress. If they ease policy, they could entrench inflation and weaken currencies. As a result, markets are beginning to anticipate a bias toward official intervention, particularly if bond market stress grows. However, such interventions, whether they involve providing liquidity or controlling yields in some way, effectively monetize debt and can reinforce an inflationary bias.
Even if policy adjustment remains orderly, the underlying shift is toward a regime in which real yields are difficult to sustain at positive levels. The rising supply of sovereign debt, coupled with structural shifts in demand, is eroding the effectiveness of bonds as a store of value. As a result, it will become more difficult for financial assets to preserve purchasing power, and the likelihood of further monetary expansion will grow. This reinforces gold’s role not as a yield competitor but as a store of value in a system where policy increasingly prioritizes bond market stability (via monetization) over inflation control.
Cyclical Headwinds but a Fundamental Shift
In the near term, gold faces a cyclical headwind stemming from the recent energy shock and its impact on liquidity and policy expectations. The surge in oil prices has increased demand for U.S. dollars among energy-importing economies. In some cases, it has forced the liquidation of reserve assets to fund imports. This has temporarily dampened demand from certain central banks and sovereign entities, particularly those most exposed to rising energy costs, even as overall structural buying remains intact.
Higher energy prices have pushed inflation forecasts higher, prompting the market to shift from expecting rate cuts to the possibility of further tightening. This has raised nominal yields, which in the short term can weigh on gold by increasing the opportunity cost of holding non-yielding assets.
Temporary pressures may affect gold, but the long-term drivers of demand remain firmly in place.
These pressures, however, are cyclical rather than structural. The broader macro setup remains intact. That is, a rebuilding of the “debasement trade” as investors shift from fiat currencies like the U.S. dollar into hard assets to protect against the loss of purchasing power caused by inflation and government debt. Policy constraints and rising fiscal dominance limit the system’s ability to sustain positive real returns. Policymakers are effectively forced to choose between financial stability and inflation control. The path of least resistance continues to favor intervention and monetization. The result is a persistent bias toward negative real rates over time.
The macroeconomic environment is increasingly characterized by stagflationary conditions as rising inflation coincides with weakening growth outside of the booming U.S. AI-related sector. In this setting, monetary policy becomes constrained as tightening exacerbates growth risks, while easing reinforces inflation. Fiscal dynamics further limit the scope for real rates to rise meaningfully because higher interest costs strain government budgets.
Historically, gold’s performance has been closely tied to this imbalance between nominal rates and inflation. When real returns on financial assets are compressed or turn negative, gold tends to outperform as a store of value. While rising nominal yields may present short-term headwinds, they are unlikely to remain sustainably positive in real terms, given the structural constraints policymakers face.
This view is reinforced by continued central bank demand. Over the past four years, official sector purchases have averaged over 1,000 tonnes annually, driven by diversification, geopolitical considerations and concerns over currency stability (see Figure 5). These purchases tend to occur during periods of price weakness, creating a durable floor under the market. While short-term fluctuations in demand may result from liquidity needs, the broader demand trend remains intact.
Figure 5. Durable Market Floor (2013-2026)
Central bank net gold purchases by quarter in tonnes with spot gold price in US$/oz
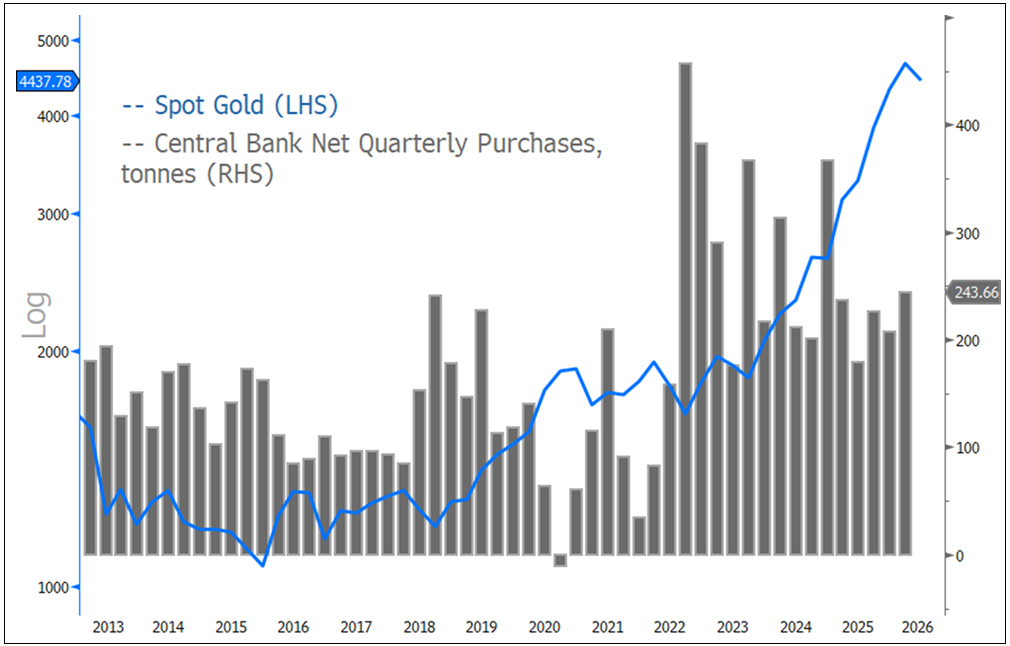 Source: Bloomberg. Central bank net quarterly gold purchases, tonnes, Data as of 6/3/2026. Included for illustrative purposes only. Past performance is no guarantee of future results.
At the same time, structural factors are tightening in the physical gold market. Mine supply growth remains limited, and steady official sector demand continues to absorb a significant portion of available supply. This reduces the amount of freely tradable gold and increases the market’s sensitivity to incremental demand shifts. As a result, while we may see volatility in the near term, the underlying fundamentals resemble historical environments that have been supportive for gold, particularly those characterized by fiscal dominance, monetary expansion, and constrained real returns.
Silver Market: Sustained Structural Deficit
In May, spot silver rose $1.55 per ounce (or 2.10%) to close the month at $75.30, representing the second up-month in a row since the extreme January and March sell-offs. Silver continues to consolidate well above its 200-day moving average, while its trading range is narrowing as volatility ebbs out (see Figure 6). Like the gold market, CFTC and ETF activity in silver have become very quiet, leaving trading to more systematic strategies. Overall, long-term silver fundamentals remain mostly bullish11 despite the prior extreme volatility.
Figure 6. Silver's Tighter Trading Range (2024-2026)
Silver spot price in US$/oz with 14-day relative strength index (RSI)
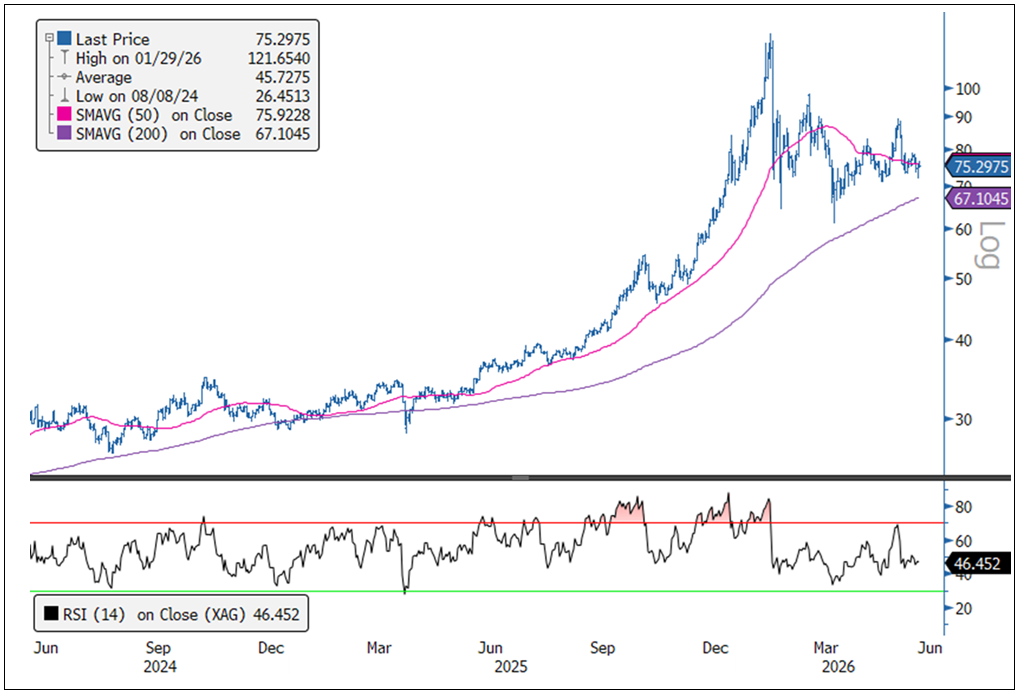
Source: Bloomberg. Silver spot price, $/oz. Data as of 6/2/2026. The 14-day RSI (relative strength index) is a momentum oscillator that measures the speed and change of price movements over a 14-day period, ranging from 0 to 100. Levels above 70 indicate overbought conditions while levels below 30 indicate oversold conditions. Included for illustrative purposes only. Past performance is no guarantee of future results.
The silver market remains in a sustained structural deficit, a condition that has persisted for most of the past several years, according to the Silver Institute’s 2026 World Silver Survey. Except for a brief surplus in 2020, the market has consistently undersupplied demand since 2021, resulting in a cumulative deficit of roughly 762 million ounces over the past six years (see Figure 7). When you include ETF flows, the imbalance is even more pronounced, exceeding 1 billion ounces. This points to a prolonged structural shortfall rather than a temporary cyclical imbalance.
Silver demand keeps growing. Supply isn't keeping up.
On the supply side, growth is clearly stalling. Total supply increased into 2025 but is expected to decline by approximately 2.2% in 2026. Mine production remains effectively flat. Recycling continues to rise and is expected to increase by nearly 7% in 2026, but this is not enough to offset the lack of growth in primary mine supply. This highlights a key constraint in the silver market: higher prices are not generating a rapid supply response, leaving the market structurally tight.
The silver market’s demand dynamics reinforce this picture. Total industrial demand is expected to decline modestly in 2026 but remains well above its pre-2020 norm, reflecting a structural step-up in usage. Within this, electronics demand continues to expand, and other industrial applications are recovering, while photovoltaic demand is normalizing after a period of rapid growth. Solar demand is expected to decline sharply in 2026 but remains well above its historical range, indicating that the broader energy transition remains a key underlying driver. (Since the Silver Institute’s survey was written, energy disruptions from the U.S.-Iran war have further increased demand for renewable energy.)
At the same time, investment demand for silver is beginning to re-emerge. Physical investment in coins, bars, and hedging products is forecast to rise by over 18% year-over-year in 2026, suggesting renewed investor interest after a period of softness. ETF flows remain volatile but have stabilized relative to prior outflows, providing more support to the market.
In contrast, traditional demand segments such as jewelry and silverware continue to weaken. This reflects a structural shift in silver demand, with industrial and investment uses increasingly dominant while legacy demand categories fade in importance.
Despite some moderation in demand—particularly from solar—and incremental increases in recycling supply, the overall market appears to remain firmly in deficit. The Silver Institute expects the shortfall to narrow only modestly in 2026 while remaining significant. Once ETF demand is considered, the expected deficit is substantially larger, underscoring how tight the underlying physical market remains.
Overall, the data show a silver market that is structurally constrained. Supply growth is limited, industrial demand is structurally higher, and investment demand is returning. Behind cyclical fluctuations in individual segments, the broader supply-demand balance continues to tighten. This suggests a sustained period of constrained availability and asymmetric pricing dynamics lies ahead.
Figure 7. Silver Supply/Demand Market Shortfalls (2017-2026)
Global supply and demand for silver in millions of ounces
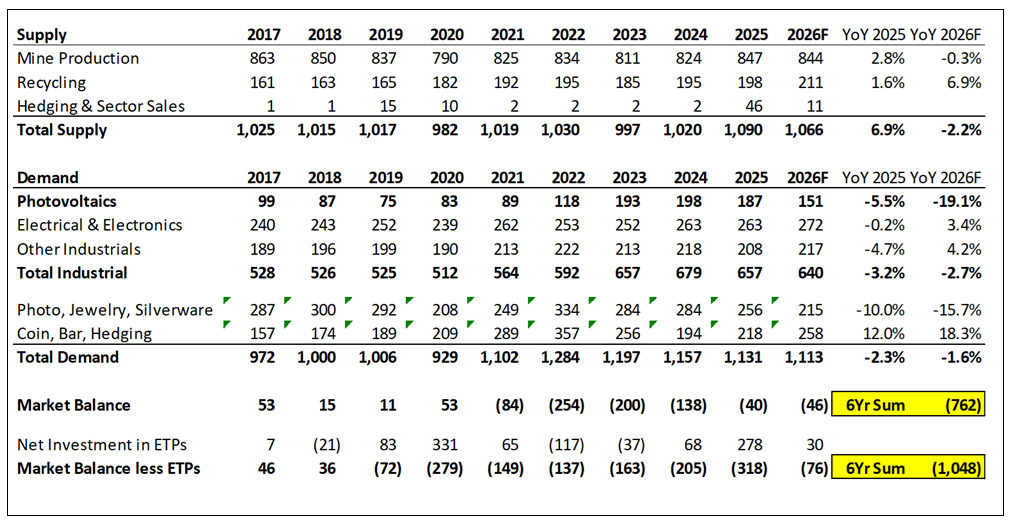
Source: The Silver Institute, World Silver Survey 2026. Included for illustrative purposes only. Past performance is no guarantee of future results.
For gold investors, silver continues to serve as a useful cross-check on the broader narrative of monetary debasement versus hard assets. Gold serves as the monetary anchor and balance sheet hedge. At the same time, silver translates that macro impulse into a market where limited supply flexibility and industrial demand can amplify price moves. In this context, persistent silver deficits, especially with revived investment demand, are a sign that gold’s strength is not an isolated event. Rather, it is part of a broader attempt by investors to reprice scarce real assets amid fiscal dominance and fading trust in fiat systems.
Footnotes
| 1 | Gold bullion is measured by the Bloomberg GOLDS Comdty Index. |
| 2 | Silver bullion is measured by the Bloomberg Silver (XAG Curncy) U.S. dollar spot rate. |
| 3 | The NYSE Arca Gold Miners Index (GDM) is a rules-based index designed to measure the performance of highly capitalized companies in the gold mining industry. |
| 4 | The Bloomberg Commodity Index (BCOM) is a broadly diversified commodity price index distributed by Bloomberg Indices. |
| 5 | The U.S. Dollar Index (USDX, DXY, DX) is an index (or measure) of the value of the United States dollar relative to a basket of foreign currencies, often referred to as a basket of U.S. trade partners' currencies. |
| 6 | The S&P 500 or Standard & Poor's 500 Index is a market-capitalization-weighted index of the 500 largest U.S. publicly traded companies. |
| 7 | CFTC data and ETF holdings are indicators of investor positioning in gold or silver based on reports from the Commodity Futures Trading Commission that show futures and options positions, and assets held in exchange-traded funds (ETFs). Together they provide insight into speculative and institutional demand. |
| 8 | “PCE inflation” refers to the change in prices for goods and services purchased by U.S. households as measured by the Personal Consumption Expenditures Price Index (PCEPI). This index is a key indicator of inflation in the U.S. economy and is closely watched by the U.S. Federal Reserve as it sets monetary policy. |
| 9 | A gold swap is a short-term exchange of gold for cash with a pre-agreed reversal after repaying cash plus fees or interest. Swaps allow the gold holder to generate liquidity without relinquishing ownership of the gold. Source: Bloomberg, "Turkey Liquidated Almost All US Treasury Holdings in March", May 21, 2026. |
| 10 | Following the 2008–2009 global financial crisis (GFC), the Fed followed a policy of quantitative easing (QE), which is when a central bank buys financial assets, like government bonds, to lower long-term interest rates and stimulate economic activity. It also used a zero interest-rate policy (ZIRP), which involves trying to maintain nominal interest rates at or near 0% to encourage borrowing and spending when traditional monetary policy tools are ineffective. |
| 11 | "Bullish" is the sentiment that prices will rise. |


Investment Risks and Important Disclosure
Relative to other sectors, precious metals and natural resources investments have higher headline risk and are more sensitive to changes in economic data, political or regulatory events, and underlying commodity price fluctuations. Risks related to extraction, storage and liquidity should also be considered.
Gold and precious metals are referred to with terms of art like "store of value," "safe haven" and "safe asset." These terms should not be construed to guarantee any form of investment safety. While “safe” assets like gold, Treasuries, money market funds and cash generally do not carry a high risk of loss relative to other asset classes, any asset may lose value, which may involve the complete loss of invested principal.
Past performance is no guarantee of future results. You cannot invest directly in an index. Investments, commentary and opinions are unique and may not be reflective of any other Sprott entity or affiliate. Forward-looking language should not be construed as predictive. While third-party sources are believed to be reliable, Sprott makes no guarantee as to their accuracy or timeliness. This information does not constitute an offer or solicitation and may not be relied upon or considered to be the rendering of tax, legal, accounting or professional advice.