

Key Takeaways
- A Correction, Not a Reversal: Following exceptional gains in 2025, gold and silver pulled back as tighter financial conditions, a stronger U.S. dollar and deleveraging weighed on prices. In our view, the long-term investment case remains firmly intact. At this writing, gold has sparked renewed investor interest as prices climbed above $4,350 an ounce on Friday, 8/7, marking a seven-week high.
- Gold's Fundamentals Remain Strong: Rising sovereign debt, persistent fiscal deficits, central bank reserve diversification and geopolitical fragmentation continue to reinforce gold's role as a strategic monetary asset despite recent volatility.
- Silver's Outlook Is Compelling: Structural market deficits, constrained mine supply and growing demand from electrification, AI infrastructure, renewable energy and advanced manufacturing continue to support the long-term investment case.
- Mining Equities Offer Value: Although precious metals equities have lagged bullion as investors favored large-cap technology and AI, producers continue to generate strong cash flow, maintain healthy balance sheets and trade at attractive valuations relative to their fundamentals.
Performance as of July 31, 2026
| Indicator | 7/31/26 | 6/30/26 | Change | Mo % Chg | YTD % Chg | Analysis |
| Gold Bullion1 | 4,046.15 | 4,008.02 | 38.13 | 0.95% | -6.33% | Gold stabilized at the $4,000 support level. |
| Silver Bullion2 | 57.60 | 58.60 | -1.00 | -1.71% | -19.63% | Silver extended its decline in July. |
| NYSE Arca Gold Miners (GDM)3 | 2,139.22 | 2,158.16 | -18.94 | -0.88% | -12.43% | GDM is approaching the 2,000 support level. |
| Bloomberg Comdty (BCOM Index)4 | 132.05 | 123.18 | 8.88 | 7.21% | 20.39% | All four Index components rebounded in July. |
| DXY U.S. Dollar Index5 | 99.91 | 101.19 | -1.27 | -1.26% | 1.62% | The U.S. dollar weakened in July. |
| S&P 500 Index6 | 7,489.72 | 7,499.36 | -9.64 | -0.13% | 9.41% | The S&P 500 was largely unchanged in July. |
| U.S. Treasury 10-YR Yield* | 4.73 | 4.47 | 0.27 | 27 BPS | 56 BPS | 10-YR hit 2026 high in July. |
| Silver ETFs** (Total Known Holdings ETSITOTL Index Bloomberg) | 786.92 | 782.27 | 4.65 | 0.59% | -8.74% | Silver ETF buying began again in July. |
| Gold ETFs** (Total Known Holdings ETFGTOTL Index Bloomberg) | 96.72 | 96.69 | 0.03 | 0.03% | -2.24% | Gold ETF holdings were flat. |
Source: Bloomberg and Sprott Asset Management LP. Data as of July 31, 2026.
* BPS stands for basis points. **Bloomberg Indices measure ETF holdings; the ETFGTOTL is the Bloomberg Total Known ETF Holdings of Gold Index; the ETSITOTL is the Bloomberg Total Known ETF Holdings of Silver Index.
Distinguishing Signal from Noise
The first seven months of 2026 demonstrated that cyclical corrections are a normal feature of secular bull markets. While gold and silver retreated from January's record highs, the macroeconomic and structural forces underpinning both metals remain firmly intact.
Gold bullion gained more than 64.58% in 2025, while silver bullion advanced 147.95%, driven by record central bank buying, persistent inflation concerns, rising sovereign debt and growing geopolitical uncertainty. By late January 2026, both metals had extended those gains, reaching new all-time highs as investors continued to seek hard assets amid an increasingly uncertain macroeconomic environment.
The subsequent correction was meaningful but not unusual.
The pullback tested conviction, not fundamentals.
After peaking in January, gold and silver retreated sharply through the end of the second quarter before stabilizing around $4,000-$4,100 per ounce and $55-$60 per ounce, respectively. As of July 31, gold was down 6.33% year-to-date, and silver had declined 19.63%, reflecting silver's inherently higher volatility. Despite these declines, both metals remained well above year-ago levels and have recently begun moving higher again as geopolitical tensions in the Middle East and inflation concerns have encouraged safe-haven demand.
Importantly, the correction reflected cyclical forces rather than deteriorating fundamentals. Rising sovereign debt, persistent fiscal deficits, central bank diversification away from the U.S. dollar, geopolitical fragmentation and, in silver's case, growing industrial demand continue to provide a supportive backdrop for precious metals. Rather than undermining the secular bull market, this year's volatility has tested investor conviction while reinforcing the long-term investment case for both gold and silver.
Figure 1. Gold & Silver Performance (January 2025-July 2026)
Both metals experienced significant volatility in the first half of 2026, yet remain well above year-ago levels.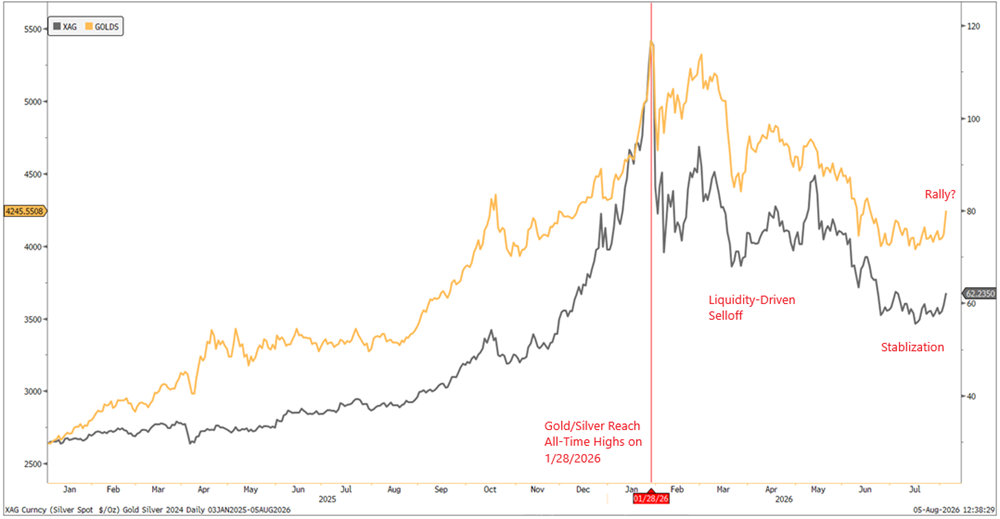
Source: Bloomberg. Data as of 8/5/2026.
Gold: A Secular Bull Market Interrupted by a Cyclical Correction
Gold's performance during 2026 can be viewed in three distinct phases. The year began with one of the strongest rallies in decades as investors increasingly questioned the long-term sustainability of sovereign debt, widening fiscal deficits and the credibility of traditional reserve assets. Central bank demand remained robust, geopolitical tensions intensified and investors increasingly viewed gold as a neutral reserve asset outside the traditional dollar-based financial system. These forces propelled gold to successive record highs through late January.
Central banks kept buying while investors kept selling.
The second phase began in March as geopolitical events unexpectedly triggered a tightening in global liquidity. Rather than benefiting immediately from heightened uncertainty, gold sold off sharply as leveraged investors liquidated positions to raise cash. Additional pressure emerged during the second quarter following the U.S.-Iran Memorandum of Understanding, falling oil prices, a stronger U.S. dollar and expectations that U.S. monetary policy would remain restrictive for longer.
By early summer, however, much of this selling pressure appeared to have run its course. Gold found support near $4,000 per ounce as physical demand re-emerged and central banks continued accumulating reserves. Although investor sentiment became increasingly pessimistic, the fundamental drivers supporting gold remained firmly intact.
Despite significant price volatility, central banks continued to diversify reserves away from traditional reserve currencies, reinforcing gold's role as a strategic monetary asset. Throughout the correction, official-sector buying helped establish a durable floor beneath the market, illustrating the distinction between cyclical investor flows and long-term structural demand.
Figure 2. Central Bank Gold Demand (2014-2026)
According to the World Gold Council, central bank buying rebounded sharply in Q2 following a Q1 lull.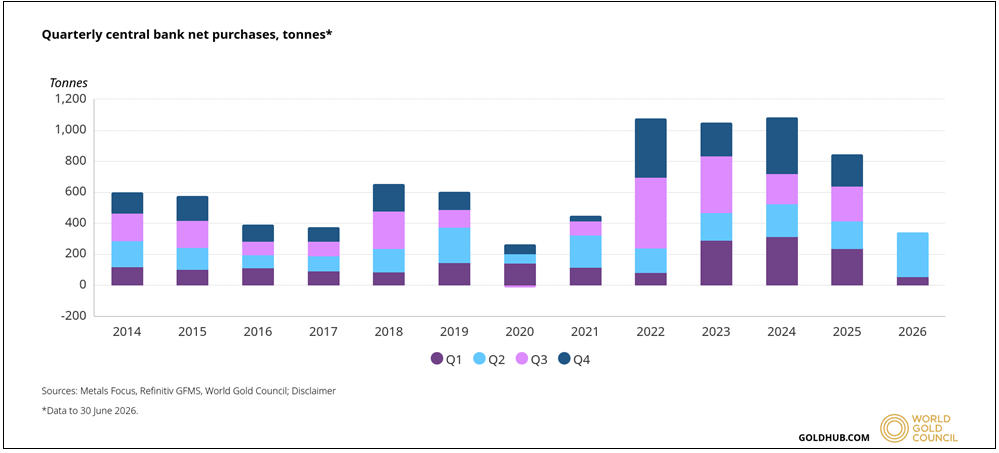
Source: World Gold Council.
Mining Equities: Fundamentals Remain Strong
Following a strong 2025, precious metals mining equities have retreated in line with bullion prices in 2026, as tighter financial conditions and shifting investor preferences have weighed on the sector. Much of this year's equity market leadership has been concentrated in U.S. large-cap technology and AI-related companies, limiting capital flows into more cyclical sectors, including mining.
Despite the pullback, gold producers continue to benefit from historically high realized gold prices, supporting strong margins, robust free cash flow generation and disciplined capital allocation. Balance sheets remain healthy, capital continues to be returned to shareholders through dividends and share repurchases, and ongoing industry consolidation reflects the strategic value of high-quality assets and reserve replacement. While valuation multiples remain below prior-cycle levels, we believe the sector's underlying fundamentals continue to compare favorably with current equity valuations.
Silver: Greater Volatility, Stronger Structural Tailwinds
Silver has experienced an even more dramatic year than gold. Following record highs early in 2026, silver declined sharply during the second quarter as industrial metals weakened, speculative positions were unwound and investors reduced exposure to economically sensitive assets. Given silver's smaller market size and higher participation by leveraged traders, these corrections were amplified relative to gold.
Structural deficits continue to support silver.
Yet silver's long-term fundamentals remain compelling. Unlike gold, silver derives value from both its monetary characteristics and its expanding industrial applications. Demand continues to grow from solar power, electrification, artificial intelligence infrastructure, advanced electronics and electrical grid investment, while mine supply has struggled to keep pace. The result has been several consecutive years of structural market deficits that continue to draw down above-ground inventories.
Silver's rebound toward > $60 per ounce suggests investors are once again recognizing these longer-term supply-demand dynamics.
Figure 3. Annual Silver Market Deficits (2017-2026)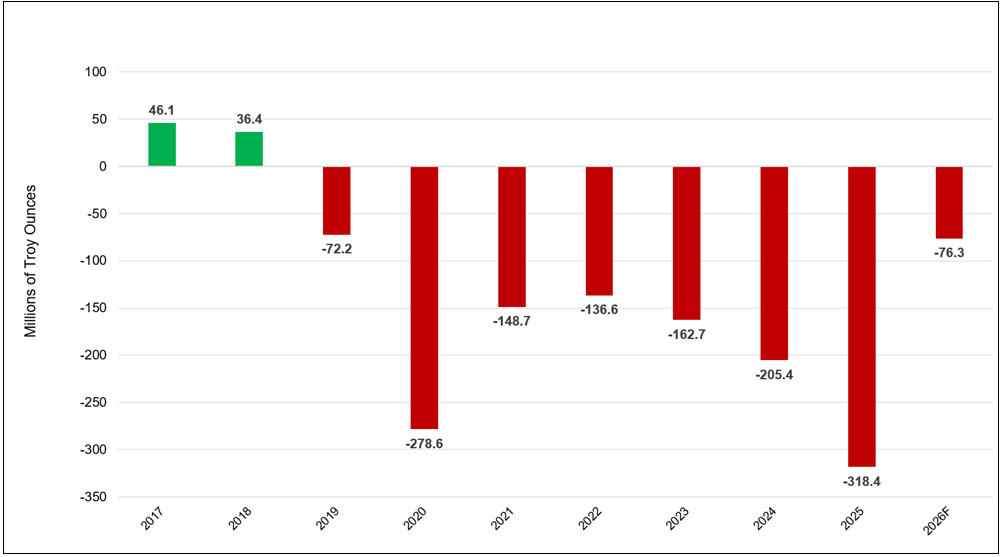
Sources: Metals Focus, Silver Institute. The Silver Institute: World Silver Survey 2026.
Why We Remain Bullish
As we move through the remainder of 2026, we believe investors should distinguish between cyclical volatility and secular trends.
Much of the market's adjustment to higher interest rates, tighter liquidity, and a stronger U.S. dollar now appears to have been reflected in prices. Meanwhile, the long-term forces supporting precious metals remain firmly in place. Expanding sovereign debt, persistent fiscal deficits, central bank reserve diversification and an increasingly fragmented geopolitical landscape continue to reinforce gold's role as a strategic reserve asset. Silver remains supported by both its traditional monetary role and rapidly growing industrial demand tied to electrification, renewable energy, artificial intelligence infrastructure and advanced manufacturing.
Periods of heightened volatility are rarely comfortable for investors, but they are an inevitable feature of long-term bull markets. In our view, the correction has improved the long-term risk-reward profile for precious metals. For investors able to distinguish cyclical volatility from structural trends, the secular investment case for both gold and silver remains compelling.
Figure 4. Gold and Silver Have Outperformed over the Long Term (12/31/1999-7/31/2026)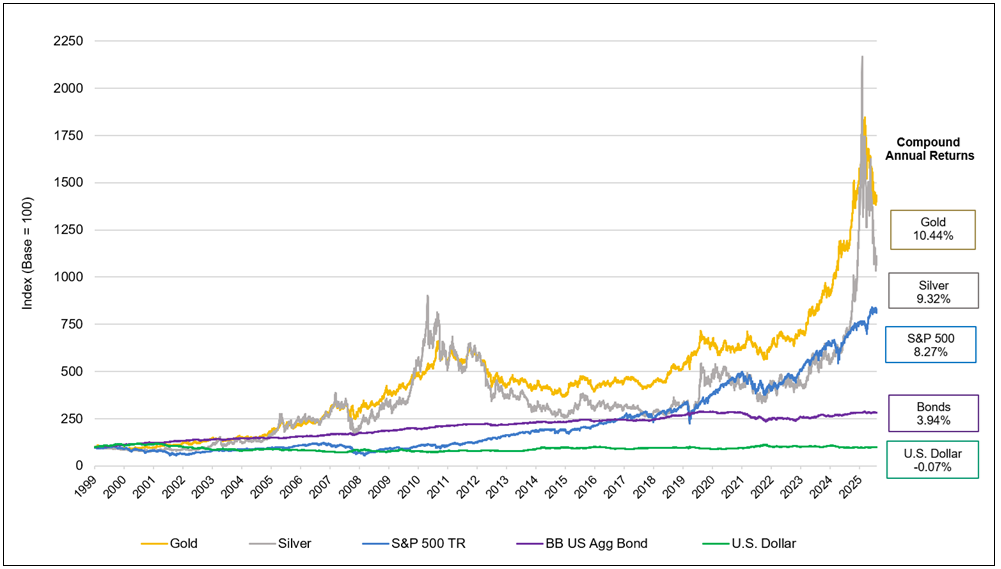
Source: Bloomberg. Period from 12/31/1999 to 7/31/2026. Gold is measured by the XAU Curncy Spot Price; Silver is measured by the XAG Curncy Spot Price; S&P 500 TR is measured by the SPX; U.S. Agg Bond Index is measured by the Bloomberg Barclays U.S. Agg Total Return Value Unhedged USD (LBUSTRUU Index); and the U.S. Dollar is measured by DXY Curncy. You cannot invest directly in an index. Past performance is no guarantee of future results.
| 1 | Gold bullion is measured by the Bloomberg GOLDS Comdty Index. |
| 2 | Silver bullion is measured by the Bloomberg Silver (XAG Curncy) U.S. dollar spot rate. |
| 3 | The NYSE Arca Gold Miners Index (GDM) is a rules-based index designed to measure the performance of highly capitalized companies in the gold mining industry. |
| 4 | The Bloomberg Commodity Index (BCOM) is a broadly diversified commodity price index distributed by Bloomberg Indices. |
| 5 | The U.S. Dollar Index (USDX, DXY, DX) is an index (or measure) of the value of the United States dollar relative to a basket of foreign currencies, often referred to as a basket of U.S. trade partners' currencies. |
| 6 | The S&P 500 or Standard & Poor's 500 Index is a market-capitalization-weighted index of the 500 largest U.S. publicly traded companies. |

Investment Risks and Important Disclosure
Relative to other sectors, precious metals and natural resources investments have higher headline risk and are more sensitive to changes in economic data, political or regulatory events, and underlying commodity price fluctuations. Risks related to extraction, storage and liquidity should also be considered.
Gold and precious metals are referred to with terms of art like "store of value," "safe haven" and "safe asset." These terms should not be construed to guarantee any form of investment safety. While “safe” assets like gold, Treasuries, money market funds and cash generally do not carry a high risk of loss relative to other asset classes, any asset may lose value, which may involve the complete loss of invested principal.
Past performance is no guarantee of future results. Investments, commentary and statements are unique and may not be reflective of investments and commentary in other strategies managed by any other Sprott entity or affiliate. Opinions expressed in this presentation are those of the presenters and may vary widely from opinions of other Sprott affiliates. Forward-looking language should not be construed as predictive. While third-party sources are believed to be reliable, Sprott makes no guarantee as to their accuracy or timeliness. This information does not constitute an offer or solicitation, nor an investment advice or recommendation, and may not be relied upon or considered to be the rendering of tax, legal, accounting or professional advice.