

Key Takeaways
- The recent decline in gold highlights an important paradox: a stronger U.S. dollar can pressure gold prices in the short term while ultimately strengthening gold's long-term investment case.
- The U.S. dollar's long-term role as the dominant reserve currency continues to erode, even as periodic dollar rallies remain a normal feature of the evolving global monetary system.
- During periods of market stress, investors often sell gold to raise dollars, underscoring gold's role as one of the world's most liquid reserve assets rather than weakening its investment case.
- Ironically, the stronger the U.S. dollar becomes, the greater the incentive for central banks to diversify reserves, reinforcing gold's role as a unique neutral reserve asset over time.
- Despite June's sharp correction, silver's long-term investment case remains supported by persistent structural supply deficits, expanding industrial demand and growing monetary relevance.
Performance as of June 30, 2026
| Indicator | 6/30/26 | 5/31/26 | Change | Mo % Chg | YTD % Chg | Analysis |
| Gold Bullion1 | 4,008.02 | 4,540.26 | (532.24) | -11.72% | -7.21% | Gold broke quickly to $4,000 support. |
| Silver Bullion2 | 58.60 | 75.30 | (16.70) | -22.18% | -18.23% | Silver fell below the $60- $70 support range. |
| NYSE Arca Gold Miners (GDM)3 | 2,158.16 | 2,552.66 | (394.50) | -15.45% | -11.65% | GDM is approaching 2,000 support. |
| Bloomberg Comdty (BCOM Index)4 | 123.18 | 135.11 | (11.93) | -8.83% | 12.30% | All four components fell in June. |
| DXY U.S. Dollar Index5 | 101.19 | 98.94 | 2.25 | 2.27% | 2.91% | DXY broke above 100.5 resistance. |
| S&P 500 Index6 | 7,499.36 | 7,580.06 | (80.70) | -1.06% | 9.55% | Wide dispersion of returns. |
| U.S. Treasury 10-YR Yield* | 4.47 | 4.44 | 0.03 | 3 BPS | 30 BPS | 10-YR Treasury rangebound but elevated. |
| Silver ETFs** (Total Known Holdings ETSITOTL Index Bloomberg) | 782.27 | 792.87 | (10.60) | -1.34% | -9.28% | Silver ETF selling continues. |
| Gold ETFs** (Total Known Holdings ETFGTOTL Index Bloomberg) | 96.69 | 98.43 | (1.73) | -1.76% | -2.27% | Gold ETF selling remains modest. |
Source: Bloomberg and Sprott Asset Management LP. Data as of June 30, 2026.
* BPS stands for basis points. **Bloomberg Indices measure ETF holdings; the ETFGTOTL is the Bloomberg Total Known ETF Holdings of Gold Index; the ETSITOTL is the Bloomberg Total Known ETF Holdings of Silver Index.
Gold Market: Waterfall Declines
In June, spot gold plunged by $532.24 per ounce (-11.72%) to close the month at $4,008.02, its fourth consecutive monthly decline. June’s monthly decline was the largest since October 2008. For the quarter ended June 30, gold fell by $660.04, or -14.14%, the worst quarter since the second quarter of 2013, which is when the Federal Reserve (Fed) began its first rate-hiking cycle after the 2008 Global Financial Crisis.
Gold's correction pushed sentiment to extreme bearishness.
The June selling wave in gold began with the signing of the Islamabad Memorandum of Understanding between the U.S. and Iran, which sent oil prices plummeting and the U.S. dollar rising. The second selling wave was catalyzed by the market’s hawkish interpretation of new Fed Chair Kevin Warsh's remarks after the June meeting of the Federal Open Market Committee (FOMC). This was Warsh’s first FOMC meeting as Fed chair. Expectations of rate hikes drove short-end yields higher, further strengthening the U.S. dollar. Most quant traders would have interpreted a U.S. dollar breakout combined with rising short-term rates as bearish for gold.
Investment funds sold gold in the March to May period to unwind extremely leveraged positions. They continued selling during June as macro readings worsened and sovereign-related entities pulled back on gold buying. It was commodity trading advisors, quant and algo-type funds that predominantly drove the waterfall declines in June as they sold further or entered modest short positions. The drop in gold prices appears to be much more significant than the actual moves in the U.S. dollar and federal funds rates. It suggests that much of the potential negative effects of a higher-rate, stronger-dollar combination have already been discounted.
Gold’s decline in the first half of 2026 matches prior periods of extreme bearishness. In June, gold fell below its 200-day moving average for the first time since October 2023 (see Figure 1) and has now reached extreme oversold levels. Over the past decade, gold has tended to find support when prices fall to 90% of its 200-day moving average (Figure 1, lower panel). The drawdown has reached -26% (Figure 1, middle panel), the largest drawdown in a decade since the lows of 2016. The U.S. Dollar Index (DXY) has increased by 2.91% year-to-date, while U.S. two-year yields have increased by 70 bps year-to-date. At the beginning of the year, fed funds futures were pricing in 2.3 rate cuts for the remainder of 2026. This has now shifted to 1.5 rate hikes due to the change in inflation expectations. There is still considerable debate over whether and when the Fed under Warsh might raise interest rates.
Figure 1. Gold Is Very Oversold (2016-2026)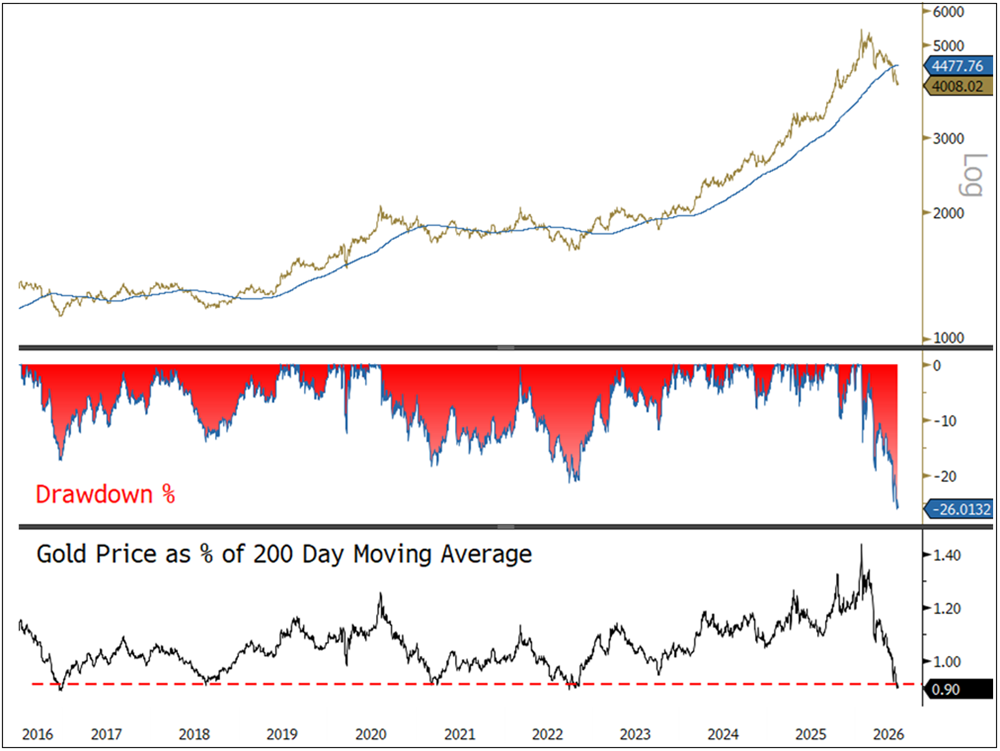
Source: Bloomberg. Gold bullion spot price, $/oz, daily, and 200-day moving average. Data as of 7/1/2026. Included for illustrative purposes only. Past performance is no guarantee of future results.
Navigating the AI Trade
Equity markets remained volatile in June as investors navigated an environment increasingly driven by AI enthusiasm, technical positioning, and market structure rather than by fundamentals. The S&P 500 Index posted a modest 1.06% decline for the month, but beneath the surface, the dispersion of returns widened significantly. Semiconductor stocks surged 11%, while the Magnificent 7, dominated by hyperscalers, fell 9%. Strong AI-related earnings, headlined by Micron Technology, Inc., reinforced semiconductor leadership and kept capital concentrated in a narrow group. At the same time, both rallies and selloffs were amplified by extreme call buying, leveraged ETF flows and repeated gamma squeezes 7, making price action increasingly flow-driven. Valuations remain historically very elevated, profitability is increasingly concentrated in a handful of mega-cap technology companies, and market breadth is narrow.
Meanwhile, the equity environment is becoming less supportive. Buybacks are declining and a wave of AI-related IPOs, secondary offerings and capital raises could significantly increase equity supply over the coming years. At the same time, AI-related earnings growth and investment are robust and economic activity is resilient, providing support for corporate profits and overall market sentiment. AI remains a powerful investment theme, but elevated valuations, rising issuance and speculative market dynamics suggest equity markets have become more vulnerable to volatility.
Part 1. Kevin Warsh, the Fed, and Emerging Policy Conflict
Monetary Policy: Hawks versus Pragmatists
One of the biggest questions facing markets today is whether Fed Chair Kevin Warsh is a hawk or a pragmatist. Will he prioritize inflation control or accommodate the political and market pressures for lower interest rates? Warsh inherited an economy that remains surprisingly resilient. Labor markets are strong, growth is solid, asset prices are elevated, and inflation is still running well above the Fed’s 2% target. Simultaneously, President Trump has repeatedly called for lower rates. There is a tension between economic realities and political expectations.
The debate is shifting from rate cuts to whether higher rates are needed.
Warsh's inherited problem is that inflation never really died. The economy has refused to slow, job openings remain elevated, payroll growth has surprised to the upside, consumer spending is healthy, and manufacturing and services activity continue to expand. Meanwhile, inflation remains sticky. Core PCE inflation8 is running around 3.3–3.4%, headline CPI inflation remains above 4%, and services inflation continues to prove difficult to tame. The AI buildout is also creating new inflationary pressures as memory shortages and rising component costs feed into consumer prices. Investors are increasingly concerned that inflation may be more persistent than policymakers and markets expected.
A key question around Warsh is whether the neutral rate of interest, or r-star,9 has moved materially higher. Massive AI-related capital spending, resilient growth, tight credit spreads, and strong equity markets all suggest the economy may be able to absorb higher rates without a significant slowdown. If that is true, real current policy may be far less restrictive than commonly assumed. This shifts the debate from when the next rate cut might occur to whether higher rates may eventually be needed to keep inflation under control.
Despite persistent inflation, investors seem skeptical that Warsh will deliver a genuinely hawkish policy regime. Many continue to believe in the "Fed put," the idea that significant market weakness would eventually force policymakers to reverse course and lower rates. The economy has also become increasingly dependent on asset prices. Strong equity markets support household wealth and consumer spending. Investors assume any meaningful tightening that threatens asset prices could quickly trigger pressure for easier policy. This continues to limit market confidence in a sustained hiking cycle.
Trump’s preferred outcome appears straightforward: lower rates, strong growth, rising equity markets and continued investment. The challenge is that the current economic backdrop does not clearly justify an easier policy. Warsh, therefore, finds himself caught between political demands for easier money and economic data that may argue for tighter policy. Maintaining Fed independence while navigating those pressures could prove challenging.
The rising tension between inflation, politics and central bank credibility creates an environment that has historically supported gold. Ultimately, the question is whether the Fed remains willing and able to prioritize price stability over political and market pressures. The answer to this question may prove far more important for gold than the precise path of interest rates over the next few quarters.
Part 2. U.S. Dollar Cyclical Strength in a Secular Decline
U.S. Dollar: Secular Decline, Cyclic Rallies
For years, we have maintained the view that the U.S. dollar is in long-term decline, not necessarily in exchange-rate terms, but in its purchasing power and role as the dominant store of monetary value. Massive fiscal deficits, a rising debt burden, persistent monetary expansion, accelerating central bank gold purchases and increasing geopolitical fragmentation all point toward the gradual erosion of the U.S. dollar-centric system.
Yet the reality is more nuanced. Despite repeated predictions of its demise, the dollar continues to stage powerful rallies periodically. These rallies put pressure on commodities, precious metals, emerging markets and risk assets. Gold may be in a secular bull market, but it has also experienced sharp corrections alongside silver, copper, oil and other hard assets.
A weakening monetary regime doesn't prevent powerful U.S. dollar rallies.
Understanding this apparent contradiction requires separating two forces that are often conflated. The dollar remains structurally indispensable to global financial system settlements even as its long-term role as a monetary reserve slowly erodes. In other words, the dollar may be experiencing secular decline, but it can still have powerful cyclical periods of strength for many years.
The U.S. dollar's importance extends well beyond its role as a reserve currency. Critically, it remains the world's primary funding currency. Global trade, commodity markets, sovereign borrowing and financial markets continue to rely heavily on dollar-based financing. Corporations, banks, governments and investors around the world have accumulated trillions of dollars in liabilities that must ultimately be serviced in U.S. dollars.
This creates a powerful dynamic. When financial conditions tighten, demand for dollars often rises rather than falls. As U.S. dollar funding becomes scarce, borrowers are forced to sell assets, reduce leverage and raise cash. Commodities, equities, bonds and even gold can become sources of liquidity. The result is a familiar pattern: the dollar rises, liquidity tightens, commodities weaken, emerging markets come under pressure and risk assets decline. Ironically, the very conditions that make investors bearish on the dollar often create the next wave of dollar demand.
Emergence of a Multipolar System
Every major U.S. dollar rally creates stress for the rest of the world. A stronger dollar increases debt-servicing costs for foreign borrowers, tightens global liquidity, raises funding costs and often forces traders to unwind leveraged positions and carry trades.
At the same time, dollar strength encourages central banks to diversify reserves. Countries increasingly seek to reduce dependency on a financial system that can be influenced and coerced by U.S. policy objectives. China has expanded the use of alternative settlement systems such as CIPS and mBridge,10 while many nations are exploring regional trade arrangements and various reserve diversification strategies.
Gold is becoming the reserve asset of a multipolar world.
The paradox is that the stronger the U.S. dollar becomes, the greater the incentive for countries to find alternatives to it. The most likely outcome is not the replacement of the dollar with a single reserve currency but the gradual emergence of a more diversified or multipolar system. The U.S. dollar may remain dominant in reserves and funding while other currencies gain influence in trade, regional currencies become more important, and gold acts as a neutral reserve asset between the various competing blocs. Hence, reserve managers seem focused on diversifying rather than replacing. They still need dollars; they just want fewer of them.
Gold occupies a unique position in this evolving framework as it is “outside money"11. Unlike sovereign currencies, it carries no political allegiance. Unlike government bonds, it has no counterparty risk. Unlike bank deposits, it cannot be frozen or sanctioned if held domestically. As geopolitical tensions rise and reserve diversification accelerates, central banks increasingly view gold as a strategic reserve asset. Its role is gradually evolving from an inflation hedge to a monetary hedge, a reserve asset and potentially a form of monetary collateral.
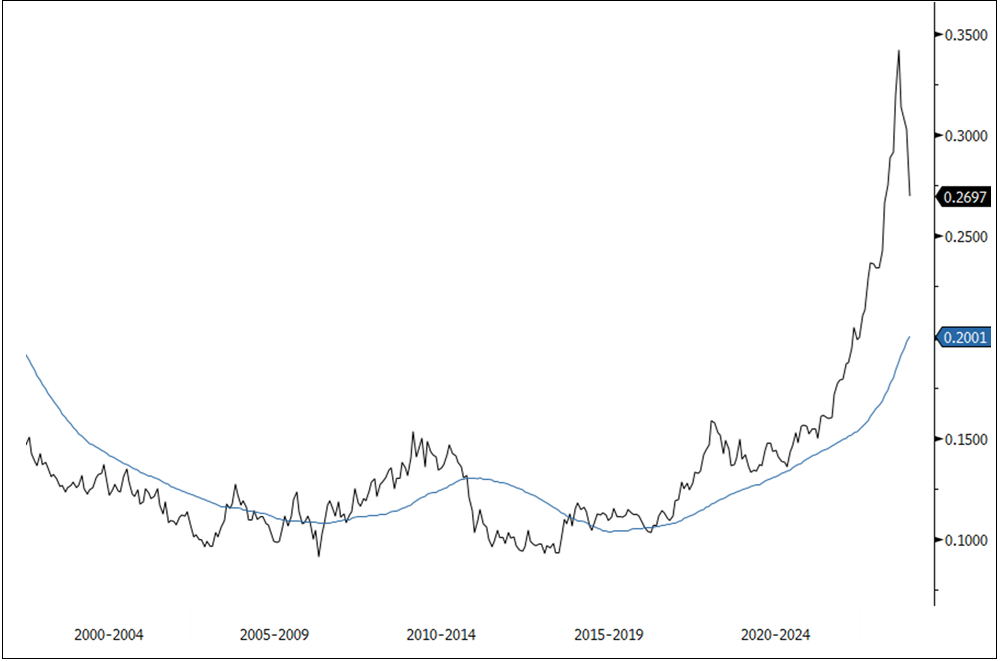
Before the Russia-Ukraine War, the IMF calculated that gold reserves, as a percentage of total world reserves, averaged ~12% since 2000 (see Figure 2). Since the freezing or seizure of Russia’s FX reserves and growing concerns of global currency and sovereign bond debasement, gold reserves as a percentage of total world reserves have soared to a recent high of ~34%, before closing the quarter at 27%. The long-term secular trend of gold returning as a strategic reserve asset remains intact.
Figure 2. IMF: Gold as % of Total World Reserves with 4-YR Moving Average
Source: Bloomberg. Data as of 6/30/2026.
Why Gold Falls During Crises
One of the most misunderstood aspects of gold is its tendency to decline during liquidity crises. Investors often expect turmoil to boost gold prices automatically, but history suggests otherwise. During periods of acute funding stress, market participants need dollars. To obtain those dollars, they frequently sell their most liquid assets. Gold, as one of the world's most liquid and desired reserve assets, often serves as a source of liquidity. This occurred during the 2008 financial crisis and the March 2020 pandemic shock, and could occur again during future dollar squeezes. This does not represent a failure of gold. It is gold performing its reserve function.
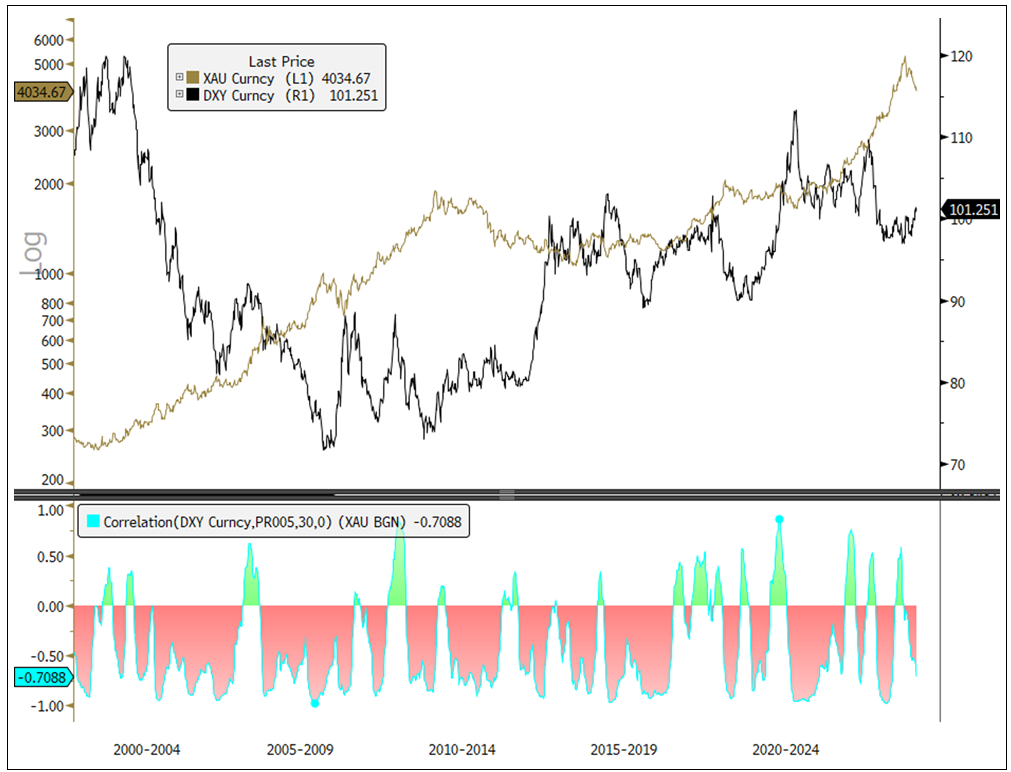
While gold continues its secular ascent as a reserve asset (Figure 2), its shorter-term price movements remain influenced by the U.S. dollar. Over the long run, gold and the dollar can rise for very different reasons: gold reflecting growing demand for a neutral reserve asset and store of value, and the dollar reflecting its central role in the global funding system. However, on a cyclical basis, gold still tends to exhibit a negative correlation with the U.S. Dollar Index (DXY). As shown in Figure 3, gold's long-term trend remains firmly higher, but periods of dollar strength have frequently coincided with temporary corrections or consolidation phases in gold prices. This distinction between gold's secular monetary revaluation and its cyclical sensitivity to dollar liquidity conditions is critical for understanding short-term volatility within a longer-term bull market.
Figure 3. Gold and DXY, Secular Rise with Cyclical Correlations
Source: Bloomberg. Data as of 6/30/2026.
The U.S. dollar could remain strong even as its long-term dominance slowly declines. Likewise, gold could experience meaningful corrections while remaining in a secular bull market. Periodic dollar rallies, tighter liquidity, commodity weakness and gold corrections drive the cyclical trend. The secular trend points toward reserve diversification, central bank gold purchases, alternative payment systems and a gradual decline in the dollar's share of global reserves. These forces are not contradictory. Each episode of dollar strength creates additional incentives for diversification, while each diversification effort reinforces gold's long-term monetary role. Each episode may accelerate the transition toward a more diversified monetary system, one in which gold increasingly serves as the neutral reserve asset linking competing currency blocs.
Silver Market: Sustained Structural Deficits
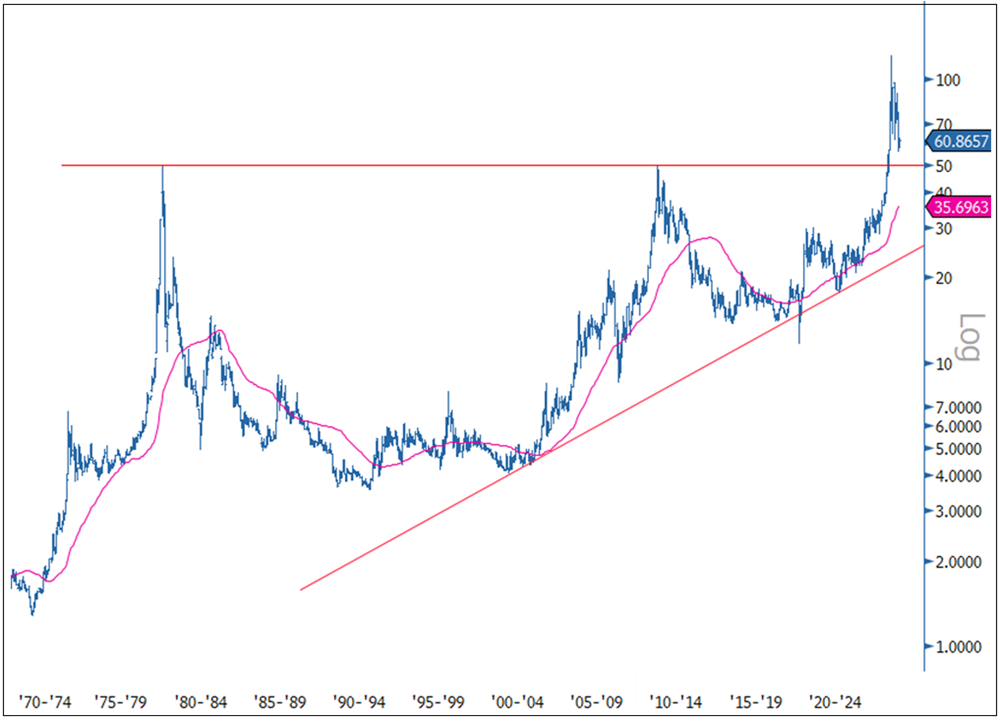
In June, spot silver fell sharply by $16.70 per ounce (-22.18%) to close the month at $58.60. June’s monthly decline was the largest since September 2011. For the quarter ended June 30, silver fell $16.57/oz, or -22.04%, the worst quarter since the first quarter of 2020 during COVID panic selling. Silver’s selling wave in June tracked gold’s plunge and was driven by the same macro forces: an expectedly hawkish Fed raising short-term rates and the U.S. dollar. Silver easily broke below support levels in a near-waterfall pattern, suggesting capitulation-driven selling sentiment. Despite the recent wrenching volatility, over a multi-decade period, the silver chart remains among the most bullish chart patterns we are aware of (see Figure 4).
Figure 4. Silver with 4-Year Moving Average (1970-2026)
Source: Bloomberg. Silver spot price, $/oz, daily and four-year moving average. Data as of 7/1/2026.
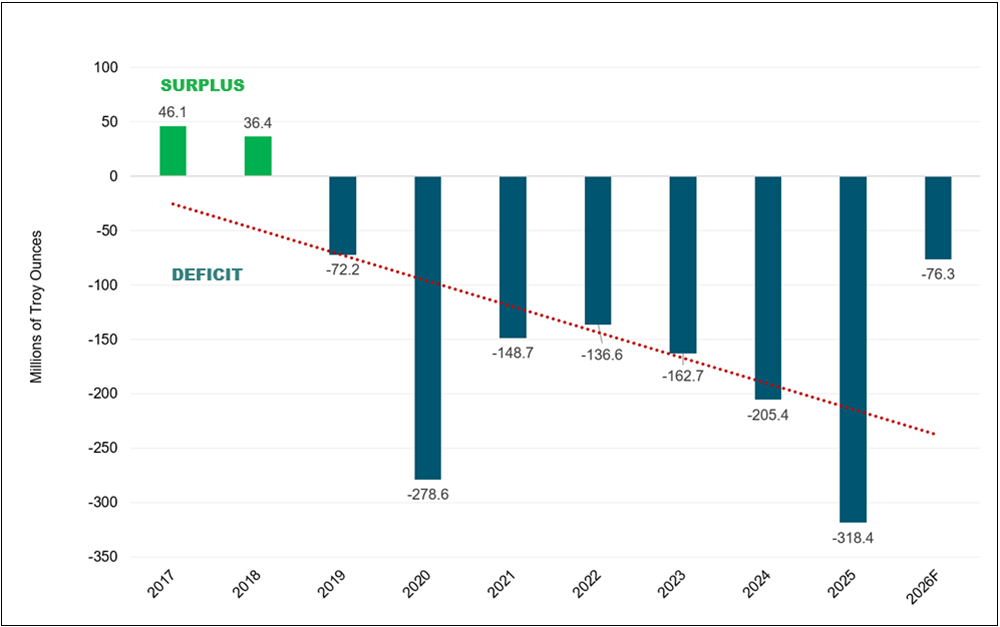
Silver’s price behavior over recent weeks reminds investors that it is one of the most volatile parts of the precious metals complex. The sharp correction may have tested sentiment, but silver’s long-term bullish fundamentals appear unchanged. These rest on the combination of constrained supply and growing demand. The market has been running persistent structural deficits for several years (see Figure 5). Annual supply shortfalls have steadily reduced inventories. Unlike many commodities, there are few large new mining projects that could materially alter the medium-term supply outlook. Silver supply is relatively inelastic even as demand continues to expand.
Silver's pullback tested sentiment, but not the structural bull case.
Several secular growth trends support demand. Solar panel manufacturing, electrification, electric vehicles, AI infrastructure, data centers and a wide range of technology applications underpin industrial demand for silver. Military consumption is also becoming increasingly important as silver's conductivity and strategic importance gain recognition across defense supply chains. Even in a slower economic environment, many of these end markets are likely to remain supportive.
Silver's monetary role may also be increasingly important. Investors often focus on gold as the primary monetary metal, but silver has historically participated in periods of currency debasement and monetary uncertainty. In this environment, silver benefits due to its growing appeal as an alternative store of value, essentially a higher-beta expression of the same themes that support the gold market.
Physical silver market dynamics also remain constructive. Tightness in physical inventories and ongoing delivery pressures have reinforced the view that physical demand remains strong relative to available supply. As more metal flows toward Asian markets and physical ownership continues to gain importance, paper-market pricing mechanisms may become less influential over time.
Importantly, silver's recent volatile correction is not unusual. Silver has shown significantly greater volatility than gold due to its smaller and less liquid market. Sharp drawdowns are a normal feature of silver bull markets, not evidence that the underlying fundamentals have failed. Historically, some of silver's strongest advances have occurred following periods of severe volatility and investor frustration.
The longer-term outlook remains constructive. Silver's unique combination of persistent supply deficits, expanding industrial demand, increasing monetary relevance, and tight physical market conditions provides multiple avenues for future appreciation.
Figure 5. Silver Market Deficits Persist (2017-2025)
Source: Bloomberg. Data as of 7/1/2026.
| 1 | Gold bullion is measured by the Bloomberg GOLDS Comdty Index. |
| 2 | Silver bullion is measured by the Bloomberg Silver (XAG Curncy) U.S. dollar spot rate. |
| 3 | The NYSE Arca Gold Miners Index (GDM) is a rules-based index designed to measure the performance of highly capitalized companies in the gold mining industry. |
| 4 | The Bloomberg Commodity Index (BCOM) is a broadly diversified commodity price index distributed by Bloomberg Indices. |
| 5 | The U.S. Dollar Index (USDX, DXY, DX) is an index (or measure) of the value of the United States dollar relative to a basket of foreign currencies, often referred to as a basket of U.S. trade partners' currencies. |
| 6 | The S&P 500 or Standard & Poor's 500 Index is a market-capitalization-weighted index of the 500 largest U.S. publicly traded companies. |
| 7 | PCE inflation is measured as part of personal consumption expenditures tracked by the U.S. Bureau of Economic Analysis within GDP accounts. CPI inflation is based on the consumer price index tracked by the Bureau of Labor Statistics. The Fed targets PCE inflation (specifically core PCE, which excludes food and energy) as its preferred gauge. Its stated 2% inflation target is a PCE target, not a CPI target. |
| 8 | A gamma squeeze occurs when market makers sell call options on a stock and hedge their positions by buying the underlying stock. As the stock price rises towards (or through) the strike price of the options, the option prices become more sensitive to the price of the underlying stock. The change in this sensitivity is called “gamma”. As gamma rises, market makers are forced to buy more of the underlying stock to hedge their positions, creating a feedback loop or “gamma squeeze.” |
| 9 | R-star (r*) is the "natural" or "neutral" real interest rate, the level of the short-term real interest rate that, in theory, keeps the economy at full employment with stable inflation, neither stimulating nor restricting growth. |
| 10 | CIPS (cross-border interbank payment system) is China's own payment messaging and clearing system for cross-border transactions in renminbi, launched in 2015 by the People's Bank of China. mBridge is a multi-central bank digital currency platform built on a custom blockchain (the "mBridge Ledger") that lets central banks settle cross-border payments directly in digital central bank money, peer-to-peer, bypassing correspondent banks entirely. |
| 11 | Gold is often described as the world's ultimate form of "outside money"—a monetary asset that is not simultaneously someone else's liability, making it uniquely valuable in a highly leveraged, debt-based financial system. |


Investment Risks and Important Disclosure
This article discusses a range of potential economic scenarios that could arise if current geopolitical conditions persist or deteriorate. These scenarios, including those expressed in the present or future tense, are illustrative only and should not be viewed as predictive, promissory or guaranteed.
Relative to other sectors, precious metals and natural resources investments have higher headline risk and are more sensitive to changes in economic data, political or regulatory events, and underlying commodity price fluctuations. Risks related to extraction, storage and liquidity should also be considered.
Gold and precious metals are referred to with terms of art like "store of value," "safe haven" and "safe asset." These terms should not be construed to guarantee any form of investment safety. While “safe” assets like gold, Treasuries, money market funds and cash generally do not carry a high risk of loss relative to other asset classes, any asset may lose value, which may involve the complete loss of invested principal.
Past performance is no guarantee of future results. Investments, commentary and statements are unique and may not be reflective of investments and commentary in other strategies managed by any other Sprott entity or affiliate. Opinions expressed in this presentation are those of the presenters and may vary widely from opinions of other Sprott affiliates. Forward-looking language should not be construed as predictive. While third-party sources are believed to be reliable, Sprott makes no guarantee as to their accuracy or timeliness. This information does not constitute an offer or solicitation and may not be relied upon or considered to be the rendering of tax, legal, accounting or professional advice. It does not constitute a recommendation to purchase, sell or hold gold, silver, mining equities, exchange-traded products or any other investment.