


Key Takeaways
- Debasement Trade Returns: Gold prices surged in August as investors shifted their focus away from the absolute level of interest rates to the reasons rates are rising, including market fears about fiscal sustainability, debt issuance and policy credibility.
- Fiscal Risk Reshapes Gold: Gold is trading less like a non-yielding asset, and more like a hedge against deteriorating sovereign liabilities, with U.S. national debt having topped $40 trillion and long-end Treasury yields up sharply as investors demand compensation for fiscal risk.
- Policy Tensions Build: A brewing standoff between the U.S. Treasury (trying to suppress long-term yields via "QE-light" measures) and the U.S. Federal Reserve (Fed), which is pushing for market discipline, creates two possible paths: financial repression or rising debt service.
- Central Banks Choose Gold: Record second-quarter central-bank gold buying shows gold increasingly being treated as "outside money," a neutral reserve asset shielded from sovereign debt and fiat currency risk.
- Silver May Amplify the Rally: Tight supply, shrinking inventories and renewed investment demand could fuel further gains and volatility.
Performance as of August 31, 2026
| Indicator | 8/31/26 | 7/31/26 | Change | Mo % Chg | YTD % Chg | Analysis |
| Gold Bullion1 | $4,437.38 | $4,046.15 | $391.23 | 9.67% | 2.73% | Gold surged on Fed and Treasury action. |
| Silver Bullion2 | $66.58 | $57.60 | $8.98 | 15.59% | -7.10% | Silver's beta to gold remains intact. |
| NYSE Arca Gold Miners (GDM)3 | 2,836.74 | 2,139.22 | 697.52 | 32.61% | 16.12% | Gold miners outperformed. |
| Bloomberg Comdty (BCOM Index)4 | 141.37 | 132.05 | 9.31 | 7.05% | 28.88% | BCOM back to near highs; all subgroups up. |
| DXY U.S. Dollar Index5 | 99.43 | 99.91 | (0.49) | -0.49% | 1.12% | DXY down while yields up; poor macro. |
| S&P 500 Index6 | 7,686.14 | 7,489.72 | 196.42 | 2.62% | 12.28% | Led by AI/tech/megacaps. |
| U.S. Treasury 10-YR Yield* | 4.75 | 4.73 | 0.02 | 2 BPS | 58 BPS | 10-YR Treasury yield at its highest since January 2025. |
| Silver ETFs** (Total Known Holdings ETSITOTL Index Bloomberg) | 801.29 | 789.13 | 12.16 | 1.54% | -7.08% | Silver ETF flows resumed in mid-July. |
| Gold ETFs** (Total Known Holdings ETFGTOTL Index Bloomberg) | 98.91 | 96.72 | 2.19 | 2.26% | -0.03% | Largest monthly inflow since September 2025. |
Source: Bloomberg and Sprott Asset Management LP. Data as of August 31, 2026.
* BPS stands for basis points. **Bloomberg Indices measure ETF holdings; the ETFGTOTL is the Bloomberg Total Known ETF Holdings of Gold Index; the ETSITOTL is the Bloomberg Total Known ETF Holdings of Silver Index.
Gold Market: Return of the Debasement Trade
In August, spot gold surged by $391.23/oz (+9.67%) to close the month at $4,437.38, marking its strongest monthly gain since January. The rally began around the $4,000 gold support level following the early-August U.S.-Japan yen intervention and the U.S. Federal Open Market Committee's (FOMC) July press conference (see Figure 1). Both events suggested policymakers were becoming increasingly focused on preserving financial stability and containing borrowing costs rather than maintaining an uncompromising stance against inflation and addressing the causes of excessive debt and deficits.
The bullish signal for gold strengthened on August 19 when the U.S. Treasury Department announced additional measures to support long-term bond markets through buybacks of long bonds financed by bill issuance. Gold subsequently rallied by roughly $300/oz as investors increasingly priced a return of the debasement trade.7 By month-end, however, the 10-year Treasury yield still closed at a new 52-week high, underscoring that official support measures had not addressed the market's underlying fiscal concerns.
Figure 1. Gold Rallies Above $4,000 (2025-2026)
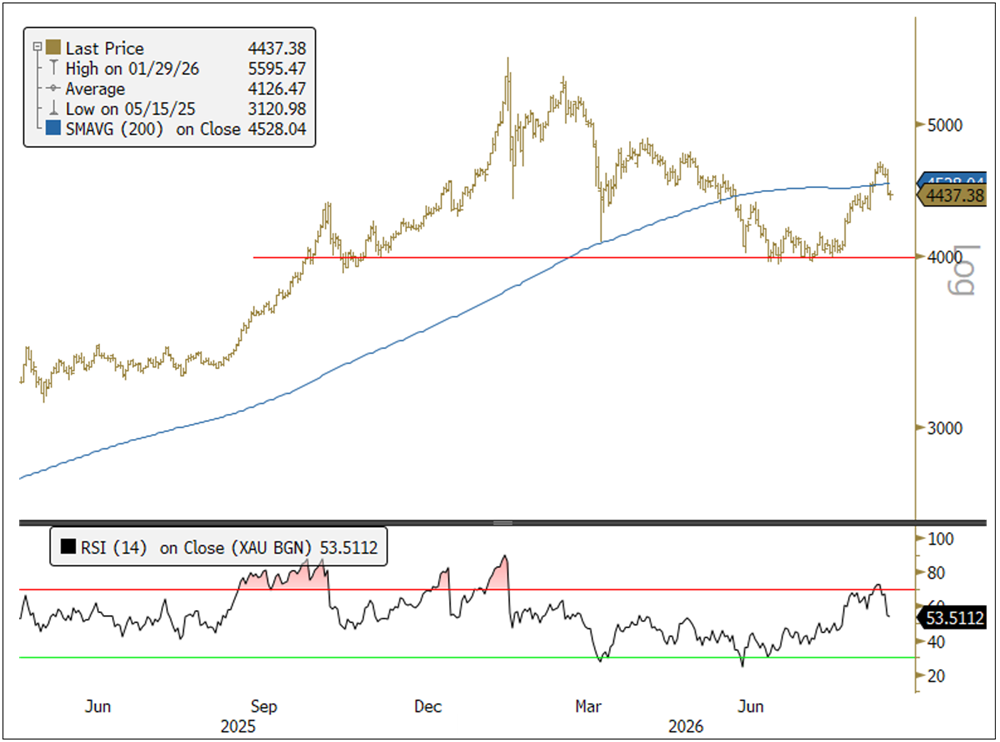
Source: Bloomberg. Gold bullion spot price, $/oz, daily. Data as of 9/1/2026. The 14-day RSI (relative strength index) is a momentum oscillator that measures the speed and change in price movements over a 14-day period, with values ranging from 0 to 100. Levels above 70 indicate overbought conditions, while levels below 30 indicate oversold conditions. Included for illustrative purposes only.
Broad Market Equities Benefit
Equities also benefited from the same forces driving gold. Easy financial conditions, Treasury efforts to contain long-term borrowing costs and growing expectations that policymakers would prioritize growth and market stability over inflation control reinforced the debasement trade across risk assets.
The market continued to focus on large-cap technology and AI-linked companies as investors prioritized accelerating earnings expectations, expanding AI capital spending and abundant liquidity over fiscal deterioration or elevated valuations.
In effect, both equities and gold responded to the same underlying dynamic: a market increasingly willing to discount future nominal growth while policymakers remain reluctant to tighten financial conditions meaningfully. Commodity markets broadly participated as well, reflecting growing demand for real assets as investors sought protection against currency debasement and showed declining confidence in the long-term purchasing power of sovereign liabilities.
Shifting the Focus to Fiscal Dominance
August marked a significant shift in the gold narrative. Between February and June, gold largely behaved as a real-yield trade. Rising TIPS8 yields, a stronger U.S. dollar and an apparently hawkish policy stance from the new Fed Chair, Kevin Warsh, created persistent headwinds for gold. That framework is quickly fading.
Rising debt is reshaping the case for gold.
Investors are no longer focused primarily on interest rates. Instead, they are increasingly focused on the reasons why rates are rising. Concerns about fiscal sustainability, debt issuance, sovereign balance sheets and policy credibility now appear to be driving market behavior.
This is the core of fiscal dominance: a regime in which government financing requirements increasingly influence the direction of monetary and liquidity policy. Under such circumstances, gold begins to trade less as a non-yielding asset and more as a hedge against the deterioration in the value of sovereign liabilities and fiat currencies.
The aftermath of the July FOMC meeting represented a critical turning point. Although the Fed left rates unchanged, long-end Treasury yields rose sharply. The 30-year real (TIPS) yield reached 3.05%, its highest level since 2008, and inflation compensation measures moved higher. The Treasury curve experienced a substantial bear-twist steepener,9 with long-term yields rising aggressively while short-end yields fell. Importantly, this was not a growth-driven steepening, but rather one caused by rising term premiums. Instead of expressing confidence in the Fed's inflation-fighting credibility, bond markets increasingly seemed to demand compensation for inflation uncertainty, rising debt issuance, and fiscal risk as U.S. Treasury debt crossed the $40 trillion threshold (see Figure 2).
Figure 2. U.S. Federal Debt Topping $40 Trillion (2000-2026)
U.S. Treasury total public debt (LHS) and U.S. 10-year bond yield (RHS)
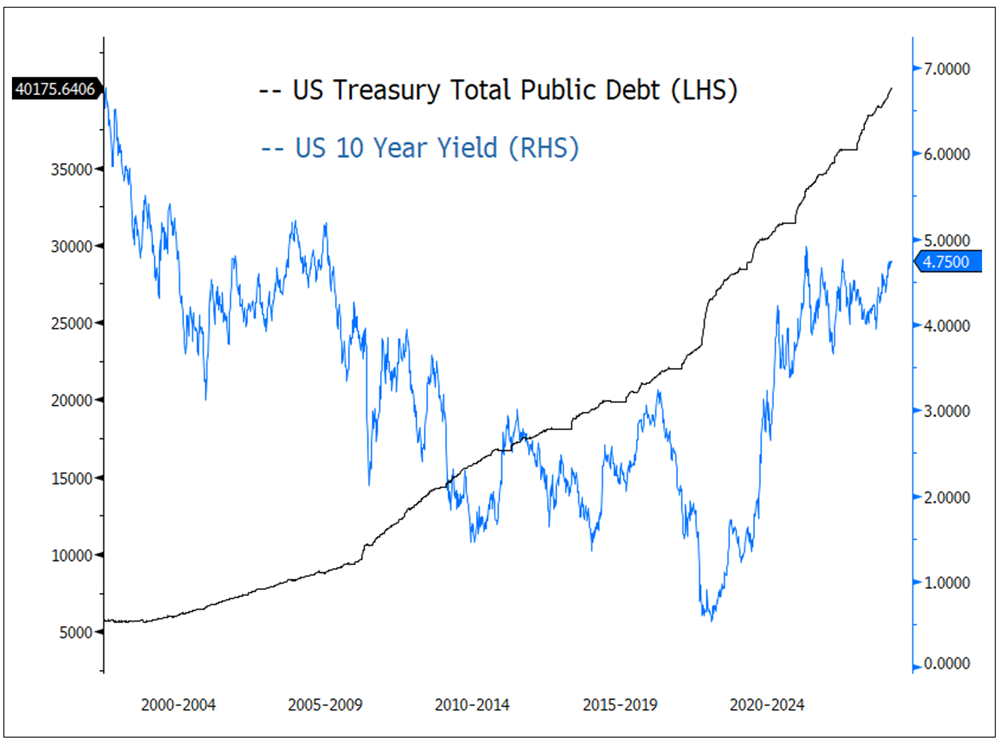
Source: Bloomberg. Data as of 9/1/2026.
The scale of the challenge is substantial. Of the approximately $40 trillion in U.S. federal debt, roughly $32 trillion is held by the public. The government must refinance an estimated $8-10 trillion annually while funding a budget deficit of approximately $2 trillion per year. At the same time, Treasury securities must increasingly compete for capital against equities and attractive private-sector credit opportunities as hyperscalers and megacap tech continue to require massive amounts of financing to build out AI infrastructure.
An important development in August was the continued rise in term premiums. The recent increase in Treasury yields has been driven more by higher real rates and expanding term premiums than by expectations for tighter monetary policy alone. Figure 3 shows that before the fourth quarter of 2023, term premiums were negative, indicating confidence in the Fed's credibility. By September 2024, as the Fed began its rate-cutting cycle, the expected rate path moved lower, but term premiums rose, keeping 10-year nominal yields elevated.
Figure 3. Rising Term Premiums
U.S. 10-year government bond term premium (LHS) and expected rate path (RHS)
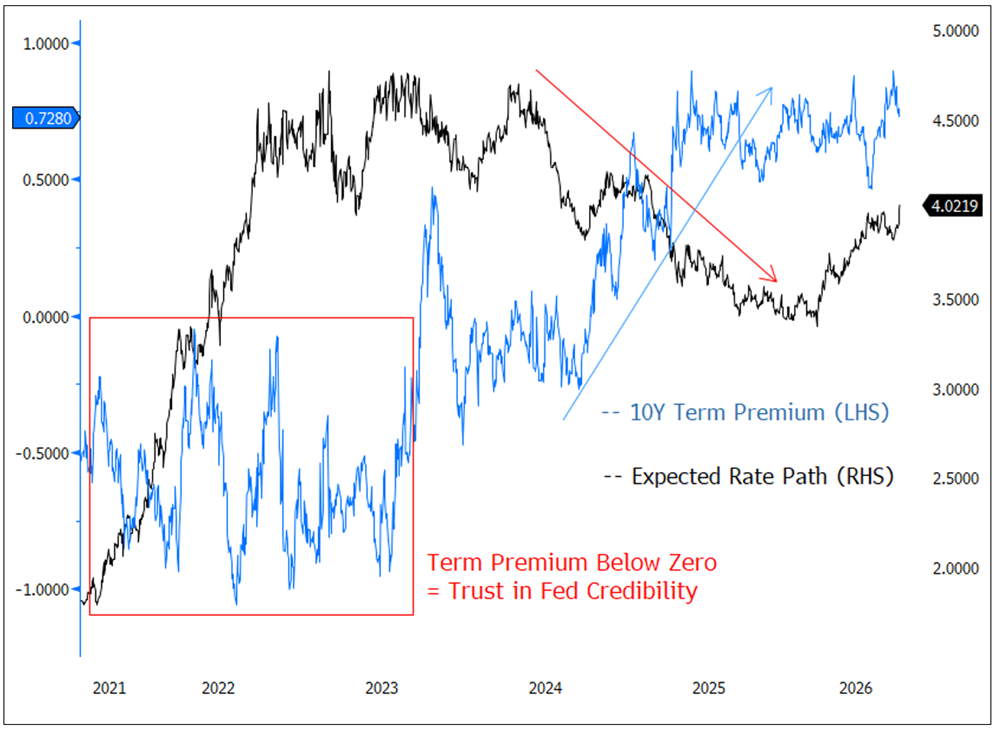
Source: Bloomberg. Data as of 9/1/2026.
The term premium reflects the compensation investors require for risks associated with inflation uncertainty, debt issuance, fiscal deficits and policy credibility. The market is pricing far more than inflation; it is increasingly calling into question the long-term fiscal trajectory of the United States.
Historically, gold, as a non-yielding asset, has traded inversely with real yields. August demonstrated that this relationship is becoming less consistent. Investors appear increasingly focused on why yields are rising rather than their absolute levels. Rising real yields driven by stronger growth remain a traditional headwind for gold. However, rising real yields, driven by term-premium expansion and fiscal concerns, support gold, as they reflect deteriorating confidence in sovereign balance sheets.
U.S. Treasury versus the Fed
The Treasury Department has increasingly moved beyond traditional debt management to influence long-term yields actively. Expanded buyback programs, increased bill issuance and the potential deployment of excess Treasury General Account balances all reduce the amount of duration the market must absorb.
When combined with the Fed's reserve-management operations, the overall framework increasingly resembles a form of "QE-light." 10 This is not traditional quantitative easing, but taken together, the measures create incremental liquidity and official demand for government debt.
Financial repression or rising debt costs; either path strengthens the case for gold.
Since the Fed began cutting rates in late 2024, long-term yields have generally moved higher rather than lower for the first time since the mid-1970s. Investors appear increasingly concerned that policymakers are becoming more focused on containing borrowing costs than addressing the fundamental drivers of those costs.
The growing tension between the Treasury Department and the Fed may become a more significant macro theme. The bond market increasingly appears to be forcing a choice between Fed independence and Treasury financing needs. Treasury is seeking to contain borrowing costs by actively intervening in markets. At the same time, Fed Chair Kevin Warsh has emphasized restoring market discipline by removing forward guidance and reducing large-scale Treasury purchases.
If the Treasury ultimately succeeds in influencing long-term yields, policymakers would move further toward financial repression, where nominal yields are managed. At the same time, inflation gradually erodes the real value of government liabilities. If Treasury fails to influence long-term yields, debt-service costs will continue to rise, creating even greater fiscal pressure. Both outcomes reinforce the strategic case for gold.
Why Higher Yields Are No Longer a Headwind for Gold
Normally, higher Treasury yields support the U.S. dollar by improving the relative attractiveness of dollar-denominated assets. August suggested a different dynamic may be emerging. Investors increasingly appeared to view higher yields as reflecting fiscal stress rather than stronger growth or tighter monetary policy. When rising yields are driven by concerns over debt sustainability, deficits and policy credibility, they can become currency-negative rather than currency-positive.
Fiscal stress turns rising yields into gold’s tailwind.
This distinction is important for gold. A market that believes policymakers are prioritizing debt-financing costs and financial stability over the preservation of purchasing power and wealth is increasingly likely to price in a debasement trade. In such an environment, gold benefits because those yields signal declining confidence in sovereign finances and fiat currencies.
Perhaps the strongest evidence supporting the broader gold thesis remains central-bank demand. South Korea announced it would resume gold purchases for the first time in 13 years, joining a growing list of reserve managers actively diversifying away from sovereign debt and fiat currencies. Global central bank purchases reached 289 tonnes in the second quarter of 2026, up 62% year-over-year and more than 10% above the 16-quarter average of 261 tonnes per quarter (see Figure 4).
Figure 4. Central Banks Want More Gold
Net quarterly gold purchases by central banks in tonnes
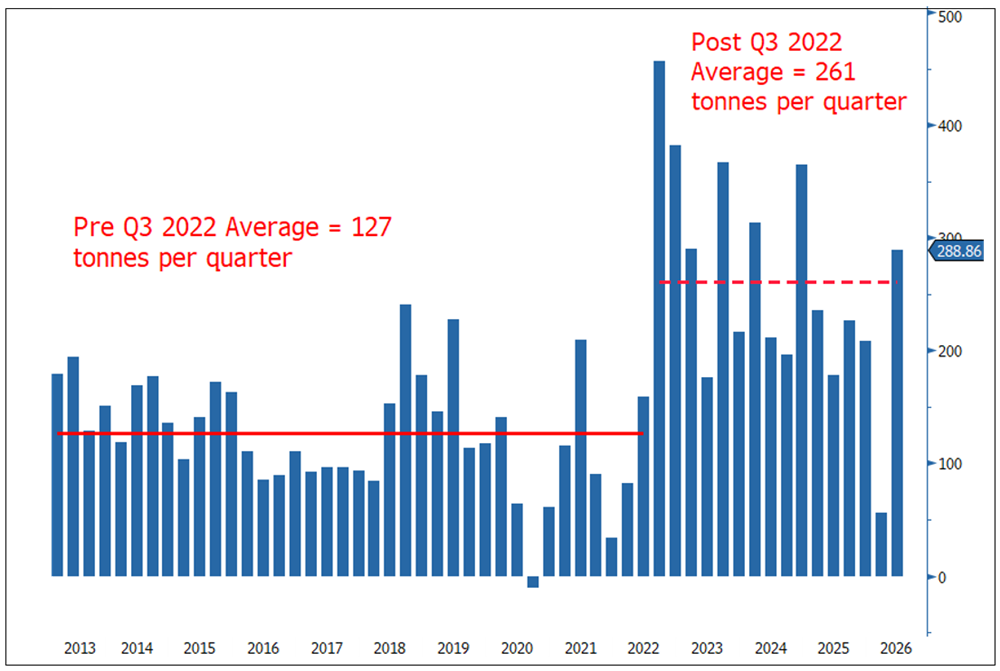
Source: Bloomberg. Data as of 9/1/2026. Included for illustrative purposes only. Past performance is no guarantee of future results.
Also noteworthy is that elevated central-bank buying is occurring despite historically high real yields (the U.S. 10-year TIPS yield was 2.43% on August 31). Under traditional financial models, high real yields should reduce gold's attractiveness. Instead, reserve managers continue to accumulate bullion.
Gold as Outside Money
The coordinated U.S.-Japan currency intervention in August represented the first U.S. intervention to buy yen since 1998. It highlighted growing concern surrounding the sustainability of the global yen-funded liquidity system and the potential consequences of a disorderly unwind of the yen carry trade.11
The intervention was less about currency exchange rates and more about preserving financial stability. Policymakers appeared focused on reducing the likelihood that forced sales of U.S. Treasury bonds would drive up long-end yields and cause broader disruption in global liquidity funding markets.
As confidence in sovereign liabilities weakens, gold’s value as outside money strengthens.
For gold investors, the significance lies in what policymakers were attempting to protect. As concerns increasingly shift from controlling inflation toward sovereign debt sustainability and market stability, gold's role as a neutral reserve asset becomes more valuable.
August may have marked the point at which the market shifted from focusing primarily on inflation and monetary policy toward fiscal credibility, financial repression and the long-term purchasing power of sovereign debt instruments. The key macro debate is no longer inflation versus growth, but whether fiscal dominance ultimately forces policymakers to adopt increasingly repressive financial measures. Rising deficits, expanding debt burdens, Treasury interventions and persistent central-bank buying all point toward the same conclusion. Fiscal deficits are driving fiscal dominance. Fiscal dominance increases the pressure for financial repression. Financial repression increases the probability of a renewed debasement trade. And gold sits at the end of that chain.
We believe central banks increasingly view gold as outside money rather than simply an inflation hedge. They seem to think that it is more important to diversify away from sovereign liabilities, geopolitical exposure and sanctions risks than to maximize yield.
The market seems to agree. In August, investors also returned to viewing gold less as a commodity or inflation hedge and more as outside money: an asset free from sovereign liabilities, fiscal deficits and policy intervention. As investors increasingly question fiscal credibility and the long-term purchasing power of government liabilities, gold remains one of the clearest beneficiaries.
Silver: Rides on Gold's Coattails
The Silver Spring Coils Again
Silver's dual monetary/industrial drivers are well understood across precious metals markets, and monetary demand was firmly in the driver's seat for August. Since the end of July, silver has rallied to $66.58/oz from $57.60/oz, logging its strongest monthly advance since prices hit their mid-July trough. Silver both tracked and surpassed gold's rally thanks to silver's higher beta vs gold. While a period of consolidation remains possible amid ongoing rate volatility, recent action suggests that silver may be winding up for another move.
Silver’s volatility can be its strength when precious metals rally.
Investors need no reminder that silver tends to exhibit greater volatility than gold. Yet in certain environments, what is often perceived as a drawback can become a distinct advantage. Investors need look no further than the tremendous rally from October 25, 2025, to January 28, 2026, during which spot silver surged from $46.85 to $116.70, outperforming gold handily.
The oft-quoted gold-silver ratio embodies this relationship, which historically has reverted to its mean after outsized advances or declines. Following the gold-silver ratio's peak of 104.73 on April 21, 2025, a consequent broadening of the precious metals rally, potentially catalyzed by Liberation Day tariffs, sent the ratio down to 46.22 by the late January 2026 peak in silver.
While the retracement from January's peak may appear dramatic, history suggests that sharp reversals following silver's advances are not unusual. During the 2011 bull market in precious metals, silver rallied amid sovereign debt concerns and accommodative U.S. monetary policy, driving the gold-silver ratio to a low of 31.72 on April 28, 2011. The subsequent correction saw much of that performance unwind. Likewise, since February, the gold-silver ratio has largely normalized, fluctuating between 56 and 72. Notably, this remains largely consistent with the long-term post-Bretton Woods (1971-present) average of approximately 62.9. Fast forward to today, and the spring may be coiling once again, as the revival of the debasement trade rekindles investor demand.
Figure 5. Historical Gold/Silver Ratio Post-Bretton Woods (August 1971-2026)
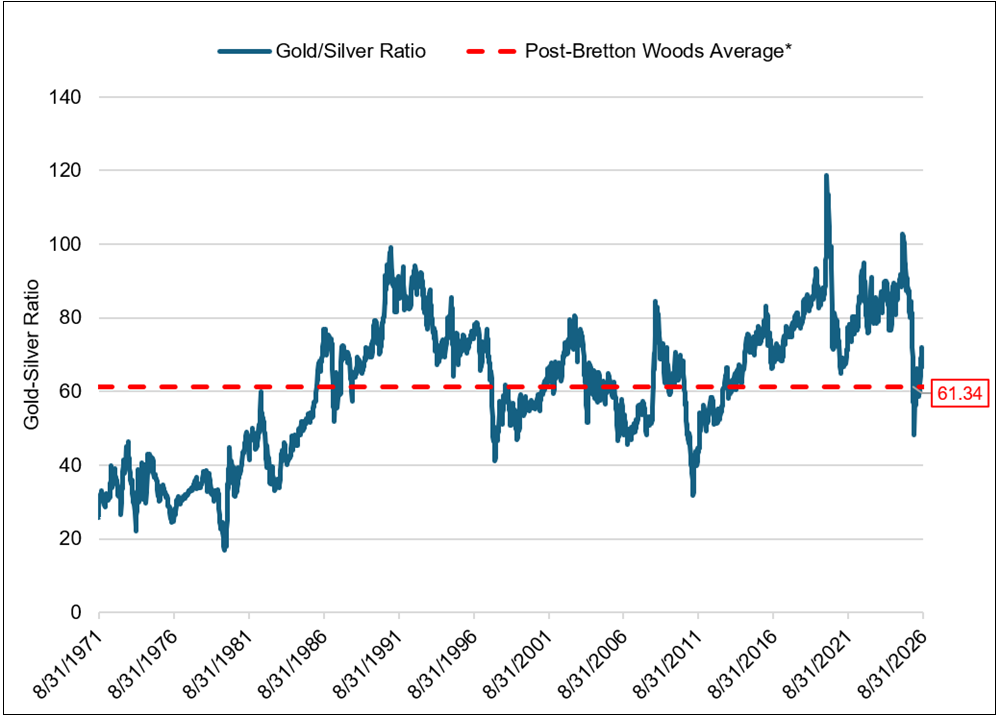
Source: Bloomberg. Data as of 8/31/2026. Gold/Silver Cross from 8/15/1971 – 8/31/2026.
From Supply Squeeze to Price Surge
One of the clearest signals preceding silver's tremendous rally in late 2025 was a spike in silver lease rates,12 reflecting mounting stress in the physical market and a scarcity of readily available inventory. For context, lease rates represent borrowing rates charged for silver repurchase agreements, typically paid by industrial buyers seeking temporary access to physical metal. Borrowers return the silver at maturity, along with an agreed-upon lease rate.
On October 9, 2025, silver lease rates surged to ~35%, well above their historical average.13 Such an extreme move suggested that physical inventories available for leasing activity were unusually tight. Silver available for day-to-day OTC operations and leasing in London had fallen to ~136 Moz as of the end of September, less than 1/3 of the daily OTC trading volume for 2025, at 450 Moz. The lack of silver available for day-to-day trading effectively left the market subject to disruption.
Silver scarcity sparked the rally. Investment flows helped carry it higher.
While the underlying factors that contributed to this environment can be tied to fundamentals, namely, nearly six consecutive years of supply deficits,14 we believe January's parabolic move in silver prices may have been exacerbated by a surge of flows into silver-backed exchange-traded products (ETPs) and tariff-related risks.
As of the end of September 2025, the second-highest level of inflows into silver ETPs on record left up to 83% of London's inventories spoken for. In the year leading up to the rally, ongoing concerns about potential tariffs imposed by the U.S. government also contributed to an outsized addition of silver to CME vaults,15 at the expense of London inventories. The culmination of these factors effectively starved London's silver inventories available for delivery, further bidding up lease rates, while contributing to a short squeeze that forced some industrial buyers to cover outstanding leases.16
Although lease rates largely rebalanced by November, the advance in silver prices persisted through January, underpinned by deficits, ongoing tightness in physical markets, and continued investor interest at higher prices, helping sustain momentum. ETP inflows drove silver prices higher all the way through January 28, well after lease rates had eased and tariff-related outflows had reversed. All told, from October 31, 2025, through the peak of the rally on January 28, 2026, silver prices had advanced by more than 140%.
Figure 6. Silver Price Momentum Persisted Long After Lease Rates Eased
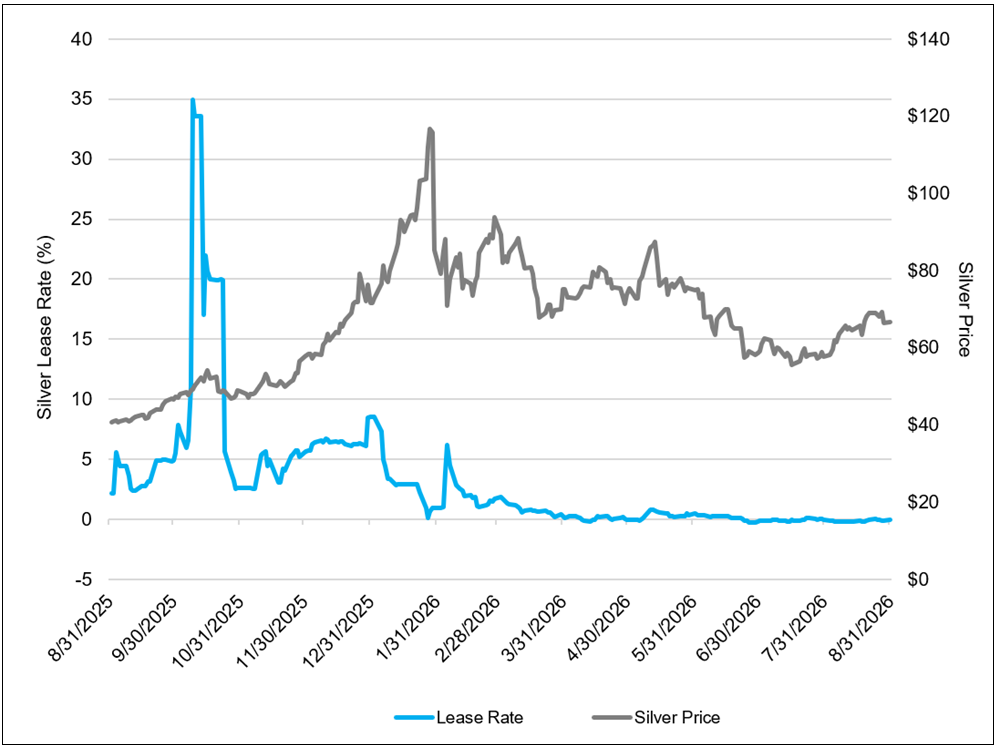
Source: Bloomberg. Data as of 8/31/2026. 1-Year Lease Rate and Silver Prices from 8/31/2025 – 8/31/2026.
Gold and Silver Set the Stage for Their Next Move
While Q2 saw a precious metals sell-off amid the January blow-off top and broader risk-off moves in response to the war in Iran, we believe silver may be setting up for its next move, driven by the same fiscal concerns, rising term premiums, and dollar headwinds that are driving gold's advance. At the same time, many of the conditions that led to the October 2025 silver squeeze remain in place. Silver supply remains in deficit, global silver inventories continue to decline, and recent rhetoric linking U.S.-Iran sanctions to Chinese trade serves as a reminder of ongoing trade risks. The key takeaway is this: while the market has largely normalized from a technical perspective, it remains among the thinnest-liquidity markets and may be subject to outsized price swings.
Going forward, macro fundamentals, fiscal deficits and rising term premiums all point to continued U.S. dollar weakness, potentially driving the next leg of the currency debasement trade. With gold charting the monetary course, having silver follow in its footsteps is positive, particularly if the silver spring begins to uncoil again and overshoot its gold cousin.
Footnotes
| 1 | Gold bullion is measured by the Bloomberg GOLDS Comdty Index. |
| 2 | Silver bullion is measured by the Bloomberg Silver (XAG Curncy) U.S. dollar spot rate. |
| 3 | The NYSE Arca Gold Miners Index (GDM) is a rules-based index designed to measure the performance of highly capitalized companies in the gold mining industry. |
| 4 | The Bloomberg Commodity Index (BCOM) is a broadly diversified commodity price index distributed by Bloomberg Indices. |
| 5 | The U.S. Dollar Index (USDX, DXY, DX) is an index (or measure) of the value of the United States dollar relative to a basket of foreign currencies, often referred to as a basket of U.S. trade partners' currencies. |
| 6 | The S&P 500 or Standard & Poor's 500 Index is a market-capitalization-weighted index of the 500 largest U.S. publicly traded companies. |
| 7 | The debasement trade is the strategy of shifting into hard assets like gold or other commodities on the expectation that governments will let currencies lose purchasing power through inflation rather than address fiscal imbalances through policy and discipline. |
| 8 | TIPS are Treasury Inflation-Protected Securities, U.S. government bonds whose principal adjusts with inflation (pegged to the consumer price index), so their yields reflect a “real” or inflation-adjusted return rather than a nominal return. |
| 9 | A bear-twist steepener is a shift in the yield curve where long-term yields rise while short-term yields fall, widening the gap between them. This means bond prices fall (“bear”), and the slope of the yield curve increases (“steepener”) while short-term and long-term rates “twist” in different directions. |
| 10 | “QE-light” (or “QE-lite”) refers to a more moderate form of quantitative easing that central banks may implement, typically involving smaller asset purchases or less aggressive monetary policy measures compared to traditional quantitative easing. It aims to stimulate the economy without the extensive balance sheet expansion associated with full-scale QE. |
| 11 | The yen carry trade refers to the strategy of borrowing in Japanese yen at low interest rates and investing the proceeds in higher-yielding assets elsewhere, profiting from the rate differential. The strategy leaves investors exposed to losses if the yen suddenly strengthens or funding costs rise, forcing a rapid unwind of the carry trade. |
| 12 | A fee paid by a borrower (such as a refiner, miner, or bullion dealer) to a lender for temporary possession of physical silver bullion. |
| 13 | Source: Bloomberg. Data as of 8/31/2026. Silver Lease Rate; .Silver G Index. |
| 14 | Source: Reuters, Silver faces sixth year of deficit with stock drawdown raising squeeze risks, research shows, 4/15/2026. |
| 15 | CME vaults refer to approved commercial storage facilities licensed by the CME Group to store physical precious metals that back futures contracts traded on the COMEX and NYMEX exchanges. |
| 16 | Source: The Silver Institute, 4/15/2026. |


Investment Risks and Important Disclosure
This article discusses a range of potential economic scenarios that could arise if current geopolitical conditions persist or deteriorate. These scenarios, including those expressed in the present or future tense, are illustrative only and should not be viewed as predictive, promissory or guaranteed.
Relative to other sectors, precious metals and natural resources investments have higher headline risk and are more sensitive to changes in economic data, political or regulatory events, and underlying commodity price fluctuations. Risks related to extraction, storage and liquidity should also be considered.
Gold and precious metals are referred to with terms of art like "store of value," "safe haven" and "safe asset." These terms should not be construed to guarantee any form of investment safety. While “safe” assets like gold, Treasuries, money market funds and cash generally do not carry a high risk of loss relative to other asset classes, any asset may lose value, which may involve the complete loss of invested principal.
Past performance is no guarantee of future results. Investments, commentary and statements are unique and may not be reflective of investments and commentary in other strategies managed by any other Sprott entity or affiliate. Opinions expressed in this presentation are those of the presenters and may vary widely from opinions of other Sprott affiliates. Forward-looking language should not be construed as predictive. While third-party sources are believed to be reliable, Sprott makes no guarantee as to their accuracy or timeliness. This information does not constitute an offer or solicitation and may not be relied upon or considered to be the rendering of tax, legal, accounting or professional advice. It does not constitute a recommendation to purchase, sell or hold gold, silver, mining equities, exchange-traded products or any other investment.