


Key Takeaways
-
Real Yields Spiked, Gold Held Firm: The 10-year TIPS yield jumped 49 basis points (Bps) in September, one of its largest monthly moves in 25 years. Gold’s resilience marked a break from its historically strong inverse relationship with real yields.
-
Higher Yields Worsen the Fiscal Problem: Roughly $10.5 trillion of U.S. federal debt must be refinanced within 12 months at higher rates, raising interest costs, widening deficits and requiring still more issuance.
-
Central Banks Seek Control, Not Just Ownership: Reserve managers increasingly view gold as an independent reserve asset, with some moving holdings from foreign vaults to secure physical access and jurisdictional control.
-
Today’s Headwind May Be Tomorrow’s Catalyst: If restrictive real rates weaken growth and strain government finances, the resulting policy response—accommodation or financial repression—could ultimately support gold.
-
Silver Faces Headwinds, But Retains Industrial Support: Higher real yields and a stronger dollar pressured silver in September, but elevated Shanghai premiums and stronger Chinese factory activity point to resilient industrial demand.
Performance as of September 30, 2026
| Indicator | 9/30/26 | 8/31/26 | Change | Mo % Chg | YTD % Chg | Analysis |
| Gold Bullion1 | $4,157.41 | $4,437.38 | -$279.97 | -6.31% | -3.75% | Gold is under pressure from the USD and real yields. |
| Silver Bullion2 | $60.43 | $66.58 | -$6.15 | -9.24% | -15.68% | Despite volatility, silver gained 3.12% in Q3. |
| NYSE Arca Gold Miners (GDM)3 | 2,522.67 | 2,836.74 | (314.07) | -11.07% | 3.27% | Gold miners declined in September, despite a strong Q3. |
| Bloomberg Comdty (BCOM Index)4 | 141.78 | 141.37 | 0.42 | 0.30% | 29.26% | Highest monthly close since December 2012. |
| DXY U.S. Dollar Index5 | 101.45 | 99.43 | 2.02 | 2.03% | 3.18% | DXY rallied to ~2026 YTD highs. |
| S&P 500 Index6 | 7,651.54 | 7,686.14 | (34.60) | -0.45% | 11.77% | S&P 500 near highs on extremely poor breadth. |
| U.S. Treasury 10-YR Yield* | 5.28 | 4.75 | 0.53 | 53 BPS | 111 BPS | Highest monthly close since March 2002. |
| Silver ETFs** (Total Known Holdings ETSITOTL Index Bloomberg) | 803.95 | 802.85 | 1.09 | 0.14% | -6.77% | Third month moving higher. |
| Gold ETFs** (Total Known Holdings ETFGTOTL Index Bloomberg) | 100.93 | 98.91 | 2.02 | 2.04% | 2.02% | Surpassed February 2026 highs. |
Source: Bloomberg and Sprott Asset Management LP. Data as of September 30, 2026.
* BPS stands for basis points. **Bloomberg Indices measure ETF holdings; the ETFGTOTL is the Bloomberg Total Known ETF Holdings of Gold Index; the ETSITOTL is the Bloomberg Total Known ETF Holdings of Silver Index.
Gold Market: Cyclical vs. Structural? The Market’s Core Tension
Spot gold fell $279.97 per ounce, or 6.31%, in September to close at $4,157.41. In the third quarter, however, gold gained $149.39, or 3.73%. September was dominated by a rapid rise in real yields and a stronger U.S. dollar. Early in the month, rising short-term yields, together with shifting expectations about likely Federal Reserve (Fed) policy actions, created significant volatility. Following the Fed's 25 basis point hike on September 16, gold rallied roughly $145 from its intraday low, suggesting that the immediate pressure from rate-hike expectations may have peaked. Attention increasingly shifted toward the long end of the Treasury curve, where rising yields and refinancing costs were worsening the U.S. fiscal outlook.
Figure 1. Gold's Strong Structural Trends
Gold bullion spot price in US$/oz with 14-day relative strength index
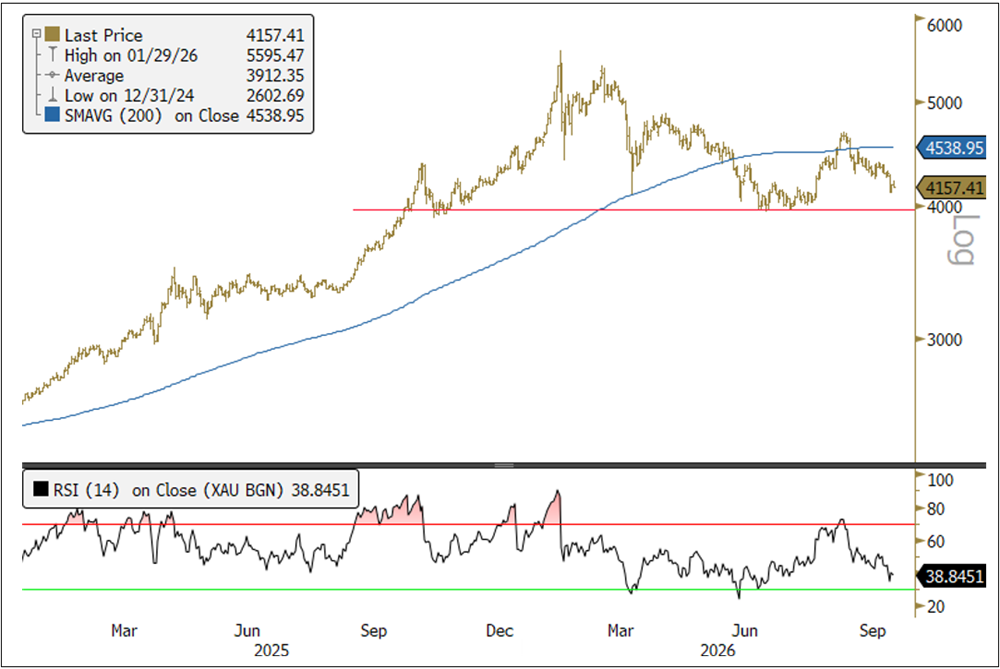
Source: Bloomberg. Data as of 10/2/2026. The 14-day RSI (relative strength index) is a momentum oscillator that measures the speed and change in price movements over 14 days, with values ranging from 0 to 100. Levels above 70 indicate overbought conditions, while levels below 30 indicate oversold conditions. Included for illustrative purposes only. Past performance is no guarantee of future results.
Underlying demand remained firm. ETF and futures flows7 recovered toward their January highs, while central bank demand remained historically strong despite slowing from the exceptional pace seen earlier in the year. Chinese physical demand was also notable: non-monetary gold imports to China reached 997 tonnes year-to-date through July, up 80% year-over-year, while August imports were 142 tonnes, up 46%. The increasingly important market tension is that cyclical forces, led by real yields and the U.S. dollar, remain short-term negative for gold. In contrast, structural forces, including fiscal risk, physical demand and reserve diversification, continue to support the longer-term gold thesis.
Gold in the Age of Fiscal Dominance
The defining macro development in September was the Treasury bond sell-off, particularly at the long end of the curve. Ten-year real yields, as measured by TIPS,8 approached 3%, rising roughly 49 bps during the month, one of the largest monthly moves in the past 25 years. More broadly, the rise in the 10-year nominal Treasury yield in 2026 has been driven predominantly by real yields, while the breakeven inflation yield has moved comparatively little.
This distinction matters for gold. Higher nominal yields driven by inflation expectations can still support gold if real rates remain contained. Higher real yields are more restrictive because they increase the inflation-adjusted return on government bonds and raise the opportunity cost of holding a zero-yielding asset. As Figure 2 highlights, gold has remained unusually resilient despite the sharp rise in real yields, marking a notable divergence from its historically strong inverse relationship with 10-year TIPS yields (note the inverted right axis).
Figure 2. Gold Is Diverging From Real Yields
Gold bullion spot price in US$/oz (LHS) and U.S. 10-year TIPS bond yield (RHS, inverted scale), monthly
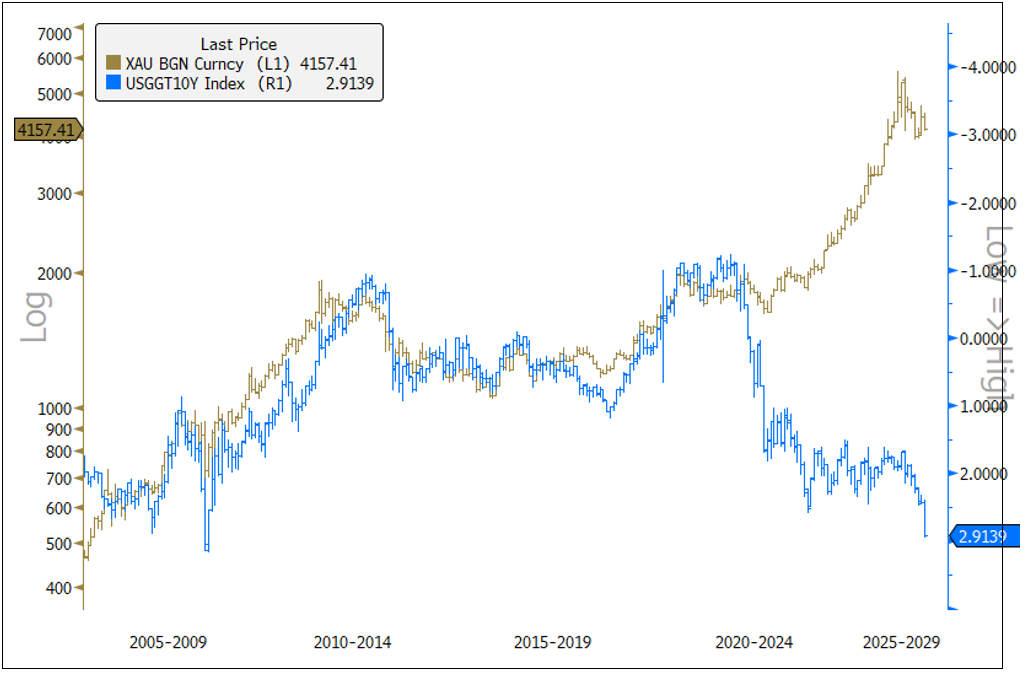
Source: Bloomberg. Data as of 10/5/2026.
The speed of the move matters as much as the level. Rapidly rising real yields lift discount rates, compress equity valuations and risk premiums, tighten financial conditions and increase the attractiveness of Treasury bonds relative to risk assets. Heavy Treasury supply, large investment-grade issuance associated with the AI capital cycle, and reduced demand from less price-sensitive sovereign buyers have added pressure on long-term yields and the term premium. The key question is whether strong growth and earnings can absorb real borrowing costs near 3% or whether the rate shock will eventually restrain consumption, investment and asset prices.
Gold’s resilience signals that fiscal credibility—not just real yields—is increasingly shaping investor demand.
The short-term effect on gold is negative. Yet gold's resilience is important. If investors can earn close to 3% after inflation on long-duration Treasuries, then gold faces competition. Its ability to hold up suggests growing demand from investors and reserve managers for assets that respond to risks that traditional real-rate models do not fully capture. These include fiscal sustainability, sanctions exposure, jurisdictional risk and the credibility of sovereign debt as a reserve asset.
Why Rising Yields May Strengthen Gold’s Long-Term Case
The deeper significance of the Treasury selloff is that higher yields do not necessarily resolve the underlying fiscal imbalance. In fact, they can worsen it. Large deficits require greater bond issuance, which forces private investors to bear more duration risk. If investors demand higher yields, Treasury interest expense rises just as existing debt is being refinanced. Larger interest expense then widens future deficits and requires still more issuance. The bond market becomes the transmission mechanism through which fiscal expansion collides with restrictive monetary policy.
This marks an important shift away from the post-GFC9 world of monetary dominance and toward a world of fiscal dominance. Under monetary dominance, the central bank can raise rates sufficiently to control inflation without destabilizing government finances. Under fiscal dominance, the scale of the debt outstanding and the cost of servicing it increasingly constrain monetary policy. Tightening suppresses private demand, housing and investment while simultaneously raising the government's interest burden. The policy intended to restrain inflation can therefore aggravate the fiscal problem.
The growing divergence between U.S. Federal debt and monetary liquidity (U.S. M2 money supply10) adds to this pressure. The debt-to-M2 ratio (see Figure 3) has risen from roughly 1.35x in 2022 to around 1.73x, above prior-cycle highs, as government debt creation has outpaced money-supply growth. Since the Fed is being restrictive rather than accommodating the fiscal expansion, the adjustment is increasingly being forced through higher bond yields, rising term premiums and tighter private-sector financial conditions. Ultimately, the widening gap between debt and monetary liquidity strengthens the case for some combination of fiscal consolidation, monetary accommodation or financial repression,11 with the latter outcomes particularly supportive for gold.
Figure 3. U.S. Debt Grows Faster Than Money Supply
Gold bullion spot price in US$/oz (LHS) and U.S. government debt to U.S. M2 ratio (RHS), monthly
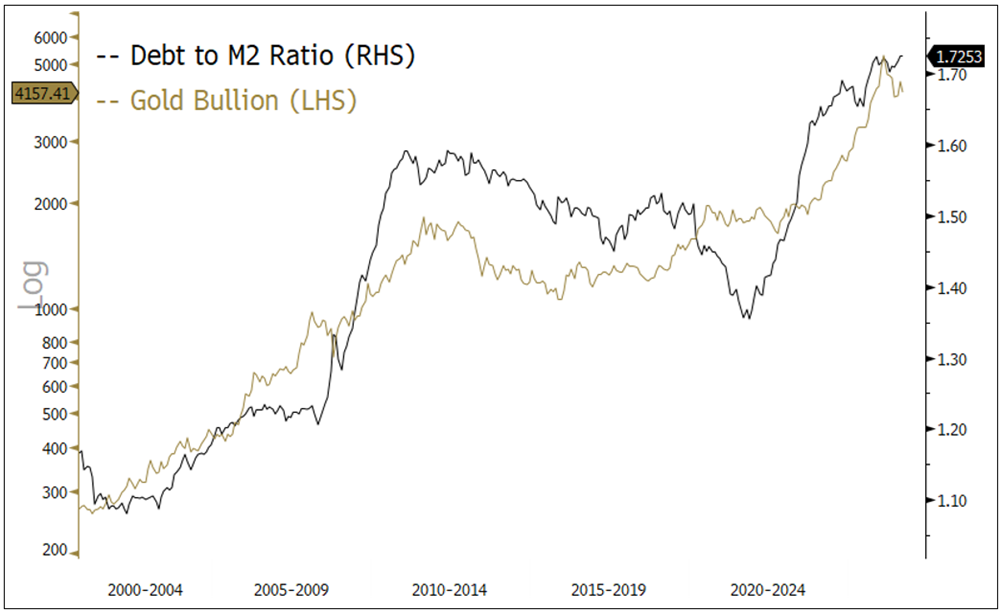
Source: Bloomberg. Data as of 10/5/2026.
The U.S. Treasury's refinancing cycle makes the tension increasingly visible. Federal debt totals approximately $40.2 trillion, on which annualized gross interest expense is about $1.36 trillion—a realized average interest rate of just 3.38% across all outstanding debt (see Figure 4). Market rates are now well above that level. As of September 30, Treasury bills were yielding 4.02%, two-year Treasuries 4.89% and 10-year Treasuries 5.28%. As maturing debt rolls over, those higher rates will progressively be reflected in the government's effective borrowing cost.
Figure 4. The Rising Cost of Borrowing
Annual U.S. government debt interest expense, $B (LHS) and realized average interest rate, % (RHS)
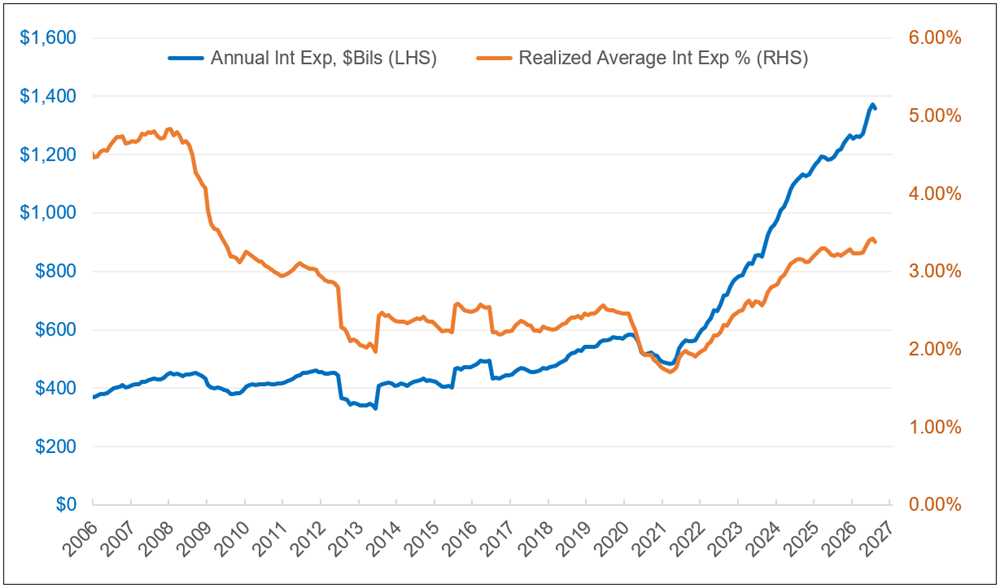
Source: Bloomberg. Data as of 9/30/2026.
Approximately $10.5 trillion—roughly one-quarter of U.S. federal debt (see Figure 5)—must be refinanced over the next 12 months at these notably higher rates. If debt continues to grow at its recent pace and the average interest rate rises by only 50 bps, annualized interest expense could rise from roughly $1.36 trillion to about $1.67 trillion. The danger is that a self-reinforcing fiscal loop sets in: higher yields increase interest expense, larger interest expense widens deficits, larger deficits require greater Treasury issuance, and greater issuance places further upward pressure on yields.
Figure 5. Facing a Near-Term Refinancing Wall
U.S. Treasury debt monthly maturity schedule, $Trillions
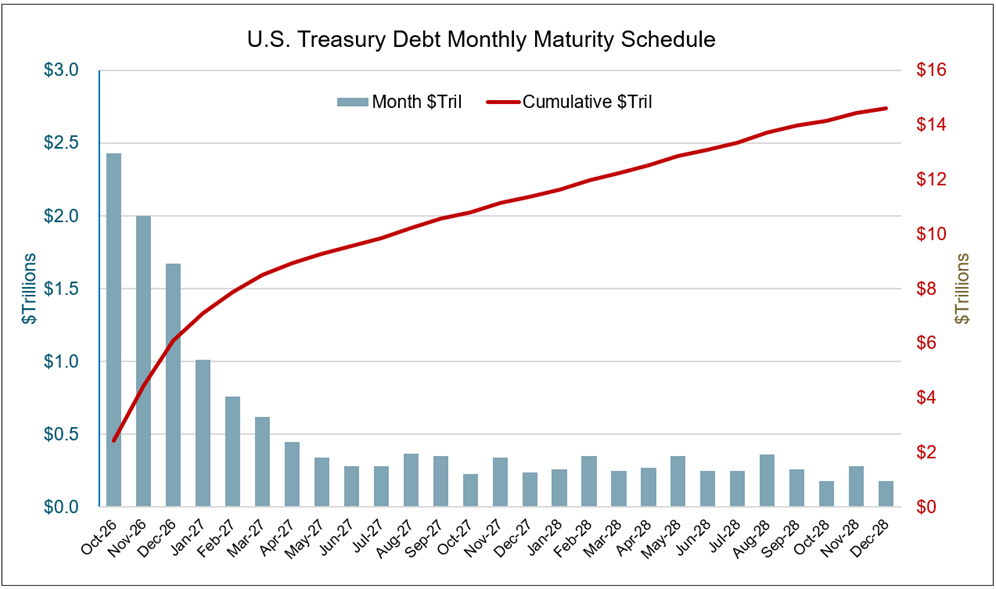
Source: Bloomberg. Data as of 9/30/2026.
The lag in refinancing is crucial. Interest expense has risen sharply since 2021, while the realized average interest rate cost has climbed more gradually and remains well below current market yields, as shown in Figure 4. This means much of the higher-yield refinancing cycle has not yet been fully passed through to the government's average borrowing cost. However, total interest expense has increased 2.8x since Q1 2021, growing at a 21% annualized rate, driven by higher total debt and higher yields. Sustained Treasury yields of 4-5% or higher, therefore, become progressively more consequential for the fiscal outlook, even if market rates remain near current levels. Speculation that the U.S. could outgrow its debt does not appear mathematically possible under current conditions.
This is where the short- and long-term implications for gold diverge. Rising real yields are a shorter-term cyclical headwind for gold. However, if those yields expose the economy and the fiscal system's dependence on low financing costs, they strengthen the structural case for gold. The key transition occurs when policymakers can no longer tolerate the real interest rate required to credibly suppress inflation.
The Economy Takes the Shock
Housing is already showing early signs of pressure. U.S. 30-year fixed mortgage rates reached roughly 7.3% during September as purchase and refinancing activity weakened. Similar pressure should increasingly be reflected in corporate financing costs, investment decisions, equity valuations and household consumption. A 3% real Treasury yield may be attractive to investors, but it also establishes a restrictive benchmark across the financial system.
Energy further complicates the policy dilemma. The U.S.-Iran war and elevated oil, diesel and transportation costs create supply-side inflation that conventional monetary tightening cannot directly resolve. Higher rates cannot increase oil production or refinery capacity; they can only weaken demand elsewhere. An energy shock, therefore, begins as an inflation shock but can evolve into a growth shock through lower purchasing power and higher operating costs. If inflation remains elevated as growth slows, the Fed faces an increasingly unattractive choice between maintaining punitive real rates and protecting growth, financial stability and government financing.
Gold’s strategic value rises as fiscal strain narrows policymakers’ room to maintain restrictive real rates.
The changing base of Treasury buyers strengthens this argument. Official reserve managers have historically purchased government bonds for liquidity, regulatory and strategic reasons rather than solely to maximize returns. As the marginal buyer becomes more price sensitive, investors demand greater compensation for inflation, duration and fiscal risk. Higher yields are the market's natural solution, but at some point, they may become politically and fiscally intolerable.
Treasury buybacks, maturity management, greater reliance on shorter-term bills and efforts to limit long-duration issuance do not constitute formal yield-curve control. They do, however, show how fiscal pressure can begin to influence the architecture of government financing. Policymakers ultimately have relatively few adjustment mechanisms: fiscal consolidation, faster nominal growth, higher inflation, renewed monetary accommodation or measures that suppress real borrowing costs. With meaningful fiscal consolidation politically difficult and stronger growth uncertain, some combination of monetary accommodation and financial repression becomes an increasingly plausible path of least resistance.
For gold, financial repression is more than inflation; it is a regime in which nominal yields fail to fully compensate investors for inflation, fiscal risk or currency debasement. Sovereign bonds may continue to provide nominal stability, but their real purchasing power becomes less dependable. This is the core of the debasement trade.12 Investors increasingly seek assets that can preserve purchasing power as rising fiscal burdens constrain policymakers’ ability to maintain restrictive real rates. Gold becomes more valuable precisely because it exists outside that policy framework.
Owning Gold Is Not Controlling Gold
The pattern of demand for gold from central banks reflects more than inflation concerns. Reserve managers must increasingly consider the possibility of asset seizure, negative real returns, sanctions risk and an issuing government’s ability to change the rules governing reserve assets. Gold, by contrast, is no one else's liability. When central banks hold physical gold in their home countries, it reduces both their counterparty exposure and dependence on another country's legal and financial infrastructure.
This is why reserve location matters. During 2026, France consolidated its remaining foreign-held gold in Paris, while the Netherlands shifted gold out of North America to improve liquidity and access in the event of a crisis. Germany has not initiated a new repatriation program, but there are renewed calls to repatriate its remaining gold held in New York, underscoring a growing focus on jurisdictional control. The broader message is that owning gold and controlling access to gold are not necessarily the same thing.
In a fractured reserve system, ownership of gold matters—but control of it matters more.
China's development of gold-related infrastructure adds another dimension. China and Hong Kong are developing vaulting, clearing, tokenized gold, Shanghai connectivity and renminbi repo arrangements13 that could make gold more usable as collateral, settlement infrastructure and a reserve asset. This does not require the renminbi to replace the dollar. The more consequential shift may be from a U.S. Treasury-centered reserve system toward a more diversified architecture in which gold plays a larger operational role. Reserve surpluses can increasingly be held in a neutral monetary asset that does not depend on another sovereign's fiscal credibility, political decisions or sanctions framework.
September highlighted the central tension in the gold outlook. Higher real yields remain gold’s most important cyclical risk. If real yields near 3% can persist alongside robust growth, fiscal sustainability and financial stability, gold could remain under pressure. But if restrictive real rates weaken housing and investment, raise debt-service costs and expose the system’s dependence on inexpensive funding, the same forces weighing on gold today may ultimately create the conditions for the policy response that supports it tomorrow.
Strong growth, supply constraints, energy inflation and heavy issuance are currently supporting higher real yields and creating a difficult backdrop for gold. The next phase begins when those real rates generate sufficient economic, financial or fiscal stress. If deficits and inflation remain elevated as growth weakens, policymakers will face a choice between sustaining monetary credibility and preserving system stability. That is the pathway from a real-rate shock toward fiscal dominance, financial repression and lower real returns on sovereign debt.
Gold’s resilience suggests this longer-term transition may already be influencing investor behavior. September’s bond sell-off is both a near-term headwind and a longer-term validation of the structural thesis. As the tension between monetary credibility and fiscal sustainability intensifies, the strategic case for gold strengthens: it is an asset outside the sovereign liability structure and, when physically controlled, outside another country’s jurisdiction.
Silver Faces Macro Headwinds, but Industrial Demand Remains Supportive
Spot silver prices fell to $60.43 from $66.58 in September, a 9.24% decline. However, silver finished the quarter up 3.12% from its start.14 Silver’s monetary factor remained the key driver of price moves, impacted by the same rapid rise in rates and dollar-strength tailwinds that weighed on gold. Silver-related ETFs also experienced net outflows amid negative monthly momentum.
Freely available silver supply is materially higher year-over-year (YoY), with inventories showing greater stability YoY, indicating a market that is largely in balance for the time being. PV-solar-related industrial demand among Chinese buyers appears set to fall in late 2026, largely due to continued silver thrifting and improved industrial methods, although we note that this factor may see diminishing returns over time.15 Supply side factors have added to the ongoing macro tailwinds for silver, driving its relative underperformance versus gold.
Shanghai premiums signal that Chinese demand for silver remains a key source of support.
Despite the muted forecast for solar PV demand, Shanghai Silver Premiums have remained materially elevated since the end of 2025, suggesting a persistently strong relative Chinese demand for silver even as physical inventories have largely replenished from last year’s lows.16 The recent improvement in Chinese factory activity also offers evidence that broader industrial demand remains intact. The official Chinese purchasing managers’ index (PMI) rose to 50.1 in September from 49.8 in August, ending two consecutive months of contraction, indicating a constructive signal for silver-intensive applications, such as electrical applications, robotics and AI-related infrastructure.17
Figure 6. Shanghai Silver Premiums Remain Elevated Year-Over-Year
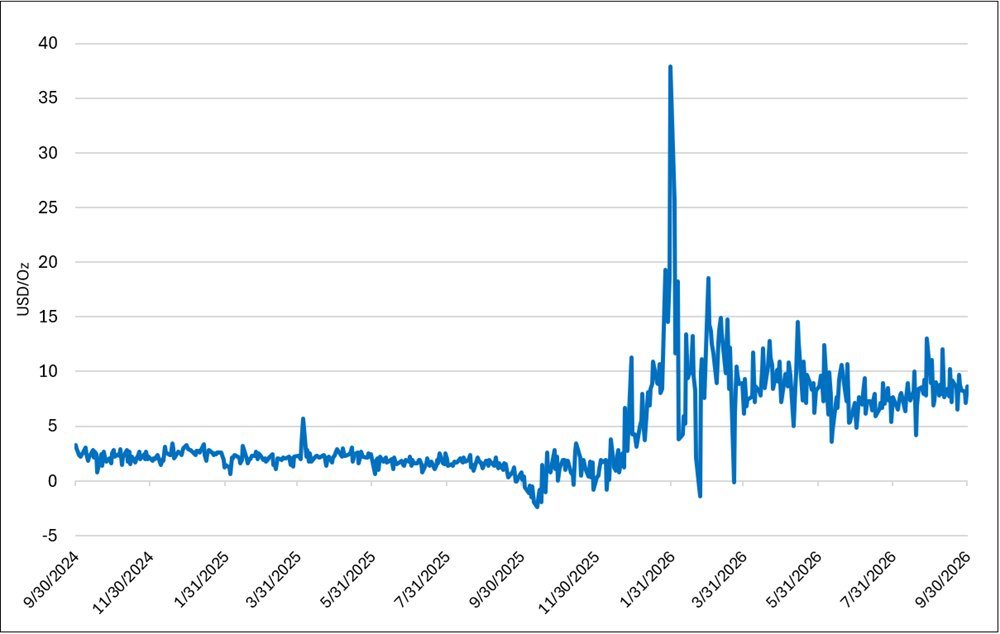
Source: Bloomberg (9/30/2024-9/30/2026). Shanghai Silver Premium.
While silver remains subject to the same rate-related headwinds that impact gold, it has the potential to outperform should rate pressures ease and markets stabilize. Market consensus points to the September spike in yields being driven by real rates and a resilient U.S. economy, both of which have weighed on the precious metals sector through the opportunity-cost effect. However, given silver's dual role as both a precious and an industrial metal, continued strength in industrial demand is likely to provide additional support and contribute to relative outperformance as macro headwinds stabilize.
Looking ahead, although long-term yields have continued to rise, technical indicators are showing signs of exhaustion in the current bearish bond trend, suggesting the recent move in yields may be approaching an inflection point.18 We also point to the upcoming U.S. midterm election and the potential for divided government in Washington. Such an outcome could constrain the scope of aggressive fiscal outcomes, potentially removing some upward pressure on long-term yields.19 While considerable uncertainty remains, any sustained easing of rate pressures alongside resilient industrial demand could improve the relative risk/reward dynamic for silver.
Footnotes
| 1 | Gold bullion is measured by the Bloomberg GOLDS Comdty Index. |
| 2 | Silver bullion is measured by the Bloomberg Silver (XAG Curncy) U.S. dollar spot rate. |
| 3 | The NYSE Arca Gold Miners Index (GDM) is a rules-based index designed to measure the performance of highly capitalized companies in the gold mining industry. |
| 4 | The Bloomberg Commodity Index (BCOM) is a broadly diversified commodity price index distributed by Bloomberg Indices. |
| 5 | The U.S. Dollar Index (USDX, DXY, DX) is an index (or measure) of the value of the United States dollar relative to a basket of foreign currencies, often referred to as a basket of U.S. trade partners' currencies. |
| 6 | The S&P 500 or Standard & Poor's 500 Index is a market-capitalization-weighted index of the 500 largest U.S. publicly traded companies. |
| 7 | Refers to futures and options positions in gold and ETF gold holdings as reported monthly by the U.S. Commodity Futures Trading Commission, which provides insight into speculative and institutional demand for gold. |
| 8 | TIPS (Treasury Inflation-Protected Securities) are U.S. government bonds whose principal adjusts with inflation (pegged to the CPI), so their yields reflect a "real" or inflation-adjusted return rather than a nominal one. |
| 9 | Post-GFC: refers to the lengthy period following the Great Financial Crisis of 2008/09, when central banks established significant influence over financial markets and economic conditions by using policies like quantitative easing. This dominance was characterized by central banks making substantial asset purchases and attempting to keep interest rates low to encourage growth. |
| 10 | The U.S. M2 money supply is a measure of the total money supply in the U.S. economy. It includes M1 (cash and checking deposits) plus savings deposits, small-denomination time deposits and balances in retail money market mutual funds. This represents money that is less liquid than M1 but can be converted into cash quickly. |
| 11 | Financial repression refers to government policies that keep interest rates low and channel funds to the public sector, often resulting in savers earning returns below inflation. This approach is used to reduce a country's debt-to-GDP ratio and can have significant long-term economic implications. |
| 12 | The debasement trade is the strategy of shifting into hard assets like gold or other commodities on the expectation that governments will let currencies lose purchasing power through persistent deficits, rising debt and inflation rather than address fiscal imbalances through policy and discipline. |
| 13 | China and Hong Kong are attempting to build an Asian alternative to London's gold infrastructure. The Chinese central bank is shifting some reserves from London into Hong Kong's expanding vaults and is trying to persuade other countries to hold their gold there or in the Shanghai Gold Exchange (SGE) vaults. A state-owned central clearing system entered trial in July 2026, featuring SGE connectivity, yuan gold futures and new renminbi liquidity facilities. China is also experimenting with tokenized gold and a gold-collateralized renminbi repurchase facility. |
| 14 | Bloomberg (8/31/2026-9/30/2026). Silver Spot Price. |
| 15 | Source: Mining.com, Silver Shortage Could Flip to Surplus in 2027: Deutsche, 10/5/2026. |
| 16 | Bloomberg (9/30/2025-9/30/2026). Shanghai Silver Premium. |
| 17 | Source: Reuters, Chinese factory activity expands in September amid AI boom, 9/29/2026. |
| 18 | Source: Barrons, Interest Rates May Be Peaking – and Silver is Quietly Flashing a Buy Signal, 10/1/2026. |
| 19 | Source: Morningstar, What the Midterm Elections Will Mean for Markets, 10/8/2026. |


Investment Risks and Important Disclosure
This article discusses a range of potential economic scenarios that could arise if current geopolitical conditions persist or deteriorate. These scenarios, including those expressed in the present or future tense, are illustrative only and should not be viewed as predictive, promissory or guaranteed.
Relative to other sectors, precious metals and natural resources investments have higher headline risk and are more sensitive to changes in economic data, political or regulatory events, and underlying commodity price fluctuations. Risks related to extraction, storage and liquidity should also be considered.
Gold and precious metals are referred to with terms of art like "store of value," "safe haven" and "safe asset." These terms should not be construed to guarantee any form of investment safety. While “safe” assets like gold, Treasuries, money market funds and cash generally do not carry a high risk of loss relative to other asset classes, any asset may lose value, which may involve the complete loss of invested principal.
Past performance is no guarantee of future results. Investments, commentary and statements are unique and may not be reflective of investments and commentary in other strategies managed by any other Sprott entity or affiliate. Opinions expressed in this presentation are those of the presenters and may vary widely from opinions of other Sprott affiliates. Forward-looking language should not be construed as predictive. While third-party sources are believed to be reliable, Sprott makes no guarantee as to their accuracy or timeliness. This information does not constitute an offer or solicitation and may not be relied upon or considered to be the rendering of tax, legal, accounting or professional advice. It does not constitute a recommendation to purchase, sell or hold gold, silver, mining equities, exchange-traded products or any other investment.