

Key Takeaways
- Uranium Miners Have Disconnected From the Commodity: Uranium equities have sold off sharply even as spot uranium prices remain firm and long-term contract prices have reached record levels.
- The Fundamental Uranium Thesis Remains Intact: Nuclear expansion, tightening inventories, energy-security priorities and a slow mine-supply response continue to support the need for new uranium production.
- Liquidity Pressures Appear to Be Driving the Selloff: Elevated volatility, deleveraging and pressure on high-beta small-cap equities have caused uranium miners to trade more like a risk asset than a reflection of uranium-market fundamentals.
- The Dislocation May Be Creating More Attractive Valuations: Uranium miners are now trading at unusually low levels relative to both spot and long-term uranium prices, while investor flows do not indicate a broad exit from the sector.
- A Reconnection Could Be Driven by Contracts and Improved Liquidity: As market conditions stabilize, additional utility contracting and operational progress could refocus investors on the earnings, cash flow and asset values supported by higher uranium prices.
Uranium's Fundamental Setup Remains Intact, But the Market is Tightening
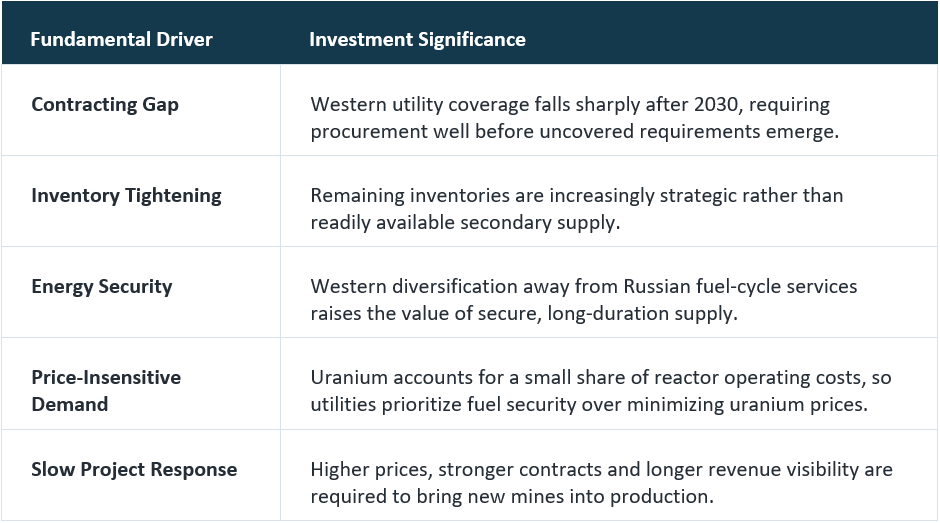
The long-term uranium thesis is strengthening even as uranium equities have weakened. Global nuclear capacity is entering a renewed expansion cycle at the same time that inventories are less available, the supply response is slowing and the cost of developing new mines is rising.
The central question is not whether uranium exists geologically. It is whether enough economic mine supply can be financed, permitted and delivered in time to meet future reactor requirements.
Demand is accelerating faster than uranium supply can respond.
Demand is moving from policy ambition toward execution. Rising electricity consumption, energy-security priorities and the growth of artificial intelligence and data centers are reinforcing the need for reliable baseload power. As of October 2026, 39 countries had endorsed the Declaration to Triple Nuclear Energy, which calls on participants to work together to advance an aspirational goal of at least tripling global nuclear energy capacity by 2050 from 2020 levels.1 According to the World Nuclear Association, this could lift global operable nuclear capacity from about 400 GWe at year-end 2025 to 1,457 GWe by 2050, assuming national targets are achieved, identified projects are delivered, and the existing fleet continues to operate. Reactors require fuel before entering service and then consume uranium for decades, so procurement and mine investment must precede the eventual demand by many years.
Uranium supply cannot adjust on the same timetable. New uranium mining projects commonly require 15 to 20 years to progress from identification through permitting, financing, construction and production. Since 2020, uranium prices have roughly tripled while mine output has risen by only about 50%, much of it from comparatively straightforward restarts. The next increment increasingly depends on greenfield projects with higher capital requirements, longer lead times and greater execution risk.
The uranium contracting market is beginning to recognize that reality. The long-term uranium price has reached a record $96 per pound, while utilities are accepting higher floors and ceilings in new contracts. These terms matter more to mine development than day-to-day spot volatility because producers need durable pricing and revenue visibility to finance new capacity.
Figure 1. Structural Drivers of Uranium Market Tightness
Source: Sprott Asset Management.
The Divergence: Miners Have Fallen Despite Firm Uranium Prices
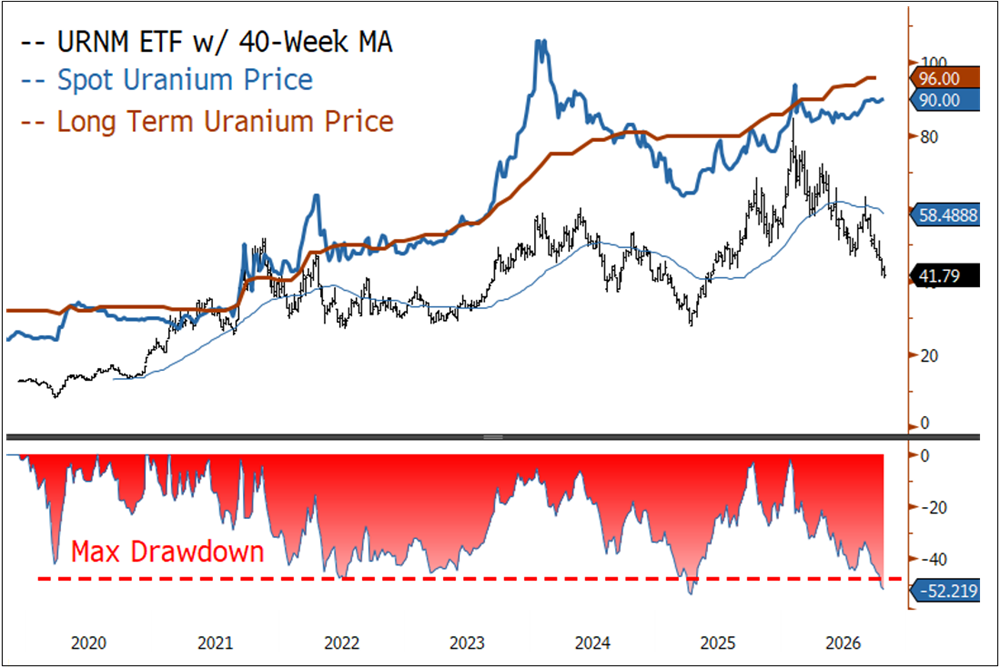
Against this constructive backdrop, uranium miners have experienced an unusually severe drawdown.
URNM is down approximately 49% from its peak (update # later), matching or exceeding its previous maximum drawdown, even as spot uranium has remained firm and long-term uranium prices have risen to record highs. The last comparable URNM drawdown occurred during the April 2025 tariff-driven market sell-off, when the S&P 500 fell roughly 19% from its February peak; by contrast, today the S&P 500 remains less than 2% below its recent high (update # later).
Uranium miners are pricing in a broad-market correction, not a deterioration in uranium fundamentals.
This contrast is important: uranium miners are experiencing a drawdown comparable to one associated with a broad-market correction, but without a similar decline in either the broader equity market or the underlying commodity. Other technical measures also point to deeply oversold conditions. The defining feature of the current setup, therefore, is the widening disconnect between stable-to-improving uranium fundamentals and sharply deteriorating uranium-equity prices.
That divergence argues against interpreting the miners’ decline as a clean read-through to the physical uranium market. Uranium equities embed operating, financing, development and market-beta risks that do not exist in the quoted uranium price. During periods of rising volatility, those equity risks can overwhelm the underlying commodity exposure, especially for smaller, less-liquid and pre-production companies.
Figure 2. Uranium Miners Are Trading at a Discount to Spot and Long-Term Uranium Prices (2020-2026)
Source: Bloomberg. Data as of xx/xx/2026. Uranium miners are measured by Sprott Uranium Miners ETF (URNM).
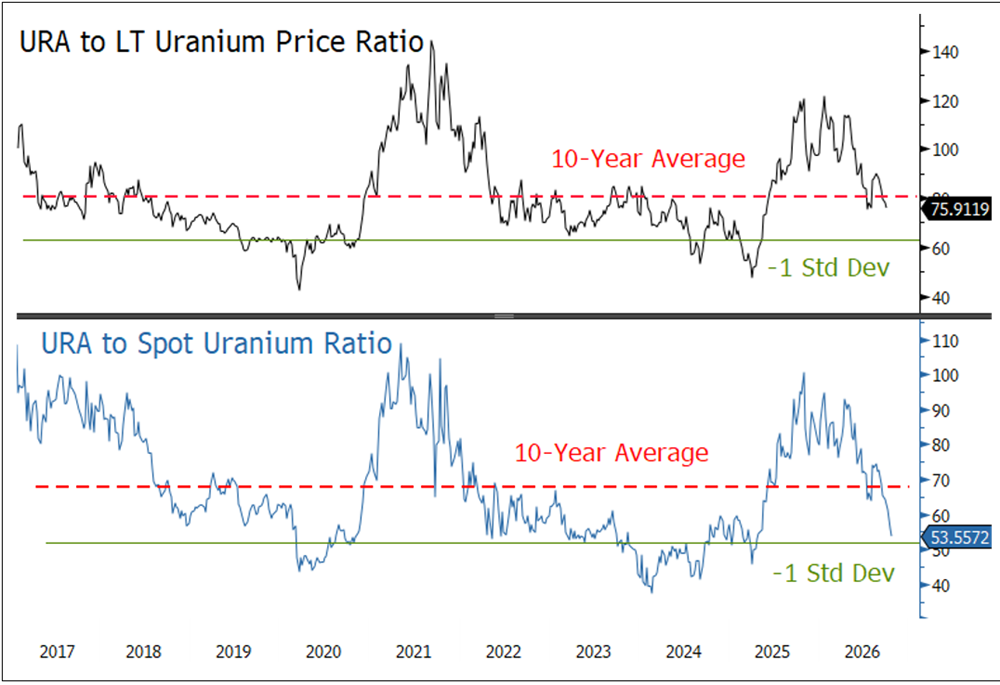
Relative-value measures show the same dislocation. Because Sprott Uranium Miners ETF (URNM)2 has a shorter history, Global X Uranium ETF (URA)3 provides the longer time series. The ratio of URA to the long-term uranium price is approaching one standard deviation below its historical relationship, a level reached relatively infrequently. The ratio to spot uranium has fallen rapidly below its 10-year average and is approaching the zone that has historically coincided with lower relative valuations, offering a more attractive fundamental entry point.
These ratios should not be treated as precise timing tools. Uranium miners typically carry high realized volatility, and historical technical levels can be overshot when broad-market volatility rises. Their value is as a valuation anchor: they show that uranium mining equities have become unusually inexpensive relative to both the spot price and contracting signals that ultimately drive industry economics.
Figure 3. Uranium Miners are Trading at a Discount to Spot Uranium Prices (2017-2026)
Source: Bloomberg. Data as of xx/xx/2026.
Liquidity Pressures Are Driving the Dislocation
1. Deleveraging Is Overpowering Commodity Fundamentals
Modern market structure can produce abrupt price moves that have little immediate connection to company-specific fundamentals. When volatility rises, leveraged investors reduce gross exposure, risk managers cut position limits, and systematic strategies sell assets with high realized volatility. The result is indiscriminate liquidation: what can be sold is often sold before investors distinguish between strong and weak fundamental stories.
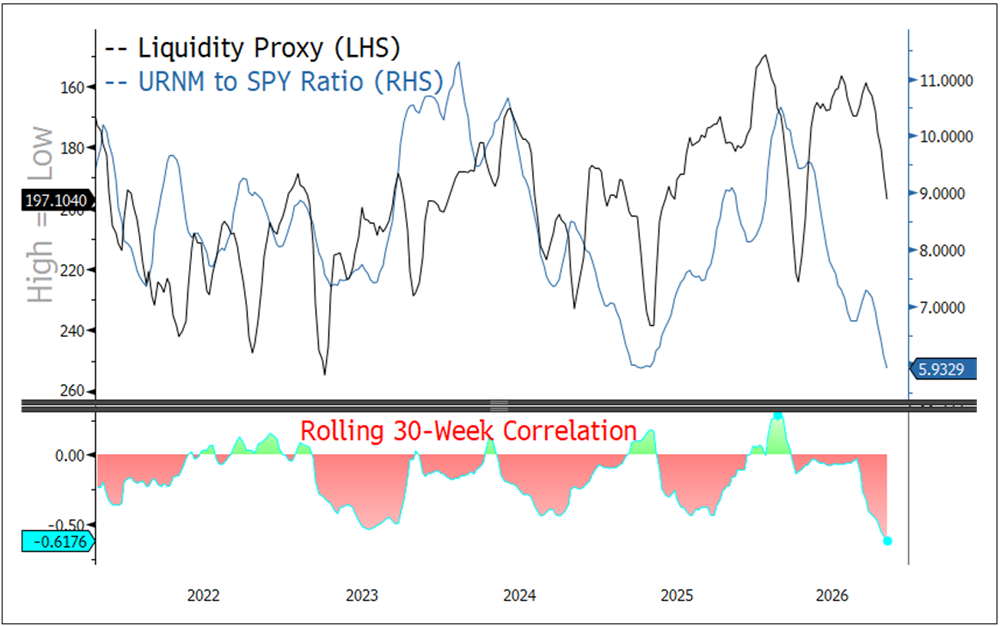
Our liquidity-pressure proxy combines the MOVE Index,4 which captures Treasury-market volatility and associated funding or collateral stress, with the VVIX Index,5 a measure of volatility-of-volatility, that provides an indication of hedging demand. It is not a direct funding-market indicator, but it provides a practical gauge of the conditions that often force position reduction. The ratio of URNM to the S&P 500 Index6 has broadly moved with this proxy, while the rolling correlation has recently become strongly negative.
In other words, the relative performance of uranium miners is currently behaving more like a liquidity trade than a uranium trade.
Figure 4. Uranium Miners Performance Has Become More Sensitive to Liquidity Stress (2022-2026)
Source: Bloomberg. Data as of xx/xx/2026.
2. URNM Has Begun Trading Like A High-Beta7 Small-Cap Asset
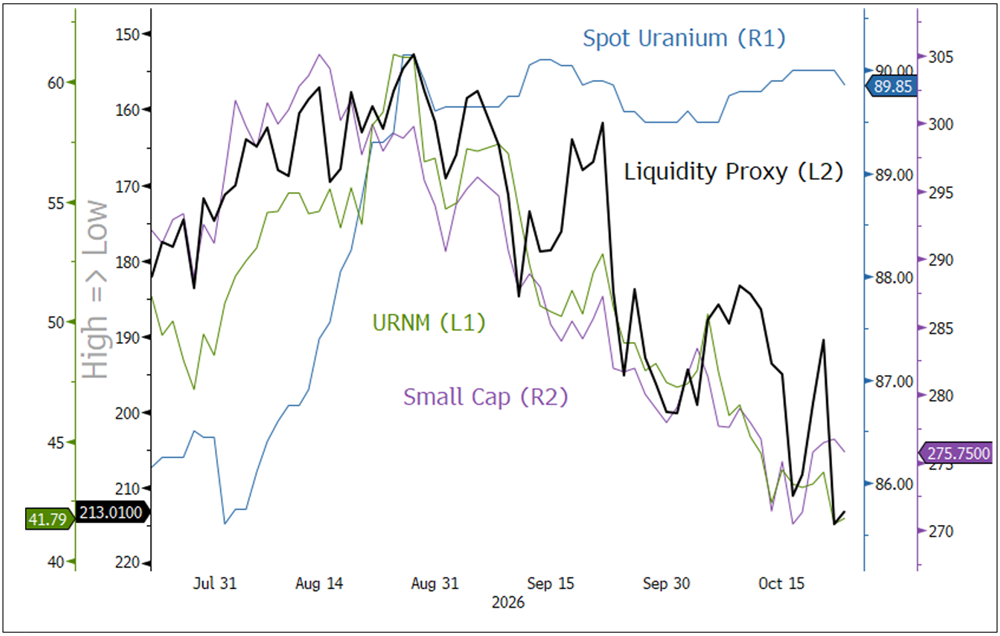
The shift became clearer as deleveraging pressures rose in late August. Before that point, URNM generally tracked spot uranium. Since then, URNM has decoupled from the commodity and moved closely with small-cap equities and the liquidity proxy. That pattern is consistent with broad risk reduction rather than a reassessment of the physical uranium balance.
This matters because sector composition can amplify the move. Uranium-miner ETFs include developers and smaller producers whose valuations are sensitive to financing conditions, discount rates and investor risk appetite. Even if the expected uranium price is unchanged, tighter liquidity can raise the cost of capital, compress valuation multiples and delay the market’s recognition of future project value. Those effects are real, but they are cyclical and financial. They do not create new uranium supply or eliminate future reactor demand.
Figure 5. Since Late August, URNM Has Traded With Liquidity and Small Caps, Not Spot Uranium
Source: Bloomberg and Sprott analysis. Data as shown in chart.
3. Stressed Flows Are Also Affecting Physical Uranium Vehicles
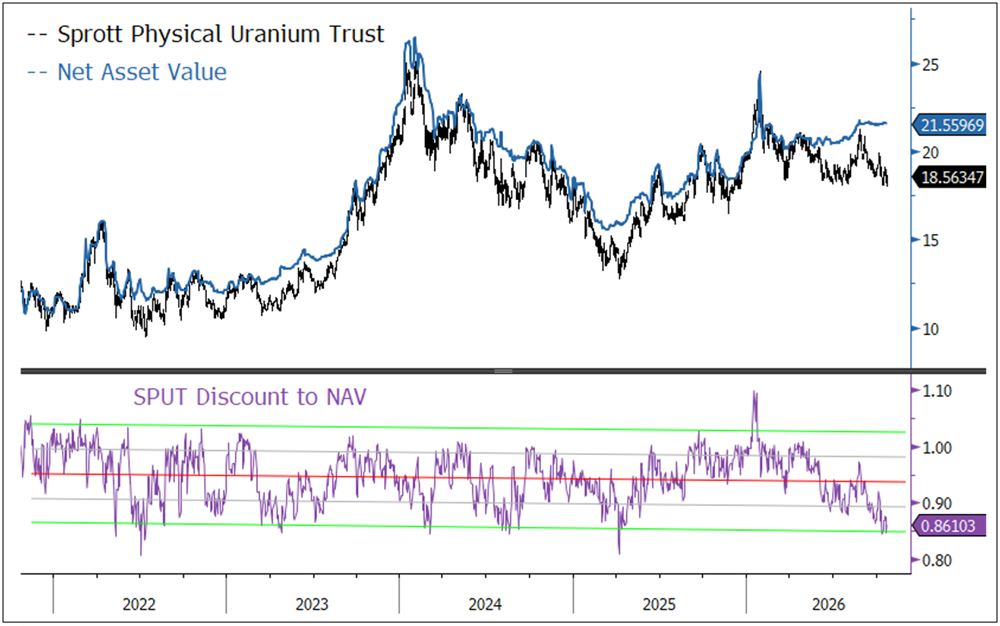
The disconnect is not limited to mining equities. The Sprott Physical Uranium Trust has traded at roughly a 15% discount to net asset value, near the negative two-standard-deviation boundary of its historical premium-and-discount range. When markets are dominated by flows, volatility and constrained risk appetite, a closed-end physical vehicle can deviate materially from its underlying uranium value.
Historically, readings near this extreme have been associated with subsequent rebounds from the lows. That is a probability assessment rather than a forecast or recommendation. More importantly, the discount provides additional evidence that the current weakness is occurring in the financial wrappers around uranium exposure, even while uranium’s long-term contracting price remains firm.
Figure 6. The Sprott Physical Uranium Trust Discount to NAV Nears an Historical Extreme (2022-2026)
Source: Bloomberg. Data as of xx/xx/2026.
Investor Flows Do Not Signal a Broad Sector Exit
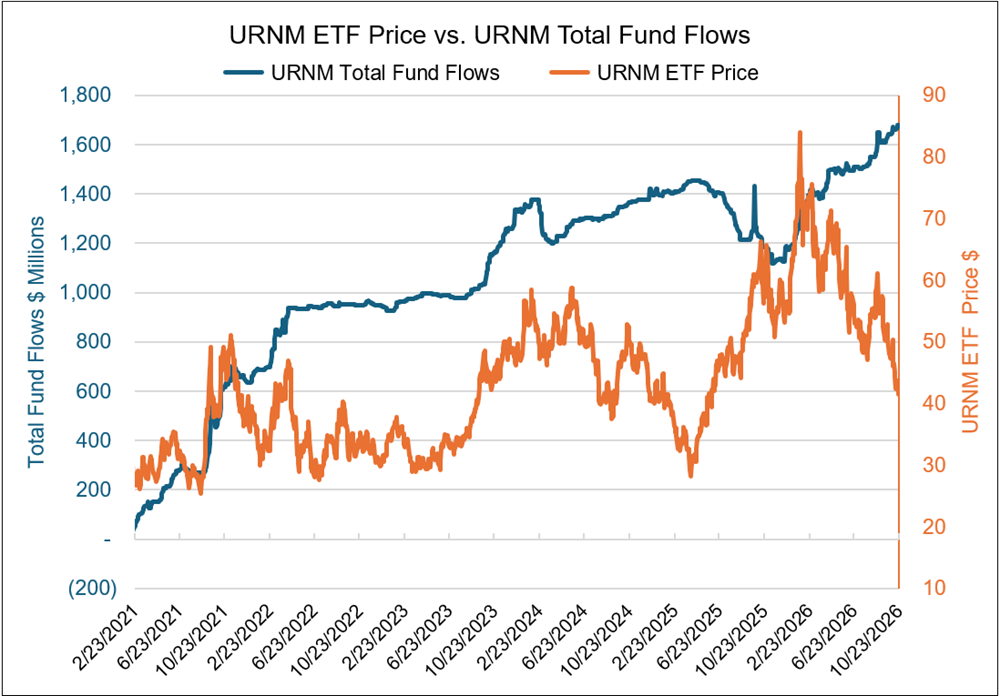
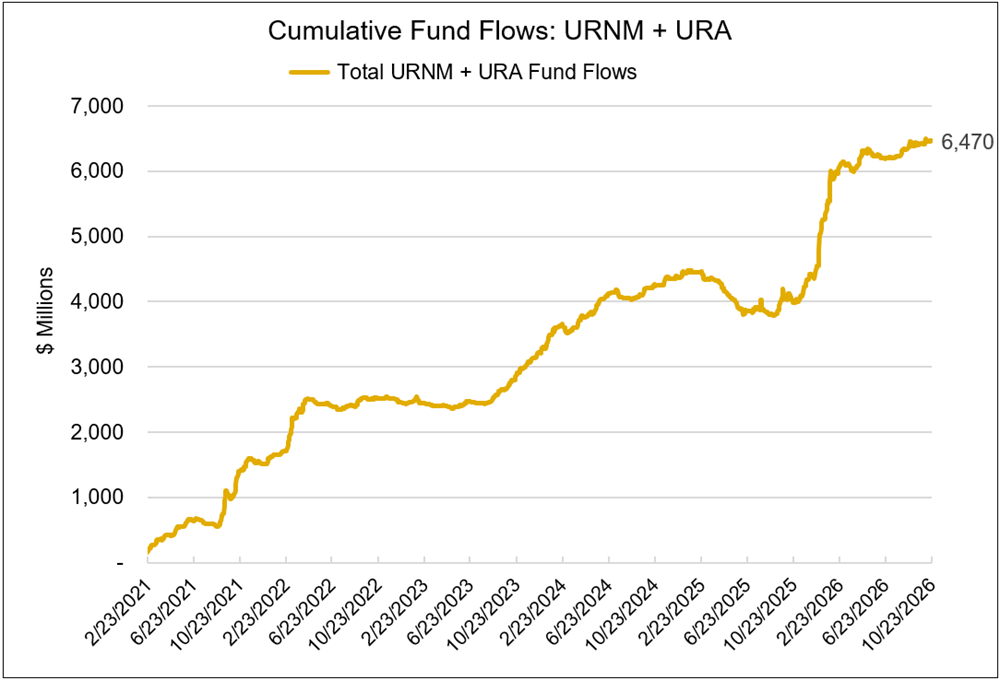
Investor flows provide a useful cross-check. Cumulative dollar inflows into URNM have continued to rise even as its price has declined. Combined inflows into URA and URNM show the same broader pattern. By contrast, iShares Russell 2000 ETF (IWM)8 has experienced cumulative outflows since late 2024. The divergence suggests that the uranium-miner selloff is not simply the result of investors abandoning the long-term uranium thesis.
Flows alone cannot prevent further drawdowns, and ETF creations do not reveal the conviction or time horizon of every buyer. Still, persistent inflows during falling prices indicate that capital is absorbing shares rather than uniformly exiting the theme. This improves the setup for a recovery once forced selling and broad liquidity pressure recede.
Figure 7A. URNM Inflows Have Continued Despite Price Weakness
Source: Bloomberg and Sprott analysis. Data as of 10/23/2026.
Figure 7B. Combined Uranium Miner ETF Inflows Remain Positive (URNM and URA)
Source: Bloomberg and Sprott analysis. Data as 10/23/2026.
Figure 7C. Small-Cap ETF Flows Have Been Net Negative Cumulative (IWM)
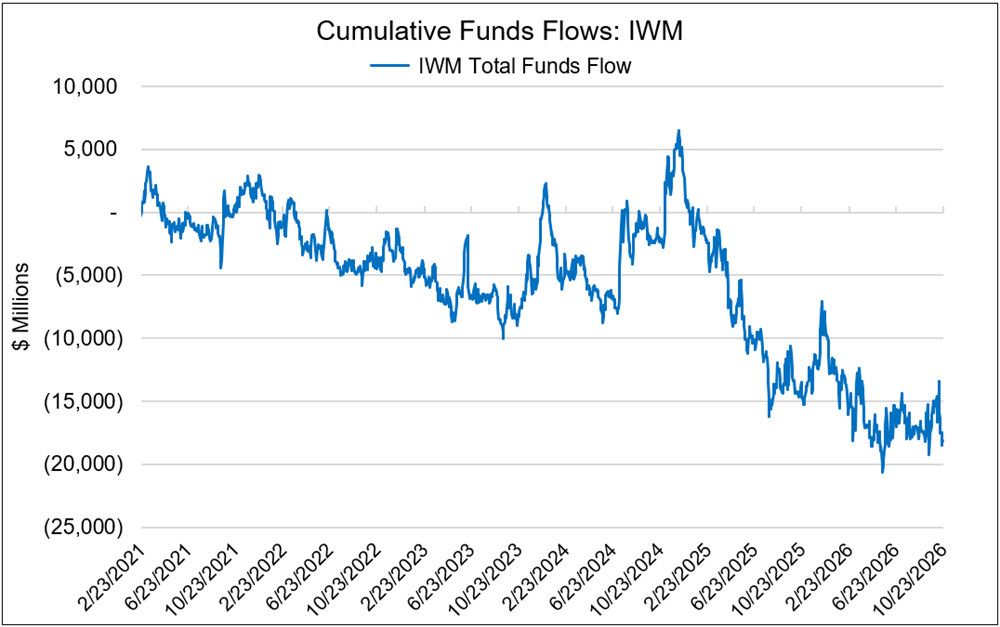
Source: Bloomberg and Sprott analysis. Data as of 10/23/2026.
What Could Reconnect Miners with Uranium?
The current divergence can persist longer than fundamental investors expect. Liquidity regimes turn on the market’s timetable. Nevertheless, the long-term relationship between miners and uranium prices is grounded in cash-flow economics. Sustained uranium spot and term prices eventually affect realized contract prices, margins, reserve values, financing decisions and producers' willingness to sanction new projects.
A durable reconnection is most likely to emerge through a combination of three forces:
- Liquidity stabilization. Lower Treasury and equity volatility would reduce forced position cutting and allow sector-specific signals to matter again.
- Contracting visibility. Additional long-term contracts with higher floors, ceilings and volumes would translate uranium scarcity into clearer producer revenue expectations.
- Operational delivery. Restarts, production guidance, permitting milestones and financing progress would separate companies capable of converting higher uranium prices into cash flow from those that remain dependent on capital markets.
The Long-Term Case for Uranium Miners
The uranium-miner correction appears to be a liquidity-driven dislocation layered over an improving physical uranium market and contracting backdrop. The near-term risk is that deleveraging remains dominant, pushing valuation ratios beyond historical extremes. The longer-term opportunity is that uranium prices have held while miners have repriced sharply lower. If liquidity conditions stabilize, the sector should again trade on the variables that ultimately determine value: contract pricing, production, project economics and the widening need for secure uranium supply.
Footnotes
| 1 | Source: World Nuclear Association, “Declaration to Triple Nuclear Energy,” accessed October 2026. |
| 2 | Sprott Uranium Miners ETF (NYSE Arca: URNM) seeks to invest at least 80% of its total assets in securities of the VettaFi Global Uranium Mining Index (URNMX). The Index is designed to track the performance of companies that devote at least 50% of their assets to the uranium mining industry, which may include mining, exploration, development and production of uranium, or holding physical uranium, owning uranium royalties or engaging in other non-mining activities that support the uranium mining industry. |
| 3 | The Global X Uranium ETF (URA) seeks to provide investment results that correspond generally to the price and yield performance, before fees and expenses, of the Solactive Global Uranium & Nuclear Components Total Return Index. The Index is designed to track the performance of companies involved in uranium mining, exploration, and the production of nuclear components, including those engaged in extraction, refining, and the manufacturing of equipment for the uranium and nuclear industries. |
| 4 | The ICE BofA MOVE Index measures implied volatility in the U.S. Treasury options market and is commonly used as a gauge of expected interest-rate volatility. Higher readings generally signal greater uncertainty in Treasury markets and can coincide with tighter financial conditions and elevated market stress. |
| 5 | The Cboe VVIX Index measures the market’s expected volatility of the Cboe Volatility Index (VIX), using prices of VIX options. Higher readings generally indicate increased demand for protection against volatility and greater uncertainty about future equity-market conditions. |
| 6 | The S&P 500 or Standard & Poor's 500 Index is a market-capitalization-weighted index of the 500 largest U.S. publicly traded companies. |
| 7 | The iShares Russell 2000 ETF (IWM) seeks to track the Russell 2000 Index and provides broad exposure to U.S. small-cap equities. |
| 8 | High beta” refers to securities that tend to move more sharply than the broader equity market during periods of rising or falling risk appetite. In this context, it means URNM’s recent performance has been more influenced by liquidity conditions, market volatility and small-cap equity sentiment than by changes in spot uranium prices; it does not mean that URNM is itself a small-cap fund. |


Investment Risks and Important Disclosure
Relative to other sectors, precious metals and natural resources investments have higher headline risk and are more sensitive to changes in economic data, political or regulatory events, and underlying commodity price fluctuations. Risks related to extraction, storage and liquidity should also be considered.
Gold and precious metals are referred to with terms of art like "store of value," "safe haven" and "safe asset." These terms should not be construed to guarantee any form of investment safety. While “safe” assets like gold, Treasuries, money market funds and cash generally do not carry a high risk of loss relative to other asset classes, any asset may lose value, which may involve the complete loss of invested principal.
Past performance is no guarantee of future results. Investments, commentary and statements are unique and may not be reflective of investments and commentary in other strategies managed by any other Sprott entity or affiliate. Opinions expressed in this presentation are those of the presenters and may vary widely from opinions of other Sprott affiliates. Forward-looking language should not be construed as predictive. While third-party sources are believed to be reliable, Sprott makes no guarantee as to their accuracy or timeliness. This information does not constitute an offer or solicitation, nor an investment advice or recommendation, and may not be relied upon or considered to be the rendering of tax, legal, accounting or professional advice.