


Key Takeaways
-
Positioning, Not Demand, Drove the Selloff: Gold fell 6.80% to a 52-week low, but ETF holdings rose to 100.97 million ounces, signaling a positioning and liquidity reset, not weakening demand.
-
A Near-Complete Set of Headwinds: Surging real yields, a strong U.S. dollar, an energy shock and spreading sovereign-debt stress created an unusually hostile macro backdrop for precious metals.
-
China Bought What the West Sold: A -0.97 correlation between Western positioning and Shanghai premiums highlights Chinese physical buying absorbing Western selling.
-
Cleaner Positioning Raises the Upside: With systematic funds nearing maximum short exposure, gold entered November more lightly positioned and more sensitive to a supportive macro shift.
-
From Reserve Asset Toward Sovereign Collateral: Judy Shelton's gold-redeemable Treasury proposal is not imminent, but it frames gold as potential sovereign collateral, not simply a reserve asset.
-
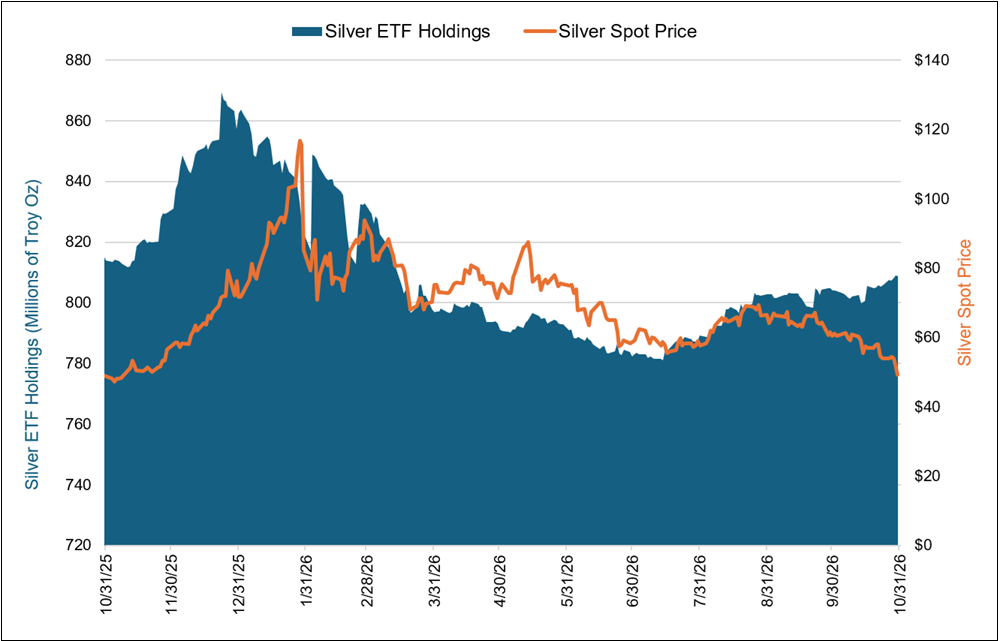
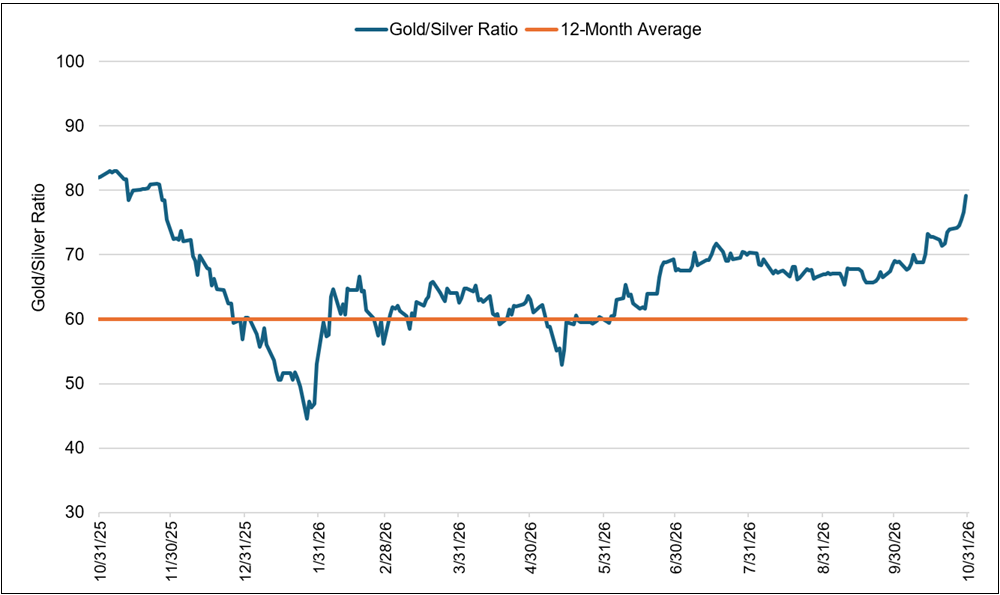
Silver's Relative Value Improved: Silver fell 18.74% while ETF holdings rose 4.9 million ounces. With the gold/silver ratio near 79, silver could be primed for a catch-up move as macro pressures ease.
Performance as of October 31, 2026
| Indicator | 10/31/26 | 9/30/26 | Change | Mo % Chg | YTD % Chg | Analysis |
| Gold Bullion1 | $3,874.62 | $4,157.41 | -$282.79 | -6.80% | -10.30% | Closed at 52-week lows. |
| Silver Bullion2 | $49.10 | $60.43 | -$11.32 | -18.74% | -31.49% | Closed below $50 level. |
| NYSE Arca Gold Miners (GDM)3 | 2,222.47 | 2,522.67 | (300.20) | -11.90% | -9.02% | Holding above summer lows. |
| Bloomberg Comdty (BCOM Index)4 | 141.21 | 141.78 | (0.58) | -0.41% | 28.73% | Holding near highs, led by energy. |
| DXY U.S. Dollar Index5 | 101.88 | 101.45 | 0.43 | 0.42% | 3.62% | Holding near 52-week highs. |
| S&P 500 Index6 | 7,580.07 | 7,651.54 | (71.47) | -0.93% | 10.73% | Semis & AI sell off in rotational market. |
| U.S. Treasury 10-YR Yield* | 4.93 | 5.28 | (0.36) | -- BPS | -- BPS | Yields decline on safety and squeeze. |
| Silver ETFs** (Total Known Holdings ETSITOTL Index Bloomberg) | 808.80 | 803.95 | 4.85 | 0.60% | -6.21% | Climbing since July lows. |
| Gold ETFs** (Total Known Holdings ETFGTOTL Index Bloomberg) | 100.97 | 100.93 | 0.04 | 0.04% | 2.06% | Surpassed Feb 2026 highs. |
Source: Bloomberg and Sprott Asset Management LP. Data as of October 31, 2026.
* BPS stands for basis points. **Bloomberg Indices measure ETF holdings; the ETFGTOTL is the Bloomberg Total Known ETF Holdings of Gold Index; the ETSITOTL is the Bloomberg Total Known ETF Holdings of Silver Index.
Gold’s October Decline Was a Positioning Reset
Gold came under significant pressure in October, falling 6.80% to $3,874.62 per ounce and closing the month at 52-week lows. The weakness occurred despite a 35-basis-point decline in the U.S. 10-year Treasury yield to 4.93%, even as the U.S. dollar strengthened modestly and remained near its 52-week highs. Precious metals broadly underperformed, with silver declining 18.74% and gold miner stocks falling 11.90% over the month, although miner stocks remained above their summer lows.
Gold's correction was driven more by positioning and liquidity than weakening demand.
Importantly, the correction was not accompanied by a meaningful deterioration in ETF investment demand. Gold ETF holdings edged higher during the month to 100.97 million ounces, surpassing their February 2026 high, while silver ETF holdings also continued to recover from their July lows. The divergence between falling gold prices and stable-to-rising ETF holdings suggests that October's weakness was driven more by price and positioning pressures than a broad withdrawal of investment demand.
Figure 1. Finding Support at a 52-Week Low (2024-2026)
Gold bullion spot price in US$/oz with 14-day relative strength index
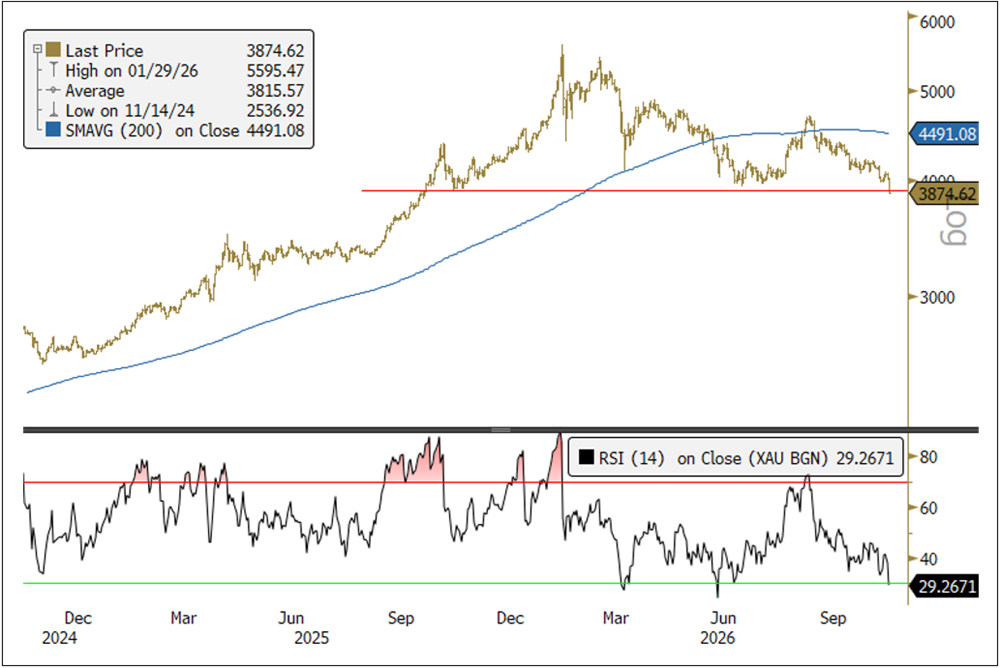
Source: Bloomberg. Data as of 11/2/2026. The 14-day RSI (relative strength index) is a momentum oscillator that measures the speed and change in price movements over 14 days, with values ranging from 0 to 100. Levels above 70 indicate overbought conditions, while levels below 30 indicate oversold conditions. Included for illustrative purposes only. Past performance is no guarantee of future results.
Broader financial markets were volatile in October, as an early-month sovereign bond selloff eventually gave way to a sharp rally in U.S. Treasuries and a rotation within equities. Early in the month, rising real yields and term premiums were the primary source of macro stress, while equities remained relatively resilient despite deteriorating breadth. By the second half of October, the dynamic reversed as growing concerns around AI-related capital spending and credit risk challenged the market's dominant growth narrative.
Treasuries regained their safe-haven role in October, with the 10-year yield ultimately falling below 5%, while equities rotated away from technology and momentum toward more defensive and equal-weight exposures. The bond rally initially reflected a squeeze in crowded short positioning but broadened as AI-related credit stress tightened financial conditions, even as persistent inflation and fiscal pressures remained important longer-term headwinds for fixed income.
Gold Weathers an Unusually Hostile Macro Backdrop
Gold faced nearly every traditional macroeconomic headwind at once in October. Real yields surged, the U.S. dollar reached new 52-week highs, energy prices accelerated, inflation pressures broadened and global financial conditions tightened. Gold weakened through this adjustment, including a sharp late-month decline, but the underlying market structure remained considerably stronger than the price action suggested. Across the month, systematic positioning was progressively reduced, while Chinese physical demand, commercial buying and central bank demand remained resilient.
The most important development was the renewed stress in global sovereign bond markets. Early in October, the U.S. 10-year Treasury yield briefly reached 5.34%, while the 10-year real yield touched 2.96% after rising roughly 50 basis points in a month. The selloff increasingly reflected rising real yields and term premiums rather than inflation breakevens, creating an unusually difficult environment for gold and other long-duration assets. European sovereign stress intensified simultaneously, particularly in France, while long-term yields also came under pressure in the UK and Japan.
France has emerged as an important warning signal for developed sovereign debt markets. Political instability, persistent fiscal deficits and elevated borrowing costs have become mutually reinforcing, pushing French 10-year government bond yields above 5%, bond yield spreads over German Bunds7 to a record +174 basis points and sovereign CDS8 to 103 basis points in late October (see Figure 2). Unlike countries with independent currencies, France cannot depreciate its currency to absorb fiscal stress, leaving fiscal adjustment, higher borrowing costs or broader European policy support as the principal release valves.
Figure 2. Surging Sovereign Yields (2010-2026)
France 10-year government bonds. Top panel: 10-year yield (%). Bottom panel: spread to 10-year Bunds (%, RHS), 5-year CDS (bp, LHS).
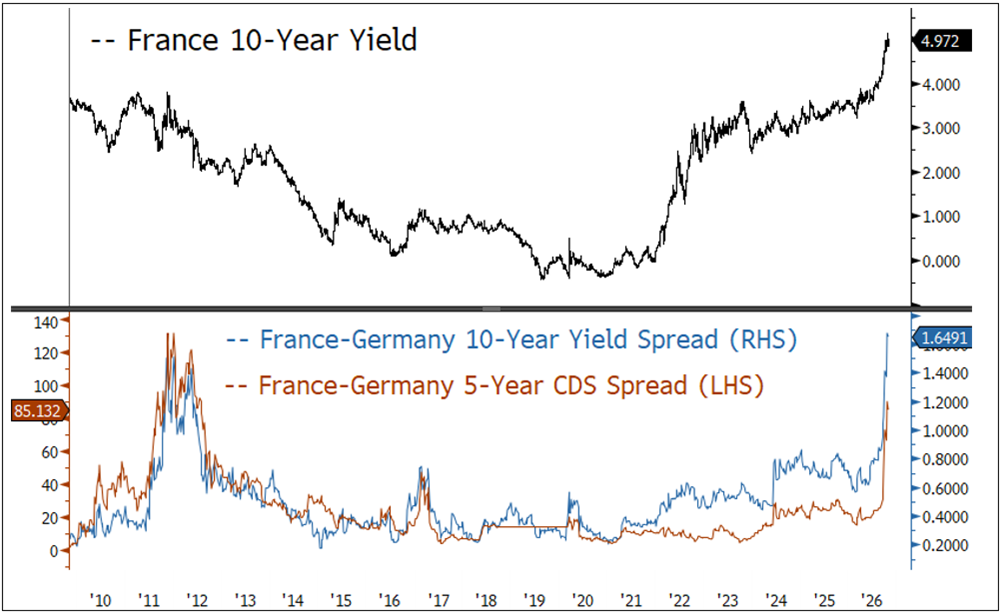
Source: Bloomberg. Data as of 11/3/2026. Included for illustrative purposes only. Past performance is no guarantee of future results.
The larger concern is that France may be a particularly visible example of a problem facing many developed economies: large structural deficits, rising debt-service costs and limited political appetite for fiscal consolidation. Generally, France's combination of high government spending, high borrowing costs and political instability could be applied to varying degrees across much of the G79. If investors begin demanding structurally higher compensation for fiscal and inflation risk, sovereign bonds could become less reliable as both a source of portfolio protection and as the system's traditional risk-free collateral. For gold, this is an important longer-term development: growing questions around sovereign debt sustainability strengthen the case for a reserve asset without corresponding credit or fiscal liabilities.
As October progressed, some of the pressure on sovereign debt began to ease. The 10-year Treasury yield fell quickly by mid-October, led by real yields, as safe haven demand and short covering emerged amid broader financial-market deleveraging. By late October, the 10-year yield had fallen to 4.90%, despite the structural pressures of persistent inflation, fiscal concerns and sovereign credit risk remaining.
Energy and Credit Stress Complicate the Outlook
The U.S.-Iran war intensified the global energy shock in October, with disruptions at the Strait of Hormuz and refining constraints pushing Brent to $116.72 per barrel (bbl) by month-end, while diesel shortages and elevated prices amplified the inflationary impact across the broader economy. Physical costs rose even faster, as tanker rates surged to $20–$35/bbl on some routes and war-risk insurance added another $7-$8/bbl. The result was an increasingly stagflationary shock, lifting inflation while raising the risk of weaker growth.
Energy shocks and market stress may ultimately reinforce gold's role as a safe haven diversifier.
This increasingly fragmented energy market added another layer to the gold outlook. The oil shock was inflationary enough to constrain monetary policy but potentially damaging enough to economic activity and financial stability to increase demand for safe haven assets. In effect, the same forces weighing on gold through higher inflation-adjusted yields were simultaneously strengthening the longer-term case for monetary diversification.
October also saw an important transition in equity and credit markets. Early in the month, major U.S. equity indices remained close to their highs despite sharply deteriorating breadth, heightened volatility in the bond market, and increasingly concentrated market leadership. AI-related equities had come to dominate U.S. equity market capitalization, making the broader market increasingly dependent on continued earnings growth and capital spending by a relatively narrow group of companies.
By mid-month, that leadership had begun to unwind. Semiconductor shares and leveraged AI infrastructure companies came under significant pressure, and financial stress subsequently spread toward credit. By late October, hyperscaler and technology credit spreads were widening, and several leveraged neocloud companies had weakened significantly. The emerging risk was that leveraged AI infrastructure could be the first area in which higher capital costs exposed the fragility of one of the market's most crowded investment themes.
The relationship with gold is important. A broader deleveraging event can initially pressure gold as investors raise liquidity, as seen in 2008 and 2020. However, once the immediate liquidity adjustment subsides, financial stress can reverse the very monetary and real-rate conditions that initially weighed on bullion. October showed early signs of this mechanism, as Treasury and real yields began to fall amid intensifying AI-related financial stress.
The Fed’s Room to Maneuver Narrows
The U.S. Federal Reserve (Fed) faced an increasingly difficult policy trade-off during October. Weak September payroll growth initially reduced expectations for an October rate hike, but inflation subsequently surprised to the upside. Headline consumer price index (CPI) inflation rose 3.7% year-over-year in September, above expectations, though gasoline accounted for more than half of September's monthly CPI increase and core CPI10 held at 2.6%. The clearer signal came from producer prices, where the September producer price index (PPI) rose 1.3% month-over-month and 6.3% year-over-year. Together with core PCE moving higher, the evidence increasingly suggested that energy costs were feeding into broader price pressures rather than remaining confined to the pump.
At the same time, tightening financial conditions began doing some of the Fed's work. Growing stresses in equity and credit markets, particularly around leveraged AI infrastructure, helped shift expectations toward an October pause in rate hikes even as persistent inflation continued to constrain the Fed's ability to ease policy aggressively.
That combination may ultimately matter more for gold than the precise timing of the next policy move. The central bank increasingly faces competing risks from persistent inflation on one side and slowing growth and financial instability on the other. Historically, gold's strongest environments have often emerged when policymakers' ability to maintain real monetary restraint becomes constrained by financial or fiscal realities.
Fed credibility is also becoming part of the equation. Chairman Kevin Warsh has reaffirmed the 2% inflation target but has provided limited guidance on how policy will return inflation to that target, leaving the Fed's credibility increasingly vulnerable as it balances persistent inflation against rising financial and economic stress. PCE inflation11 has now been above the Fed's 2% inflation target for 67 months and is resuming its climb higher (see Figure 3).
Figure 3. Persistent PCE Inflation (2006-2026)
U.S. personal consumption expenditure core price index (%), yoy, seasonally adjusted
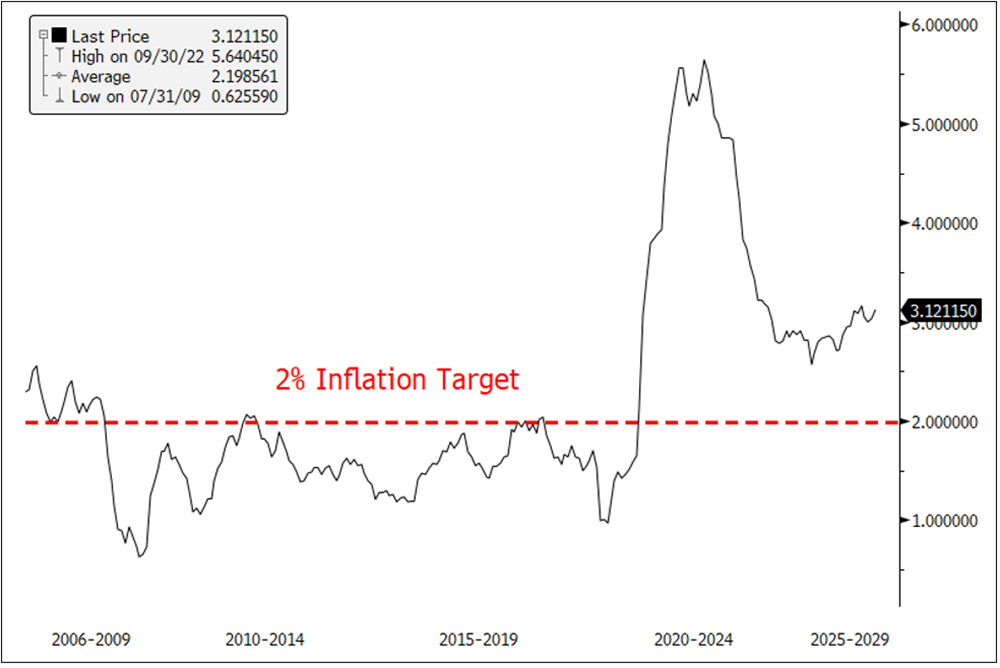
Source: Bloomberg. Data as of 11/3/2026. Included for illustrative purposes only. Past performance is no guarantee of future results.
China Offsets Western Selling
Gold's October correction occurred against a backdrop of rising real yields, dollar strength and increasingly bearish systematic positioning. By mid-month, estimated CTA exposure12 was approaching estimated maximum short allocations. Yet the selloff was not accompanied by the broad deterioration in investment demand normally associated with a more fundamental breakdown. ETF holdings remained relatively firm, spot flows stayed positive, and COMEX open interest13 increased. At the same time, commercial and Asian physical demand strengthened, with an elevated Shanghai gold premium14 indicating that Chinese buyers continued to step in as international gold prices weakened.
Figure 4 highlights this divergence. The black line represents combined ETF and CFTC gold holdings15, a proxy for Western market exposure to gold, while the blue line shows the Shanghai gold premium on an inverted scale. Most strikingly, the rolling 10-week correlation between the two has fallen to approximately -0.97 (lower panel), near the bottom of its historical range. In other words, Western positioning and Chinese physical-market pricing have recently been moving in almost opposite directions. Rather than confirming broad-based liquidation, the October correction appears to have produced a geographic divergence in demand, with weakness in Western financial positioning being increasingly offset by stronger Chinese physical demand.
Figure 4. China Buys When the West Sells
Shanghai gold premium. Top panel: inverted Shanghai gold premium (%, RHS), ETF+CFTC gold holdings (mil oz, LHS). Bottom panel: rolling 10-week correlation between the two.
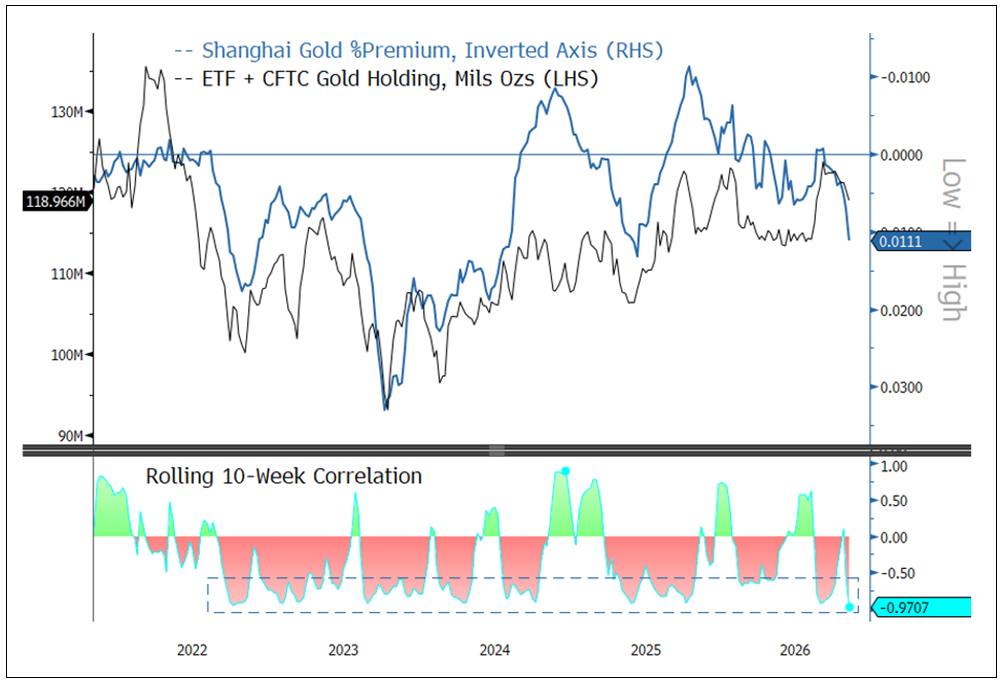
Source: Bloomberg. Data as of 11/3/2026. Included for illustrative purposes only. Past performance is no guarantee of future results.
The significance is that gold's price correction may reflect positioning and liquidity pressures more than a deterioration in the underlying demand structure. With systematic positioning already heavily short while Chinese and other physical demand remained firm, the market entered November with considerably cleaner positioning and greater potential sensitivity to any improvement in the macro backdrop.
Western selling met resilient Chinese demand, leaving gold's underlying demand structure intact.
China remains a potentially important catalyst for gold. Weak domestic demand, subdued credit growth and the prolonged property downturn in China continue to point to a balance sheet recession16. In contrast, Chinese physical gold demand has remained resilient, with elevated Shanghai premiums signaling continued buying amid international price weakness.
The policy challenge is that persistent debt deflation ultimately increases pressure for additional monetary support. Stronger economic stimulus moves from China's government would help stabilize nominal growth and asset prices but could also reinforce demand for scarce real assets as investors seek to protect purchasing power. Gold is particularly well-positioned to benefit from this dynamic given China's large physical gold market, capital controls and growing preference for gold among both private and official-sector buyers.
The comparison with late 2022 is notable. Gold was then confronting aggressive monetary tightening, rising real yields and a strong U.S. dollar, but bottomed near $1,625 as central-bank demand accelerated and Chinese liquidity conditions subsequently improved. The current environment is different, but the combination of cleaner speculative positioning, strong physical and official-sector demand, and the potential for a larger policy response from China could provide an important catalyst for the next leg of the gold cycle.
Gold’s Role as Neutral Reserve Collateral Grows
Gold entered November near 52-week lows and major technical support, with momentum oversold and systematic positioning reduced to minimal levels. Near-term price action may remain volatile, but the correction appears more consistent with a positioning and liquidity reset. Meanwhile, Chinese physical demand, ETF holdings and official sector buying remain resilient. This combination creates scope for a sharp recovery if the underlying macro pressures ease, and especially if market liquidity improves.
Gold's evolving role is not simply de-dollarization, but remonetization as neutral reserve collateral.
The macro backdrop remains unusually two-sided. Persistent inflation, energy-driven price pressures and uncertainty around the Fed's policy path could keep real yields elevated and delay a durable turn in gold. However, these same forces are also tightening financial conditions and increasing stress across sovereign debt and leveraged risk assets. If policymakers are forced to balance inflation control against financial stability and fiscal constraints, maintaining restrictive real rates will become increasingly difficult.
The broader setup therefore remains constructive. Sovereign-credit concerns, the stagflationary energy shock and the possibility of additional Chinese liquidity support continue to strengthen gold's role as a reserve asset without corresponding credit or fiscal liabilities.
Beyond the immediate market cycle, October provided further evidence that the strategic role of gold continues to evolve. The appointment of Judy Shelton as counselor to U.S. Treasury Secretary Scott Bessent drew attention to her previous proposal for Treasury securities that could ultimately be repaid either in U.S. dollars or a specified quantity of gold. There is no indication that such a structure is imminent. Still, the concept is notable because it treats gold not simply as a reserve holding, but potentially as monetary collateral alongside government debt.
This distinction may become increasingly important. The long-term gold story is less about conventional "de-dollarization" than the gradual remonetization of gold as a neutral reserve asset in a more fragmented global financial system. The dollar could remain the world's dominant transactional and funding currency while gold simultaneously acquires greater importance as reserve diversification and sovereign collateral.
Silver Finds Support Despite the Selloff
Spot silver prices fell 18.7% in October, as geopolitical uncertainty, liquidity pressures and broad risk-off sentiment weighed on precious metals. Rising energy prices added to inflation concerns and reinforced expectations of a higher-for-longer interest-rate environment, creating additional headwinds for silver. With interest rates and the U.S. dollar remaining dominant macro drivers, we expect silver to continue to take its directional cues from gold in the near term.
Investor positioning remained notably resilient despite October's selloff. Total known silver ETF holdings increased by roughly 4.9 million ounces during the month, bringing cumulative net additions since the end of July to approximately 19.5 million ounces. The divergence between falling prices and rising ETF holdings suggests that some investors viewed October's weakness as an opportunity to add exposure rather than exit the asset class. The accumulation may reflect continued demand for precious metals exposure amid macroeconomic uncertainty and growing interest from value-oriented investors as silver's relative valuation becomes more compelling.
Figure 5. Known Silver ETF Flows Rose in October Despite Silver’s Ongoing Price Volatility
Source: Bloomberg (10/31/2025-10/31/2026). Silver Spot Price and Total Known ETF Holdings of Silver.
Gold-Silver Ratio Moving Back in Silver’s Favor
October’s price decline also sharpened silver’s relative value proposition, with a widening gold/silver ratio increasingly reflecting a discount for silver. At nearly 79 ounces of silver per ounce of gold, the ratio has risen to its highest level since November 2025 and stands materially above its long-run average of roughly 60:1.17 While the ratio is not a timing indicator, historically elevated readings can signal an increasingly stretched valuation gap between the two metals. As we highlighted in previous reports, extreme moves in the gold/silver ratio can leave silver susceptible to sharp catch-up rallies when precious metals momentum improves.
While gold and silver have historically maintained a strong positive relationship, silver has frequently lagged the initial stages of gold rallies. Gold's deeper liquidity and monetary role allow it to respond more directly to shifts in real rates and safe-haven demand.18 Silver, by contrast, sits between monetary and industrial markets, leaving its price exposed to precious-metals flows and shifts in manufacturing consumption. This hybrid exposure can create periods of pronounced relative underperformance but also leave it prone to more powerful catch-up rallies when both monetary and industrial tailwinds align.19
Figure 6. Gold/Silver Ratio Approaches Levels Last Seen in Late 2025
Source: Bloomberg (10/31/2025-10/31/2026). Gold/Silver Ratio.
Silver Fundamentals Support a Catch-Up Case
The now-concluded U.S. midterm elections may also help ease concerns around further fiscal expansion. A divided federal government could constrain the scope of additional fiscal expansion, potentially reducing upward pressure on rates and the U.S. dollar at the margin. At the same time, a potentially less combative policy backdrop for renewable power could improve sentiment toward two important sources of silver demand: solar photovoltaics and electric vehicles.
With industrial demand firm and relative valuations improved, silver may be positioned to catch up to gold.
Meanwhile, the global industrial outlook remains supportive, with Shanghai silver premiums remaining elevated year-over-year, suggesting that Chinese demand for silver remains firm. Strength in Chinese exports continues to help offset weak domestic consumption, supporting commodity-intensive manufacturing across a range of metals.20 Maintaining growth and providing additional policy support may remain important priorities for the government heading into 2027, particularly given persistent weakness in domestic consumption.
Taken together, silver enters November with improving relative valuation, strong investor positioning and a still-supportive industrial backdrop. Although macro conditions remain a key source of risk, October’s selloff and a widening gold/silver ratio suggest that at least some of these headwinds are reflected in silver’s current price. Should monetary pressures ease while industrial demand remains firm, we believe silver could be positioned for a meaningful catch-up relative to gold.
Footnotes
| 1 | Gold bullion is measured by the Bloomberg GOLDS Comdty Index. |
| 2 | Silver bullion is measured by the Bloomberg Silver (XAG Curncy) U.S. dollar spot rate. |
| 3 | The NYSE Arca Gold Miners Index (GDM) is a rules-based index designed to measure the performance of highly capitalized companies in the gold mining industry. |
| 4 | The Bloomberg Commodity Index (BCOM) is a broadly diversified commodity price index distributed by Bloomberg Indices. |
| 5 | The U.S. Dollar Index (USDX, DXY, DX) is an index (or measure) of the value of the United States dollar relative to a basket of foreign currencies, often referred to as a basket of U.S. trade partners' currencies. |
| 6 | The S&P 500 or Standard & Poor's 500 Index is a market-capitalization-weighted index of the 500 largest U.S. publicly traded companies. |
| 7 | German Bunds are long-term sovereign bonds issued by the Federal Republic of Germany. |
| 8 | Sovereign credit default swaps (CDS) are derivatives that transfer credit risk from a national government to another party. The buyer pays a periodic premium (spread) to the seller in return for protection, essentially compensation from the seller in the event of defined adverse credit events. The 5-year CDS is the most liquid benchmark of this asset class. |
| 9 | The G7 (Group of Seven) is an informal forum of seven major advanced economies: the United States, Japan, Germany, the United Kingdom, France, Italy and Canada. The European Union participates as a "non-enumerated" member, attending meetings but not holding the rotating presidency. |
| 10 | Core CPI is the U.S. consumer price index excluding food and energy, published monthly by the U.S. Bureau of Labor Statistics. It strips out the two most volatile categories from the overall CPI to better reflect underlying, persistent inflation trends. |
| 11 | PCE inflation is measured as part of personal consumption expenditures tracked by the U.S. Bureau of Economic Analysis. The Fed targets PCE inflation (specifically core PCE, which excludes food and energy) as its preferred gauge. The Fed's well-known 2% target is a PCE target, not a CPI target. |
| 12 | CTA exposure in gold refers to the aggregate net long or short position in gold held by commodity trading advisors (CTAs), which are mostly systematic trend-following funds. |
| 13 | COMEX open interest is the total number of futures (or options) contracts outstanding on the COMEX commodity exchange in New York, a division of the CME Group exchange. |
| 14 | The Shanghai gold premium is the difference between the price of gold on the Shanghai Gold Exchange (SGE) and the international benchmark price, usually London spot or the LBMA Gold Price, after converting to the same currency and unit. The gap often persists because arbitrage between the two markets is restricted. |
| 15 | ETF and CFTC gold holdings refer to futures and options positions in gold and ETF gold holdings as reported monthly by the U.S. Commodity Futures Trading Commission (CFTC). These reports provide insight into speculative and institutional demand for gold. |
| 16 | A balance sheet recession is a downturn in which economic actors (households, firms, etc.) shift from maximizing profit to minimizing debt when key asset prices (property, equity, etc.) collapse, leaving the value of their liabilities exceeding the value of their assets. |
| 17 | Source: The Silver Institute (2026, July 21). Gold: Silver Ratio Continues to be Relevant in the Modern Era. |
| 18 | Source: World Gold Council (2026, March 18). Gold the safe haven versus silver the wildcard. |
| 19 | Source: CME Group (2024, June 10). Four Factors Driving Gold Prices Relative to Silver. |
| 20 | Source: Reuters (2026, November 9). China’s export growth expected to have remained strong in October: Reuters poll. |


Investment Risks and Important Disclosure
This article discusses a range of potential economic scenarios that could arise if current geopolitical conditions persist or deteriorate. These scenarios, including those expressed in the present or future tense, are illustrative only and should not be viewed as predictive, promissory or guaranteed.
Relative to other sectors, precious metals and natural resources investments have higher headline risk and are more sensitive to changes in economic data, political or regulatory events, and underlying commodity price fluctuations. Risks related to extraction, storage and liquidity should also be considered.
Gold and precious metals are referred to with terms of art like "store of value," "safe haven" and "safe asset." These terms should not be construed to guarantee any form of investment safety. While “safe” assets like gold, Treasuries, money market funds and cash generally do not carry a high risk of loss relative to other asset classes, any asset may lose value, which may involve the complete loss of invested principal.
Past performance is no guarantee of future results. Investments, commentary and statements are unique and may not be reflective of investments and commentary in other strategies managed by any other Sprott entity or affiliate. Opinions expressed in this presentation are those of the presenters and may vary widely from opinions of other Sprott affiliates. Forward-looking language should not be construed as predictive. While third-party sources are believed to be reliable, Sprott makes no guarantee as to their accuracy or timeliness. This information does not constitute an offer or solicitation and may not be relied upon or considered to be the rendering of tax, legal, accounting or professional advice. It does not constitute a recommendation to purchase, sell or hold gold, silver, mining equities, exchange-traded products or any other investment.