

Key Takeaways
- Gold Reclaims Monetary Leadership: Gold has overtaken U.S. dollar reserves globally, reinforcing its role as the primary neutral reserve asset amid eroding confidence in the dollar system.
- Structural Demand Anchors Gold: Despite limited marginal buying, central banks continue to accumulate gold on dips, stabilizing prices and reinforcing a long-term floor.
- Dollar System Strain Supports Precious Metals: Erosion of petrodollar recycling, rising fiscal dominance, and increased financial intervention are structurally bullish for gold and supportive for silver.
- Silver Demand Shifts to Energy Security: Silver is increasingly driven by solar and energy infrastructure demand, making it less cyclical and more tied to long-term policy priorities.
- Precious Metals as Strategic Assets: Gold is emerging as a barometer of global monetary trust, while silver is becoming a critical input for resilient energy systems, elevating both beyond traditional commodity roles.
Performance as of April 30, 2026
| Indicator | 4/30/26 | 3/31/26 | Change | Mo % Chg | YTD % Chg | Analysis |
| Gold Bullion1 | $4,617.85 | $4,668.06 | -$50.21 | -1.08% | 6.91% | Correction continuing, range narrowing. |
| Silver Bullion2 | $73.75 | $75.17 | -$1.42 | -1.89% | 2.91% | Correction in a flag pattern. |
| NYSE Arca Gold Miners (GDM)3 | 2,533.80 | 2,602.47 | -68.67 | -2.64% | 3.72% | Correction above long-term support. |
| Bloomberg Comdty (BCOM Index)4 | 140.51 | 135.25 | 5.26 | 3.89% | 28.10% | Led by energy and industrial metals. |
| DXY U.S. Dollar Index5 | 98.06 | 99.96 | -1.91 | -1.91% | -0.27% | Trading at the mid-point of the 1-year range. |
| S&P 500 Index6 | 7,209.01 | 6,528.52 | -680.49 | 10.42% | 5.31% | Best monthly return since November 2020. |
| U.S. Treasury 10-YR Yield* | 4.37 | 4.32 | 0.05 | 5 BPS | 20 BPS | 10-year nears the danger zone of 4.50%. |
| Silver ETFs** (Total Known Holdings ETSITOTL Index Bloomberg) | 791.26 | 798.20 | -5.70 | -0.71% | -8.24% | Back to August levels, silver was <$40. |
| Gold ETFs** (Total Known Holdings ETFGTOTL Index Bloomberg) | 98.78 | 97.89 | 0.89 | 0.91% | -0.16% | Gold ETF holdings have been flat since October. |
Source: Bloomberg and Sprott Asset Management LP. Data as of April 30, 2026.
* BPS stands for basis points. **Bloomberg Indices measure ETF holdings; the ETFGTOTL is the Bloomberg Total Known ETF Holdings of Gold Index; the ETSITOTL is the Bloomberg Total Known ETF Holdings of Silver Index.
Gold Market: Buying the Dip
During April, spot gold fell $50.21 per ounce (or -1.08%) to close the month at $4,617.85. After a volatile first quarter dominated by the outbreak of the U.S.–Iran war and the closure of the Strait of Hormuz, gold traded within a comparatively narrow range of roughly $4,500–$4,800, as shown in Figure 1.
Figure 1. Gold Holds the Line (2024-2026)
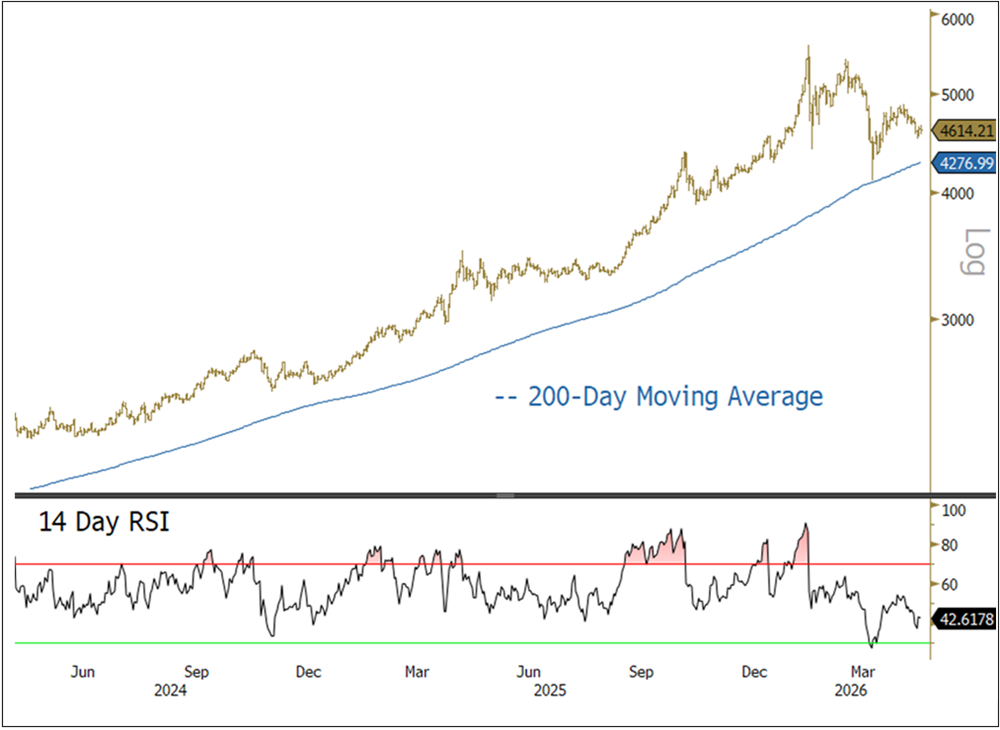
Source: Bloomberg. Gold spot price, $/oz. Data as of 5/3/2026. The 14-day RSI (relative strength index) is a momentum oscillator that measures the speed and change of price movements over a 14-day period, ranging from 0 to 100. Levels above 70 indicate overbought conditions, while levels below 30 indicate oversold conditions. Included for illustrative purposes only. Past performance is no guarantee of future results.
Oil prices were volatile in April amid the Strait of Hormuz being effectively closed. Brent crude surged above $115 per barrel (bbl) at times, and is up over 57% year-to-date (as of 4/30/2026). The oil shock reasserted the need for U.S. dollars during global liquidity drains. A stronger dollar early in the month tightened global financial conditions, pressured emerging markets, increased funding stress and forced deleveraging across risk assets.
At the same time, the gold market lacked persistent marginal buyers. Gulf oil producers, deprived of revenue by the collapse in export volumes, could not recycle surpluses into gold. Emerging-market central banks and related entities facing sharply higher oil import bills are likely to have slowed or paused discretionary gold buying. Investment fund positioning, as seen in Commodity Futures Trading Commission (CFTC) data and ETF holdings,7 was flat. Yet gold stabilized around the $4,500 to $4,800 range. While there was no material new buying, there were no sellers either. A brief dip below $4,500 was quickly absorbed by central bank buyers and Chinese traders, evidenced by a surge in the Shanghai gold premium.
Gold price weakness has been met with sovereign accumulation, not capitulation.
World Gold Council (WGC) data indicates that central bank demand remained a structural pillar for gold during the first quarter. Net official-sector purchases totaled 244 tonnes. This was the fastest buying pace in over a year and above the five-year average (see Figure 2). Poland, Uzbekistan and China led the buying, using the March price correction as an entry point. Sellers, including Turkey, Russia and Azerbaijan, shed an estimated 115 tonnes for idiosyncratic reasons (e.g., currency defense, budget financing and rebalancing), but buyers overwhelmingly offset this. The buying pattern remains familiar: price weakness is met with sovereign accumulation, not capitulation. Much of the buying is undisclosed and absent from IMF data, so the WGC’s 244-tonne figure is likely to underestimate the official sector's true appetite.
Figure 2. Central Banks’ Net Gold Buying (2016-2026)
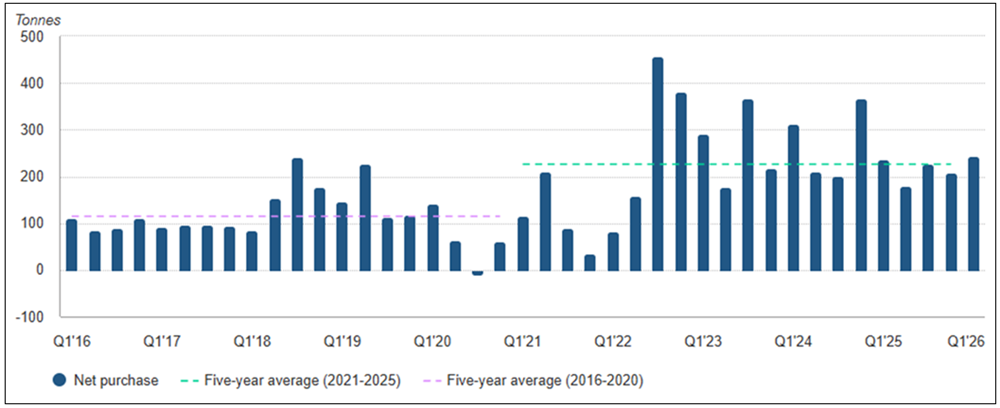
Sources: Metals Focus, World Gold Council. Central bank gold purchase in tonnes per quarter. Data through 1Q 2026. Included for illustrative purposes only. Past performance is no guarantee of future results.
The broad equity market, as measured by the S&P 500 Index, had one of its strongest monthly returns on record in April. In a very unusual price action, the sharp rebound in equities was amplified by mechanical flows. Ceasefire headlines dampened volatility, triggering Commodity Trading Advisor (CTA) re-risking and volatility target re-leveraging,8 even as left-tail risk9 from the Strait of Hormuz closure continues to build. One explanation is that the market has become desensitized to geopolitical stress. Another is that the powerful AI-focused earnings momentum in 1Q26 outweighed the looming worst-case oil supply fear scenario.
Either way, markets soared to new all-time highs. The speed and magnitude of the rally were driven primarily by over-hedged positions and by flow mechanics, as implied volatility went from steep backwardation to a normal curve,10 forcing rapid re-risking. The bullish11 surge in equities stood out amid yields testing their highs, oil prices rising well above $100, and the Strait of Hormuz still closed with no visible end in sight.
Testing the Limits of a Debt-Dependent System
Several forces are converging to weaken the structural foundations of dollar‑based reserve management. They include the erosion of petrodollar recycling, the entrenchment of fiscal dominance11 and the repurposing of USD swap lines as asset‑price stabilizers.12 As a result, gold's role is being reinforced as the only major reserve asset that sits outside the system.
Petrodollar Under Siege
In the short term, the U.S.-Iran war is a regional conflict. In the long term, it is a confrontation over the foundations of the global monetary order. At its heart are U.S. efforts to preserve the petrodollar system. It is this system that underwrites U.S. financial dominance and enables it to sustain unprecedented levels of sovereign debt.
Over the past decade, confidence in the U.S.-centric financial system has steadily eroded. This is largely a reaction to the way the U.S. has weaponized the dollar by imposing sanctions, freezing foreign reserves and politicizing dollar settlement. It has forced many countries to reassess their exposure to U.S. assets. The Iran conflict represents an escalation of this trend, from financial pressure to the physical control of energy flows and maritime chokepoints, and has significant implications for gold.
Gold stands apart. It does not depend on shipping lanes or require permission to settle, and it cannot be frozen or boarded.
The petrodollar is more than a currency convention; it is a geopolitical enforcement mechanism. By compelling global energy trade to settle in U.S. dollars, the U.S. ensures persistent external demand for its currency and, critically, its sovereign debt. As long as major energy importers were forced to pay for imports in U.S. dollars, the U.S. could finance its deficits. This system is now under strain. China, Russia and other non-aligned states have accelerated efforts to bypass dollar settlement, increase bilateral trade and rebuild reserves outside the U.S. Treasury market. Gold has reemerged as the preferred neutral reserve asset since it is immune to sanctions, counterparty risk, and political conditionality.
Financial tools alone are no longer sufficient. The freezing of Russian reserves after the Ukraine conflict marked a structural break in the post–Cold War order. For many central bank reserve managers, U.S. dollar assets are not neutral financial instruments but contingent on political claims. Rather than relying solely on sanctions, the U.S. is increasingly trying to enforce compliance by controlling physical infrastructure such as ports, pipelines and maritime chokepoints.
The Strait of Hormuz, the Red Sea and the Strait of Malacca are chokepoints through which the monetary order is transmitted. Control over these routes determines which economies function smoothly and which face acute resource stress. By shaping access to these arteries, the U.S. can indirectly control balance-of-payments dynamics across Europe and Asia. Energy importers confronted with constrained supply must accept higher prices, liquidate reserves, or increase borrowing, often in U.S. dollars. Gold stands apart. It does not depend on shipping lanes or require permission to settle, and it cannot be frozen or boarded.
From Reserve Assets to Risk Assets
Periods of geopolitical stress in the Middle East inevitably revive comparisons to the 1970s oil shocks and the birth of the petrodollar system. It is tempting to assume that higher oil prices will again translate into large, recycled petrodollar surpluses being used to underpin U.S. assets. But this historical pattern may be eroding.
Petrodollars once anchored U.S. markets. Now that link is breaking, boosting volatility and strengthening gold.
Unlike the 1970s or even the 2002-2013 commodity boom, most Gulf exporters are not capturing large windfall surpluses from higher oil prices. For one thing, the Hormuz closure constrains export volumes. For another, fiscal and balance-of-payments breakevens are higher, and domestic spending commitments are far larger. Saudi Arabia now requires oil prices near the high $90s to avoid a current account deficit. At reduced export volumes, it becomes a net borrower rather than a surplus recycler of capital.
Instead, the biggest winners from higher oil prices are a diffuse group of non-Gulf exporters: Russia, Kazakhstan, Nigeria and North America. Their flows are fragmented, politically constrained and far less likely to be recycled into U.S. financial assets in a coordinated way. The classic mechanism that once anchored demand for Treasuries—surplus Gulf capital seeking a home—no longer operates at scale. The result is a world in which oil prices can rise without triggering a corresponding increase in structural U.S. dollar demand.
In the early petrodollar era, reserve accumulation played an outsized role in global capital flows. Today, dollar demand has migrated from the reserve channel to the risk-asset channel. It is now U.S. equities that dominate global market capitalization, not petrodollar recycling. This makes U.S. dollar dominance more financially driven and more cyclical, rather than mechanically reinforced through commodity pricing. Crucially, it also means U.S. dollar strength is no longer guaranteed during periods of geopolitical stress if those shocks undermine confidence in U.S. policy, asset valuations or global stability.
The erosion of petrodollar recycling is constructive for gold because it removes or constrains a key mechanism for channeling global surplus savings into U.S. dollar assets. When energy shocks no longer generate predictable flows into Treasuries, the burden of adjustment shifts elsewhere—to higher real volatility, greater use of balance sheets and wider risk premia. This regime is structurally supportive of gold. Gold sits outside the system of chokepoints and financial coercion and performs well when confidence in monetary recycling mechanisms weakens.
Raising the Stakes for Fiscal Dominance
The U.S. is firmly in a regime of fiscal dominance. Persistent multi-trillion-dollar deficits require continual Treasury issuance. Maintaining liquidity in the Treasury market increasingly depends on central bank accommodation. Even without a crisis, this implies continuous, gradual monetary debasement as the U.S. Federal Reserve's balance sheet expands alongside nominal gross domestic product (GDP) and the banking system's needs.
Gold has now overtaken Treasuries as the largest component of global reserves for the first time in decades.
Geopolitical shocks raise the stakes. Energy-importing creditor nations may be forced to sell U.S. Treasuries to fund energy and food imports if prices remain elevated. That selling pressure does not need to be catastrophic to matter; it simply increases the likelihood that the Fed will serve as the buyer of last resort more frequently. The base case remains a gradual printing regime (quantitative easing, QE, lite or reserve management purchases).13 However, the right-tail risk of larger interventions has increased and will further rise if the Strait of Hormuz remains closed.
Bloomberg reports that U.S. dollar-denominated reserves, adjusted for valuation effects, are now lower than gold reserves in the global central banking system for the first time since the IMF started publishing this data in the late 1990s (see Figure 3). Global central banks, in aggregate, stopped accumulating U.S. Treasuries roughly 12 years ago and have steadily increased their gold reserves instead. Gold has now overtaken Treasuries as the largest component of global reserves for the first time in decades. This milestone reflects risk management in a world where the fiscal trajectory of the issuer of the world's reserve currency has itself become a source of concern.
Figure 3. Gold Tops Global Reserves (2000-2025)
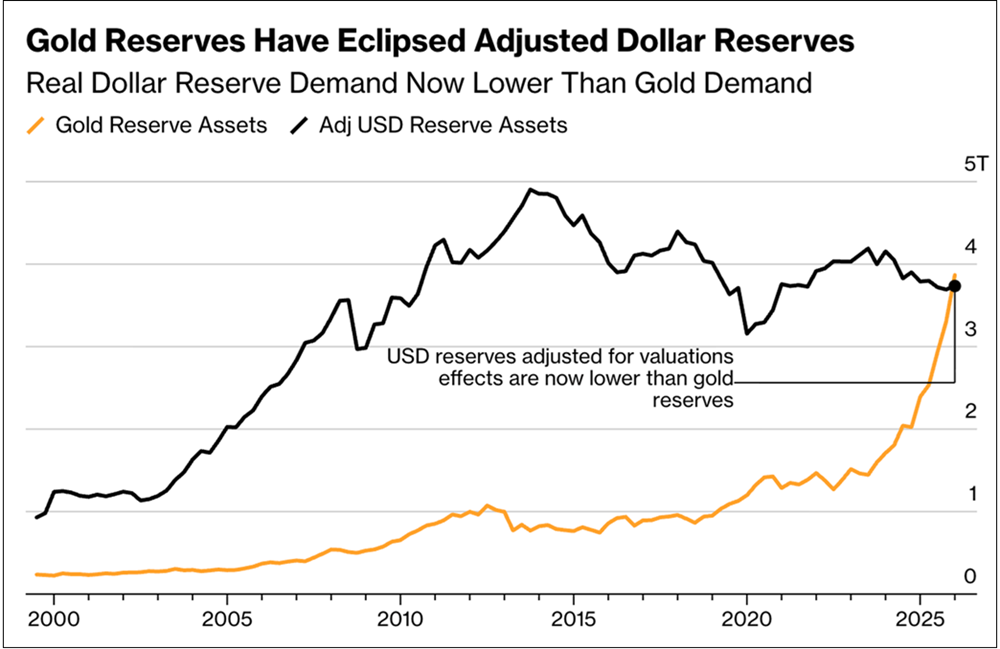
Source: Bloomberg. Global USD-denominated reserve assets in tonnes, on a quarterly basis, adjusted for valuation effects. Data through end-March 2025. Included for illustrative purposes only. Past performance is no guarantee of future results.
To be clear, the U.S. dollar system is not collapsing overnight. It is eroding under the weight of debt, deficits and global fragmentation as each crisis chips away at confidence. The dollar remains central, but its share of global trust is slowly declining. Gold sits at the intersection of that transition—under no government's control, immune to sanctions and increasingly relevant as a reserve asset in a fragmented world.
Defending Assets, not Liquidity
One of April's most revealing developments was the United Arab Emirates' (UAE) informal request for a USD swap line. It made the request not because it was running out of dollars, but because the war had exposed the fragility of U.S.-dollar-dependent economies, even with strong balance sheets. U.S. Treasury Secretary Scott Bessent confirmed that numerous Gulf and Asian allies have made similar requests. He publicly stated that extending permanent swap lines could be "a major first step in creating new U.S. dollar funding centers in the Gulf and Asia."
This development marks an important shift in the function of USD swap lines. These were traditionally deployed during crisis events as liquidity backstops to prevent panic selling and keep global funding markets functioning, like during the 2008-2009 global financial crisis and the 2020 COVID pandemic. Now, the swap lines are increasingly being used as asset-price stabilizers. The UAE's request is framed to help it meet dollar funding needs without liquidating U.S. equities or Treasuries. It signals financial-asset demand rather than underlying currency confidence.
Japan is the clearest precedent. The Bank of Japan has repeatedly tapped U.S. dollar liquidity to defend the yen's value from exceeding 160 yen per U.S. dollar, despite domestic inflation running well above its policy rate. In short, currency stability is effectively subordinated to financial market stability. The same logic is expected to extend to other USD-dependent markets. USD swap lines are being used to prevent forced selling of U.S. assets, keeping global portfolios long U.S. dollar assets.
On the U.S. side, the U.S. Treasury is buying back long-dated debt while simultaneously issuing more Treasury bills. At the same time, the Fed is absorbing T-bills through QE-lite or reserve management purchase (RMP) programs. Together, these function as an internal recycling mechanism designed to cap duration risk and suppress financial stress. They indicate that fiscal and monetary operations are converging. This framework explicitly ties the stability of the U.S. dollar to that of U.S. stock and bond markets, thereby establishing a financialized currency regime.
As the petrodollar system increasingly relies on physical coercion rather than voluntary participation, its long-term stability weakens, and gold stands to benefit.
The risks are clear. When a currency is anchored to asset prices and leverage, failure can manifest simultaneously in equities, bonds and the currency. If these swap lines were ever politically weaponized, or if the asset prices they are designed to protect correct sharply, the eventual unwind may become systemic rather than localized.
The Iran conflict further underscores a critical shift: Geopolitical risk has moved from the margins to the core of the monetary system. Energy, currency and security have become intertwined. As the petrodollar system increasingly relies on physical coercion rather than voluntary participation, its long-term stability weakens. This is another step in the convergence of structural forces. These include the limits of a debt-dependent system, oil as a stress transmission mechanism, the erosion of sovereign bond safety, the financialization of currency defense and the slow fracture of the petrodollar regime.
These dynamics point to a world in which gold is absorbing the diminishing store-of-value function of sovereign debt. Gold represents the neutral escape valve. It is the clearest expression of distrust in a system in which currencies are used to defend financial markets globally rather than as a store of value. Gold's sustained strength over the past several years reflects a continuing, cumulative reassessment of confidence in the global monetary order. In a system defined by rising sovereign debt, weaponized finance and deteriorating fiscal optionality, gold is increasingly functioning as the market's barometer of systemic trust.
Silver Market: Security Over Cycles
Spot silver fell $1.42 per ounce (or -1.89%) in April to close the month at $73.75. This followed a volatile first quarter, dominated by extreme options-related selling and the outbreak of the U.S.-Iran war. During April, by contrast, silver traded within a comparatively narrow range of roughly $71 to $80, its narrowest for the year, as volatility calmed (see Figure 4).
Figure 5. Silver’s Narrow Range (2024-2026)
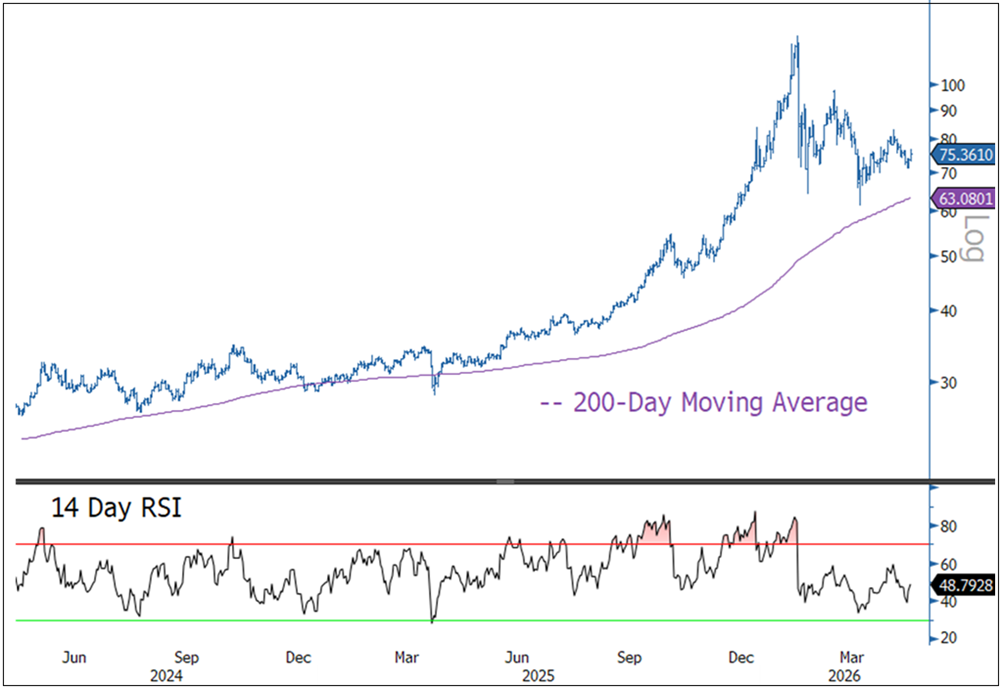
Source: Bloomberg. Silver spot price, $/oz. Data as of 5/3/2026. The 14-day RSI (relative strength index) is a momentum oscillator that measures the speed and change of price movements over a 14-day period, ranging from 0 to 100. Levels above 70 indicate overbought conditions, while levels below 30 indicate oversold conditions. Included for illustrative purposes only. Past performance is no guarantee of future results.
Silver’s long-term outlook is increasingly being shaped by the global reordering of energy security rather than by traditional cyclical industrial demand. Historically, major energy shocks have accelerated investment in renewables. This time, however, the shift is occurring amid geopolitical fragmentation and the breakdown of global supply chains. As a result, solar power is no longer framed primarily as a decarbonization solution, but as a matter of national security and system resilience.
Silver is becoming a more strategic input into resilient energy systems.
Solar remains the fastest-growing renewable technology globally. Distributed generation and storage become strategic assets as governments seek energy systems that are less exposed to fuel imports, maritime chokepoints and geopolitical coercion. Silver’s role in photovoltaic cells embeds it directly into these long-term infrastructure decisions.
These structural forces act to raise silver’s long-term floor price. They embed demand into policy-driven investment cycles that are relatively insensitive to near-term price volatility. Energy security becomes a planning constraint rather than a cost variable, and demand becomes less discretionary. Solar deployment decisions are increasingly made to reduce vulnerability. That distinction matters for silver because it reduces the probability of sustained demand destruction during downturns.
The U.S.-Iran war has raised the specter of prolonged energy price shocks and triggered sharp front-loading of global solar demand. In March, China’s solar panel exports surged to record levels as buyers moved to secure supply ahead of expected disruptions. Rising prices drove up export values even faster, reflecting precautionary behavior rather than optimism, a hallmark of security-driven demand.
China imported a record 836 tonnes of silver in March, well above both recent levels and long-term averages (see Figure 5). Market commentary highlighted strong retail demand and solar-related consumption ahead of policy changes, reinforcing the view that buyers were pulling forward demand.
Figure 5. China Buys More Silver (2009-2026)
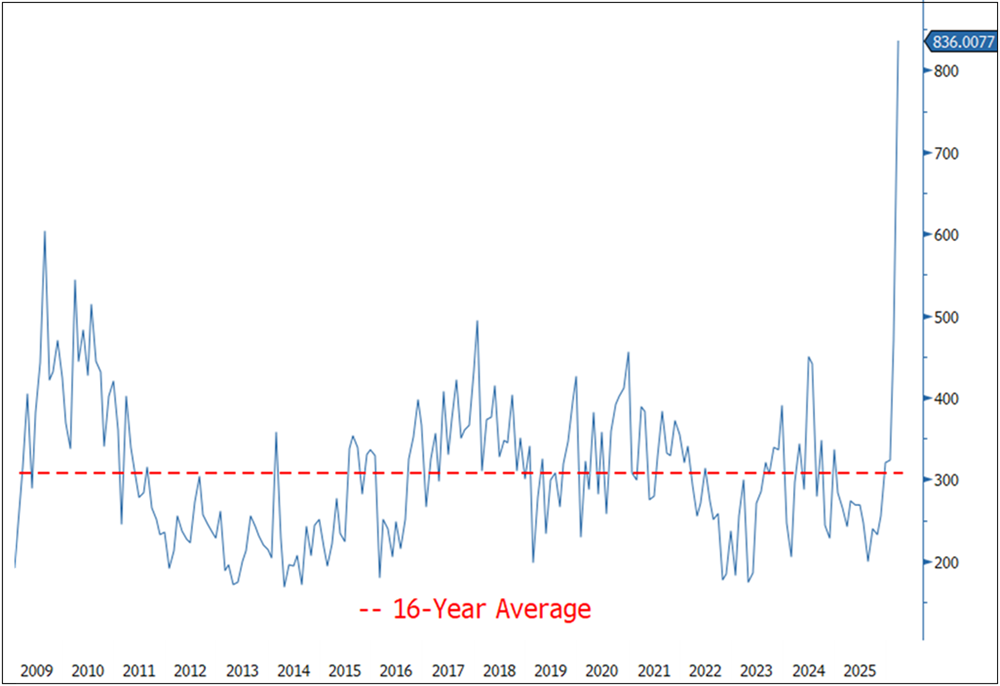
Source: Bloomberg. China silver imports in tonnes. Data through end-March 2026. Included for illustrative purposes only. Past performance is no guarantee of future results.
Southeast Asia and Africa also sharply increased silver imports, reflecting heightened concern around energy access, price volatility and supply reliability. In many of these regions, solar and battery systems are not marginal additions to existing grids, but core components of future energy stability.
The impending removal of China’s export tax rebate14 accelerated shipments and reinforced front-loading behavior. While such bursts of activity can fade, the underlying drivers remain intact. Once inventories are built and systems deployed, silver demand becomes embedded in infrastructure rather than discretionary consumption. Silver is increasingly tied to system resilience rather than cyclical growth, reinforced by physical deployment into infrastructure that is difficult to substitute and politically difficult to reverse.
Silver’s role is evolving; it remains volatile but is becoming less of a high-beta industrial metal. Energy insecurity, geopolitical fragmentation and policy-driven front-loading are quietly resetting the long-term demand profile. In this environment, silver is becoming a more strategic input into resilient energy systems. The near-term path may remain uneven, but the longer-term signal is that silver demand is becoming anchored by security considerations rather than growth cycles, raising the structural demand floor.
Footnotes
| 1 | Gold bullion is measured by the Bloomberg GOLDS Comdty Index. |
| 2 | Silver bullion is measured by the Bloomberg Silver (XAG Curncy) U.S. dollar spot rate. |
| 3 | The NYSE Arca Gold Miners Index (GDM) is a rules-based index designed to measure the performance of highly capitalized companies in the gold mining industry. |
| 4 | The Bloomberg Commodity Index (BCOM) is a broadly diversified commodity price index distributed by Bloomberg Indices. |
| 5 | The U.S. Dollar Index (USDX, DXY, DX) is an index (or measure) of the value of the United States dollar relative to a basket of foreign currencies, often referred to as a basket of U.S. trade partners' currencies. |
| 6 | The S&P 500 or Standard & Poor's 500 Index is a market-capitalization-weighted index of the 500 largest U.S. publicly traded companies. |
| 7 | CFTC data and ETF holdings refer to indicators of investor positioning based on reports from the Commodity Futures Trading Commission showing futures and options positions, and assets held in exchange-traded funds (ETFs). Together they provide insight into speculative and institutional demand for a given asset. |
| 8 | CTA re-risking and volatility target re-leveraging refers to systematic trading flows in which commodity trading advisors (CTAs) rebuild positions after reducing risk, while volatility-targeting strategies increase leverage as market volatility declines, amplifying exposure to underlying assets. |
| 9 | Left tail risk refers to the probability of extreme, negative investment returns (large losses), while right tail risk represents the chance of extreme, positive returns (unexpected high gains). |
| 10 | Steep backwardation refers to a market condition where futures prices are significantly lower than expected spot prices, resulting in a sharply downward-sloping curve. In contrast, a normal curve, or contango, occurs when futures prices are higher than spot prices, leading to an upward-sloping curve. Steep backwardation indicates immediate demand for a commodity, while a normal curve suggests a premium for future delivery. |
| 11 | Bullish is the sentiment that market prices will rise. |
| 12 | Fiscal dominance is a macroeconomic condition where government fiscal pressures, such as high public debt and deficits, dictate or constrain a country's monetary policy. In this scenario, the central bank may prioritize financing government needs over controlling inflation, often leading to higher inflation rates. |
| 13 | Refers to using central bank dollar liquidity facilities—such as those provided by the Federal Reserve to other central banks—not only to ease funding shortages but also to indirectly support financial markets by reducing forced asset sales and dampening price volatility during periods of stress. |
| 14 | Quantitative easing-lite or reserve management purchases (RMPs) refer to central bank asset purchases—such as those conducted by the Federal Reserve—that expand the balance sheet for technical liquidity or reserve-management purposes rather than for macroeconomic stimulus, as in full-scale quantitative easing. |
| 15 | China's export tax rebate for solar products, specifically photovoltaic products, was eliminated starting April 1, 2026, which means manufacturers can no longer reclaim any portion of the value-added tax (VAT) on these exports. This change is expected to increase export costs and prices for solar products internationally. |


Investment Risks and Important Disclosure
Relative to other sectors, precious metals and natural resources investments have higher headline risk and are more sensitive to changes in economic data, political or regulatory events, and underlying commodity price fluctuations. Risks related to extraction, storage and liquidity should also be considered.
Gold and precious metals are referred to with terms of art like "store of value," "safe haven" and "safe asset." These terms should not be construed to guarantee any form of investment safety. While “safe” assets like gold, Treasuries, money market funds and cash generally do not carry a high risk of loss relative to other asset classes, any asset may lose value, which may involve the complete loss of invested principal.
Past performance is no guarantee of future results. You cannot invest directly in an index. Investments, commentary and opinions are unique and may not be reflective of any other Sprott entity or affiliate. Forward-looking language should not be construed as predictive. While third-party sources are believed to be reliable, Sprott makes no guarantee as to their accuracy or timeliness. This information does not constitute an offer or solicitation and may not be relied upon or considered to be the rendering of tax, legal, accounting or professional advice.