

Key Takeaways
- Geopolitical Volatility, Fundamental Resilience: Copper’s March drawdown reflected macro stress, but the subsequent recovery underscores the durability of underlying fundamentals.
- Structural Demand Is Replacing Cyclicality: Copper demand is increasingly anchored in electrification, energy security and strategic infrastructure, reducing reliance on traditional economic cycles.
- Industry Profitability Remains Elevated: For copper miners, strong margins and balance sheets provide a meaningful buffer against rising input costs, supporting continued production.
- Supply-Side Risks Are Intensifying: Disruptions to sulfuric acid markets and trade flows—exacerbated by geopolitical conflict and China’s policy actions—are emerging as constraints on supply.
- Risk-Reward Is Skewing Favorably: Tightening supply conditions alongside durable, policy-supported demand reinforce a constructive outlook for copper and copper mining equities.
Performance as of April 30, 2026
| Metric | 1 MO* | 3 MO* | YTD* | 1 YR | 3 YR | 5 YR |
| Copper Spot Price1 | 5.34% | -1.20% | 3.67% | 41.59% | 14.61% | 5.61% |
| Copper Mining Equities (Nasdaq Sprott Copper Miners Index TR)2 | 5.76% | -7.83% | 7.56% | 98.75% | 27.46% | 13.80% |
| Copper Junior Mining Equities (Nasdaq Sprott Junior Copper Miners Index TR)3 | 7.98% | -12.54% | 5.11% | 115.75% | 38.82% | 19.05% |
| Broad Commodities (BCOM Index)4 | 3.89% | 16.41% | 28.10% | 39.22% | 10.43% | 9.23% |
| U.S. Equities (S&P 500 TR Index)5 | 10.49% | 4.19% | 5.70% | 31.05% | 21.67% | 13.13% |
Performance for periods of less than one year is not annualized.
Source: Bloomberg as of 04/30/2026. You cannot invest directly in an index. Past performance is no guarantee of future results.
Copper Shakes Off the Shock
April marked a strong recovery for copper. The copper price ended the month at $12,911 per metric ton, up 5.34%, and back within striking distance of record highs, recovering from the sharp March sell-off triggered by the escalation of the U.S.-Iran war and the resulting closure of the Strait of Hormuz.
Copper rebounded on resilient demand, tightening supply and its critical role in electrification.
April's price action reflected a market caught between two forces. Copper and copper equities traded on the geopolitical panic-and-relief cycle that has impacted the market since the Iran conflict escalated. Each new headline on Hormuz shipping, energy costs or diplomatic posturing, triggers moves in both directions. The month opened with copper prices still digesting March's sell-off, dipping on fears of energy inflation and supply chain disruption, but then rallying in April as the market began to differentiate between the war's actual impact on copper fundamentals. April’s recovery was supported by growing recognition that diesel and sulfuric acid shortages could constrain supply, which may help support copper prices.
Beyond near-term uncertainty, long-term investor sentiment toward copper is strengthening. The outlook is increasingly defined by the convergence of tangible physical demand, a renewed emphasis on energy security and copper’s indispensable role in electrification—all against a backdrop of persistent supply constraints. While the timing of the resolution of the Iran conflict remains uncertain, its effects are likely to endure, prompting countries to reassess energy security priorities and their exposure to global supply chains. In the past, energy shocks caused by armed conflicts served as powerful catalysts for reshaping energy and industrial policies. Higher prices for oil, natural gas, liquified natural gas (LNG) and other supply inputs, such as sulfuric acid, will shift the cost curve upward for other commodities and end products. One key strategy to mitigate oil and gas disruptions is to push more toward electrification and alternative energy sources. Copper, given its key role in energy generation, transmission and storage, is likely well positioned to benefit. We also expect nuclear energy and uranium, as well as renewables, to be beneficiaries.
Copper miners advanced 5.76% in April, while junior copper miners outpaced with a 7.98% gain, broadly tracking the recovery in the spot price and continuing to offer leveraged upside to the copper investment thesis. Looking at longer-term performance, copper miners have outpaced broader equities over the past five years (Figure 1).
Figure 1. Copper Stocks Have Outperformed Other Asset Classes Over the Past Five Years (04/30/2021-04/30/2026)
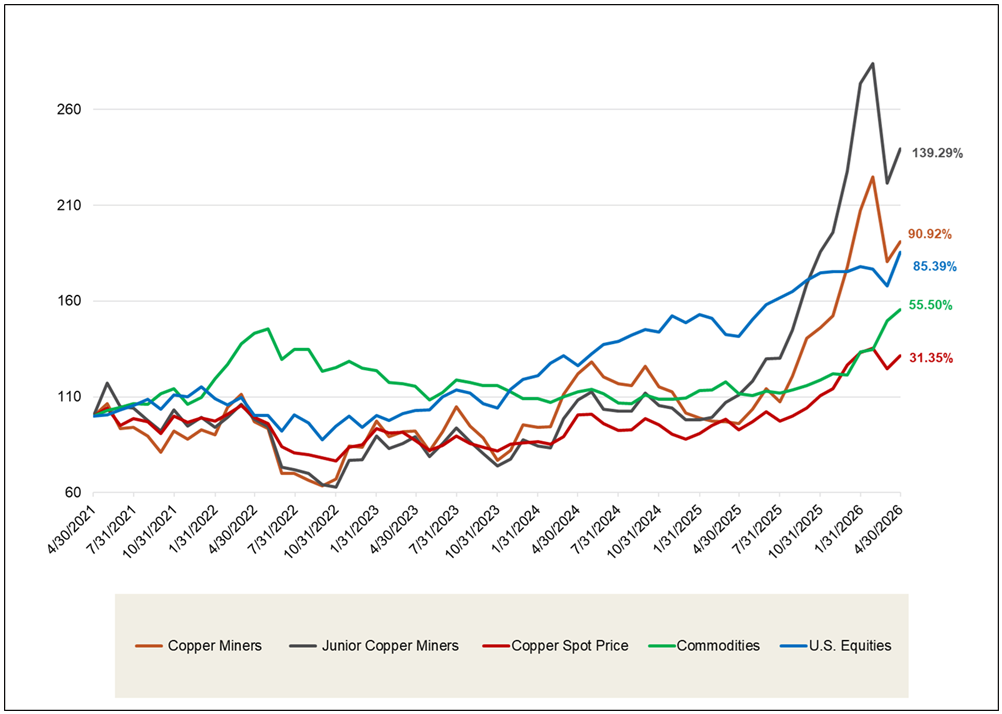
Source: Bloomberg and Sprott Asset Management. Data as of 04/30/2026. Copper Miners are measured by the Nasdaq Sprott Copper Miners™ Index (NSCOPPT index); Junior Copper Miners are measured by the Nasdaq Sprott Junior Copper Miners™ Index (NSCOPJT index); U.S. Equities are measured by the S&P 500 TR Index; the Copper Spot Price is measured by LMCADY Comdty; and Commodities are measured by the Bloomberg Commodity Index (BCOM). Definitions of the indices are provided in the footnotes. You cannot invest directly in an index. Past performance is no guarantee of future results.
Sprottlight: Hormuz, Sulfuric Acid and the Upstream Choke Point
U.S.-Iran War Impact on Copper
When the U.S.-Iran war intensified in March and shipping through the Strait of Hormuz ground to a halt, copper sold off alongside global equities. Conflict drives up energy costs, energy inflation weighs on economic activity and weaker growth undermines demand for industrial metals. For a metal long nicknamed "Dr. Copper" due to its perceived sensitivity to the global economic cycle, the initial reaction seemed sensible.
The old copper story was cyclical; the new one is critical.
Lately, though, the traditional “Dr. Copper” moniker has failed to account for the evolving drivers of copper demand. Demand is increasingly dominated by electrical infrastructure, which is now the leading and fastest-growing end use, shifting the market from cyclical construction dependence toward more stable, strategic, long-term investment in electrification. Copper is essential for strategic, priority-driven use cases such as defense spending, AI and data center infrastructure and the energy transition, all of which significantly outpace the growth projected for core economic uses (Figure 2). By 2040, these strategic segments could account for 45% of total copper demand, up from 32% in 2024.
Importantly, this demand is significantly less price-sensitive than traditional cyclical consumption. Grid modernization is not likely to be postponed because commodity prices are elevated. AI data center buildouts are not driven by copper pricing. Defense procurement does not get deferred because copper input costs rise. At the margins, extended military operations also accelerate the drawdown of copper-intensive defense stockpiles, from munitions and communications systems to ground vehicles and naval platforms, creating replenishment demand layered on top of structural trends.
That is not to say the current Iran conflict is without consequence for copper miners. While it does not directly threaten mine output, it is creating meaningful second-order effects, like elevating diesel costs, tightening sulfuric acid supply and shifting demand dynamics toward energy and national security priorities.
The most immediate cost pressure for copper miners is diesel, which generally represents 15% to 25% of average All-In Sustaining Costs (AISC) across open-pit copper mines, which account for the majority of global production.6 Underground copper miners face lower diesel exposure. Rising fuel prices do impact operating margins, and in regions like Zambia, pre-existing diesel shortages are already limiting copper supply.
Figure 2. Copper Demand Is Shifting Toward Strategic, Less Price-Sensitive End Uses
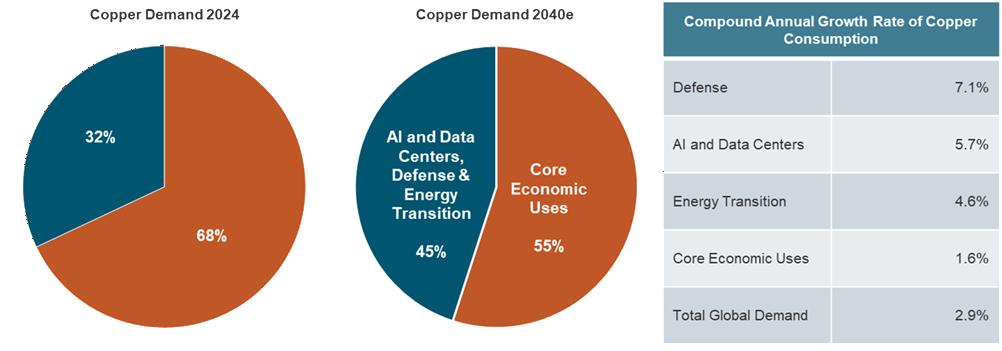
Source: S&P Global, January 2026.
Copper Miners: Strong Margins are Buffering Cost Pressures
The diesel narrative, however, tells only part of the story. The global copper mining industry entered this conflict with the strongest financial position in recent history, and this cushion is sufficient to absorb a prolonged period of elevated energy costs without threatening viability.
The numbers are striking:
- At the current spot price of ~$13k per metric ton, 99% of the world's copper mines are operating below their AISC, meaning virtually every mine is profitable.
- Industry margins have reached all-time highs, underpinned by record copper prices, elevated byproduct revenues from gold, silver, and sulfuric acid, and treatment and refining charges (TC/RCs) that have fallen further into negative territory.
- The median copper mine carries an AISC margin of 55%, retaining more than half of each revenue dollar.
- Nine out of ten copper mines have operated profitably every year since 2020, a span that encompasses multiple commodity cycles and macro shocks.
With margins this wide, even a significant increase in diesel input costs does not fundamentally challenge the economics of most of the global copper production. The March sell-off effectively priced in the headline risk of war-driven cost inflation while ignoring the structural durability of the underlying earnings base.
Figure 3. Copper Miners’ Healthy Profitability (2019-2026)
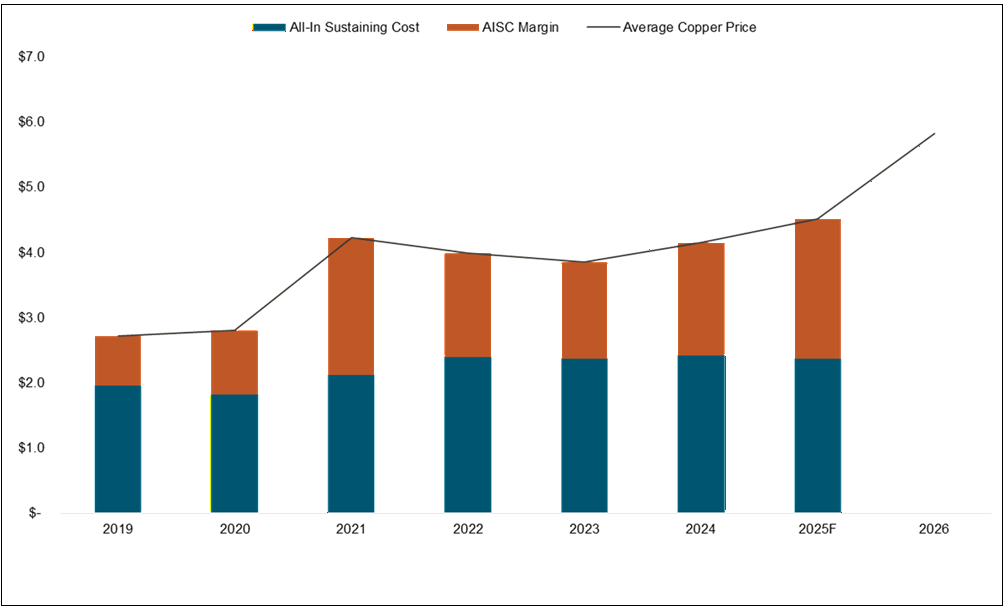
Source: As of 04/30/2026. S&P Global Market Intelligence. AISC is “All-In Sustaining Cost.” 2025 AISC is forecasted by S&P.
Geopolitics Are Reshaping Copper Demand
Looking beyond the near-term margin buffer, the Iran conflict is reinforcing a set of structural demand tailwinds for copper that are often underappreciated during periods of macro distress. The broader geopolitical backdrop is accelerating a fundamental reordering of how nations and corporations approach critical supply chains. The conflict is deepening a shift toward jurisdictional control over raw materials, processing capacity and manufacturing.
As geopolitical risk erodes confidence in open, globally integrated supply networks, the calculus is changing. The location where inputs are sourced, refined and assembled, is becoming as important as the cost at which they can be obtained. Critical materials are increasingly treated as sovereign assets rather than tradable commodities. The closure of Hormuz and the fracturing of established shipping routes are the latest reminders that reliance on long and exposed supply chains carries growing risk.
Grid Investment Is a Strategic Imperative
A sustained conflict in the Middle East is driving up energy costs, placing disproportionate pressure on economies. That pressure, in turn, accelerates investment in energy efficiency and domestic energy production across vulnerable nations, overwhelmingly in non-fossil-fuel-dependent sources. Grid buildout, renewable installations, energy storage and transmission upgrades are all meaningfully copper-intensive, creating a demand channel that may strengthen precisely when traditional economic demand softens.
The U.S. has designated the U.S. electrical grid as a national security concern. On April 20, the White House invoked Section 303 of the Defense Production Act (DPA) to classify electricity grid infrastructure as critical to national defense.7 The implications are significant:
- The electrical grid is now officially a national security asset, elevated from a civilian infrastructure concern to the same policy tier as energy, steel and fuel security.
- The DPA memo focuses on equipment shortages and lead times, underscoring why electrification, AI data center expansion, military readiness and renewable deployment are all bottlenecked by physical grid capacity.
- Section 303 unlocks government-backed demand and financing, improving execution timelines and revenue visibility for domestic manufacturers of grid equipment and the materials used in them.
- This represents explicit industrial policy on defense grounds, a framing that lowers political friction and increases the likelihood of policy durability across administrations and political cycles.
Ultimately, this reinforces tailwinds for U.S. electrical grid suppliers, and for energy security positions anchored in physical infrastructure, including nuclear power.
Figure 4. Annual Grid Investments Forecasted to Grow
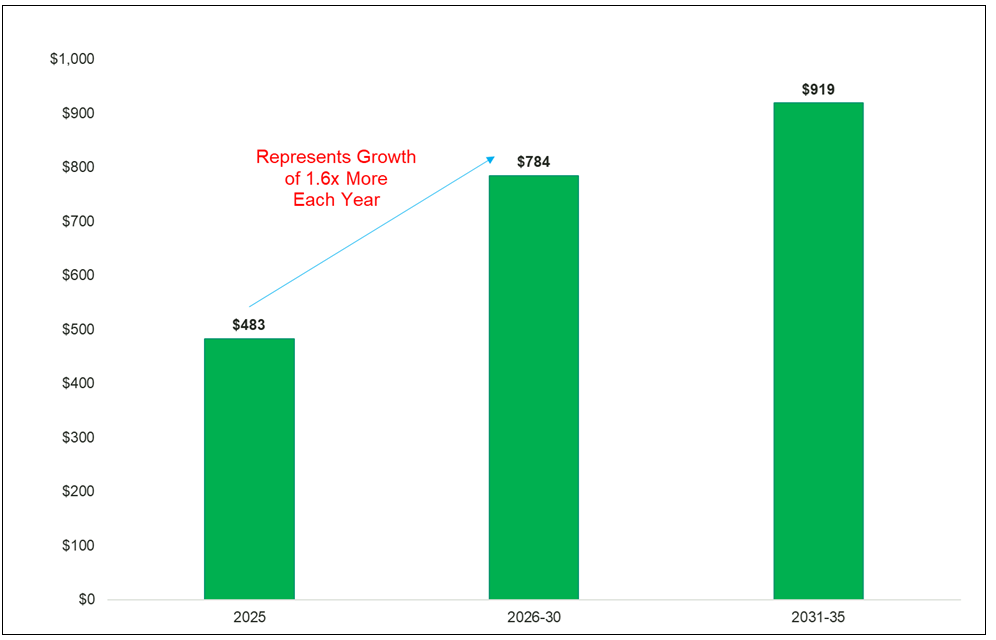
Source: BNEF Energy Transitions Trends 2026. NZE Forecast.
Sulfuric Acid Shock: A Hidden Constraint on Copper Supply
The war's supply-side consequences may prove as significant for copper as the demand-side effects. Two simultaneous disruptions converged in April, creating an acute sulfuric acid shortage with direct implications for copper production.
Sulfuric acid plays two distinct roles in the copper supply chain. For the 79% of 2025 global copper mine output produced via concentrate smelting, sulfuric acid is a byproduct (output). For the remaining 21% produced via solvent extraction and electrowinning (SX-EW), it is a required input consumed in large volumes to extract copper. This dual role is what makes the current crisis so complex. The same price spike that threatens SX-EW producers is supporting smelter margins. 4.8 million metric tons of global copper mine supply is produced via SX-EW and is therefore structurally dependent on sulfuric acid availability.
Amplified by China’s export ban, sulfuric acid shortages are constraining copper supply.
Most of the global sulfuric acid is produced by burning elemental sulfur, with the remainder generated as a byproduct of base metal smelting, principally copper and zinc. Countries upstream of the Strait of Hormuz account for roughly 49% of global sulfur trade, according to the International Fertilizer Association. Since the conflict has impeded this route, the sulfur supply has been disrupted, and the longer Hormuz remains closed, the further it threatens to disrupt the SX-EW copper supply.
Compounding the sulfur disruption, China announced on April 9 a full suspension of sulfuric acid exports, effective May 18. China was the world's largest sulfuric acid exporter in 2025, and its removal from the market eliminates the primary source of sulfuric acid that had been balancing regional deficits. China’s rationale? Safeguarding domestic supply ahead of the spring fertilizer season (sulfuric acid is also critical to modern agriculture as the backbone of fertilizer production), as China itself depends on sulfur imports that transit the Strait of Hormuz. The practical effect on the copper market is that it externalizes the shortage to producers outside of China. The spillovers are already visible. For example, Indonesia's nickel processing chain is experiencing tightness due to a shortage of sulfuric acid, limiting nickel production.
The regions most exposed are those where SX-EW production is concentrated, and alternative acid sourcing is limited. Chile, the world's largest copper producer at approximately 5.3 million metric tons annually (~23% of global output), derives about one-fifth of its production from SX-EW. China supplied roughly 37% of Chile's sulfuric acid imports in 2025.
The Democratic Republic of the Congo (DRC) and Zambia, accounting for 14% and 4% of global copper supply, are more structurally exposed, with copper production dependent on SX-EW. Diesel shortages currently pose the more immediate operational constraint in the region. However, not every producer is equally disadvantaged. Ivanhoe, which operates a concentrate smelter in the DRC, has become a net seller of sulfuric acid into a supply-starved market, turning the squeeze into a competitive differentiator.11
The production impact will unfold over months, not weeks. While copper producers are buffered in the near term by existing sulfuric acid inventories and in-transit shipments, the immediate effect is higher costs rather than outright disruptions. The more meaningful risk lies further out, as sourcing becomes increasingly constrained.
We believe the net effect is bullish12 for copper miners, particularly outside of China. Reduced sulfuric acid availability implies lower SX-EW output, which accounts for roughly one-fifth of global mine supply. In a market already in structural deficit, any incremental supply loss further tightens the balance and is likely to support prices. The extent of disruption will vary by region, depending on contract coverage and inventory levels, creating potential advantages for more diversified producers.
Figure 5. Sulfuric Acid Price Hike (2025-2026)
Source: Bloomberg. Sulfuric Acid Price in China, measured by the GCFPSACH Index, which tracks sulfuric acid prices in China, is used as an indicator of sulfuric acid cost pressures in commodity and copper-market analysis.
Smelters Pay to Process and the Sulfuric Acid Lifeline
When a copper miner sells concentrate to a smelter, the smelter earns a treatment charge (TC) for processing the material into refined copper. Historically, treatment and refining charges (TC/RCs) accounted for around one-third or more of smelter revenue. A negative TC reverses that relationship entirely, with the smelter paying the miner for the right to process its concentrate.
Each year, the world's largest copper miners and smelters negotiate a benchmark TC that sets the reference rate for long-term supply contracts. For 2026, that benchmark was set at $0 per metric ton of concentrate, the first time on record. Spot TCs, which reflect the price for uncommitted metric tons traded on the open market, tell an even starker story. As recently as late 2023, spot TCs stood above $90 per dry metric ton. TCs then fell steadily through 2024, turned negative in early 2025 and have not recovered since. By February 2026, spot TCs had reached negative $51.11. Then the Iran conflict accelerated the deterioration. TCs fell to negative $66.10 in March and negative $80.35 by the end of April, a decline of roughly 57% in just two months (Figure 5). From peak to trough, the swing represents a nearly $175-per-metric-ton reversal in smelter economics, transforming what was once a core revenue stream into a direct cost.
Negative TCs have turned a core revenue stream into a cost, leaving smelters reliant on byproducts to stay viable.
With a revenue stream that once accounted for a third of smelter income now deeply negative, the question is how smelters remain viable. The answer is that record-high prices for gold, silver and sulfuric acid have strongly supported other revenue streams. These byproduct revenues have created an alternative earnings base large enough to offset the collapse in processing fees. Chinese smelters maintained positive cash margins through April, supported by the increase in domestic sulfuric acid prices and by free metals, the excess metal recovered from concentrate beyond contracted payable amounts. The smelters capturing the most benefit are in China, where acid revenues are significantly less hedged under long-term supply contracts.
The critical variable ahead is whether China’s export ban, by increasing domestic availability, ultimately lowers China’s sulfuric acid prices. If it does, the byproduct revenue that has allowed smelters to absorb deeply negative TCs would diminish, potentially forcing curtailments that reduce refined copper supply. Meanwhile, the removal of the export ban on sulfuric acid from the seaborne market constrains ex-China SX-EW production. This range of outcomes skews in favor of copper.
Figure 6. China’s Record Low Smelter Treatment Charges (TCs) (2022-2026)
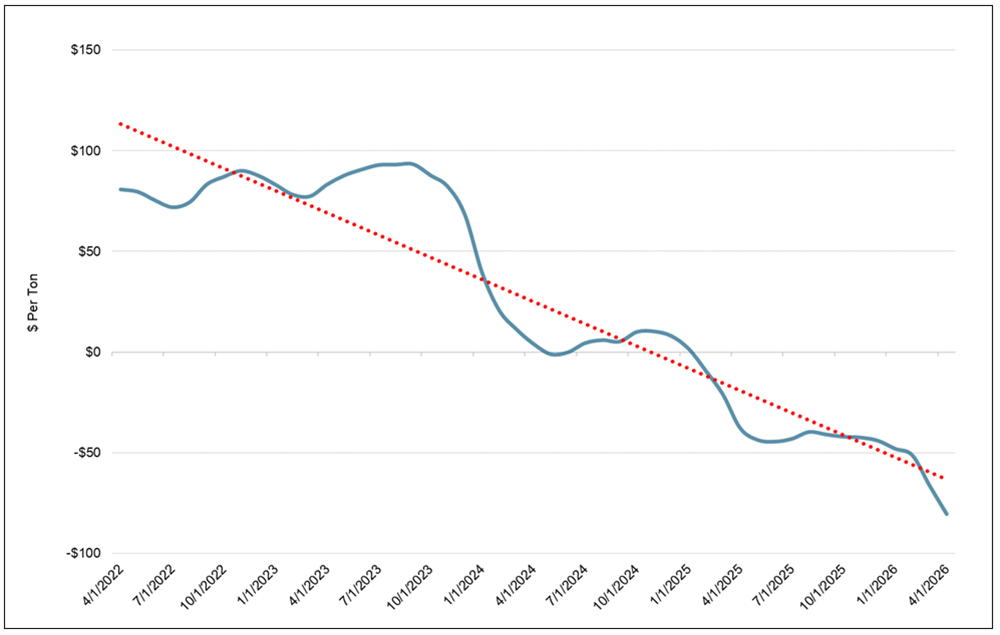
Source: Bloomberg. China Treatment Charge, measured by the ZACNTC26 Index, which tracks China copper smelter treatment charges, is used as an indicator of smelter economics and copper concentrate market tightness.
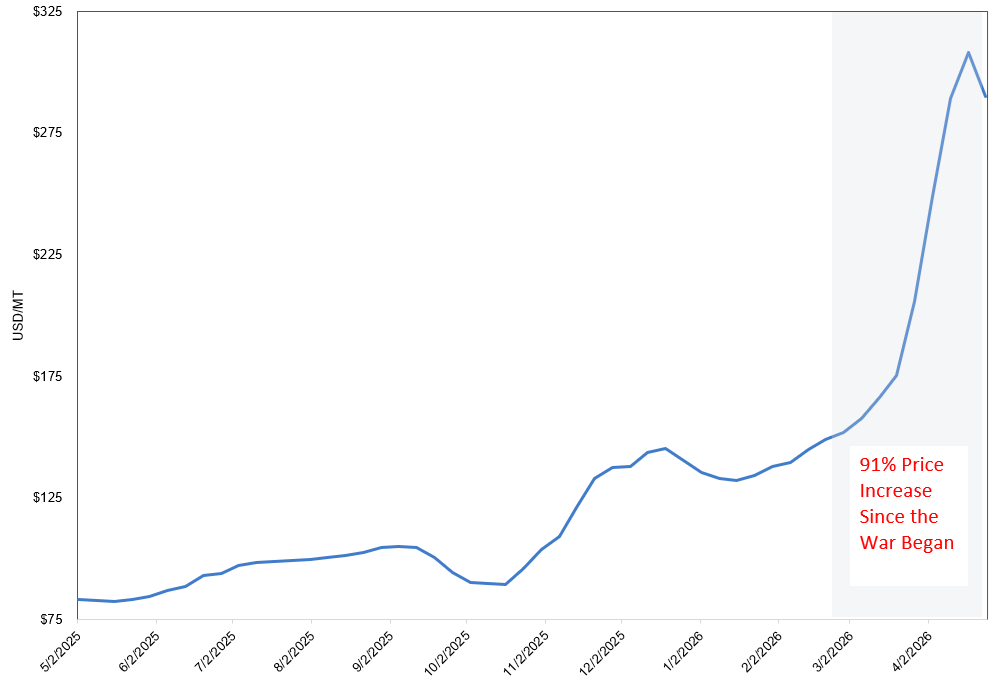
Multiple Catalysts Are Reinforcing Copper’s Bull Case
Several catalysts will shape copper's trajectory in the coming months. The Iran conflict shows no signs of resolution, and the longer the Strait of Hormuz remains closed, the deeper the sulfuric acid shortage becomes. China's sulfuric acid export ban took effect May 1, starting the clock on supply stress that may leak into production data. On the trade front, the COMEX-LME arbitrage continues to pull physical copper into the U.S. at a record pace, while a Section 232 decision on refined copper tariffs is expected by the end of June. A tariff on copper cathodes (the primary raw material used to produce high-grade copper products) would be one of the most consequential policy events for the global copper market in 2026, further tightening availability outside the U.S. President Trump and President Xi are scheduled to meet May 14-15, where commodity access is expected to be a central agenda item.
The structural investment case for copper continues to build. Input costs are rising, supply is already tight and we are facing an entrenched upstream constraint. Demand is diversifying into policy-supported, durable strategic sectors. Copper is increasingly being priced as strategic infrastructure, and when durable demand meets constrained supply responsiveness, the setup may support both copper prices and copper mining equities through 2026.
Figure 7. Copper Rebounds to Near All-Time Highs (2000-2026)
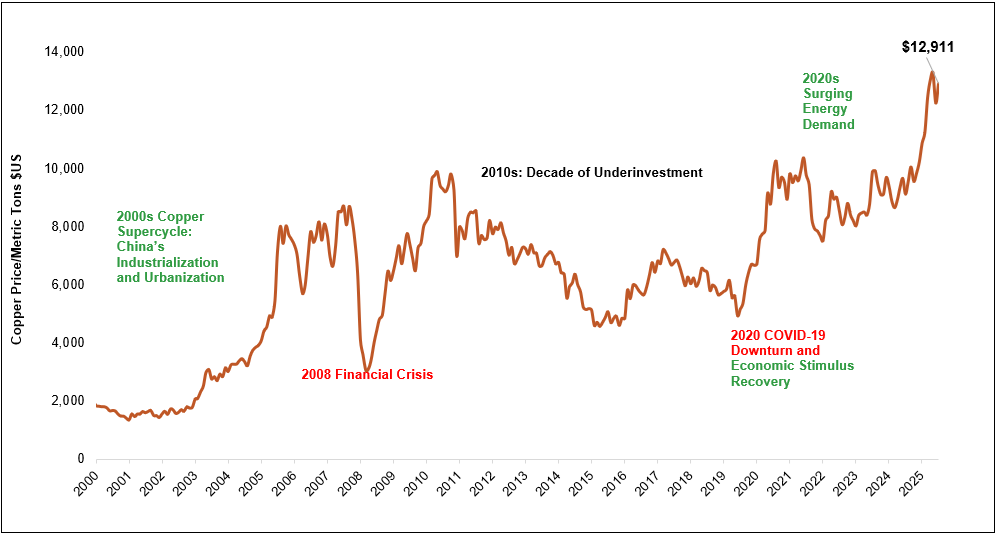
Source: Bloomberg as of 04/30/2026. Copper is measured by LMCADY Comdty, or LME Copper Cash, a benchmark measure of the spot price of copper. Past performance is not indicative of future results.
Footnotes
| 1 | The copper spot price is measured by the LME Copper Cash ($), Bloomberg ticker LMCADY. |
| 2 | The Nasdaq Sprott Copper Miners™ Index (NSCOPP™) is designed to track the performance of a selection of global securities in the copper industry; the Index was co-developed by Nasdaq® and Sprott Asset Management LP. |
| 3 | Nasdaq Sprott Junior Copper Miners™ Index (NSCOPJ™) is designed to track the performance of mid-, small- and micro-cap companies in copper-mining related businesses; the Index was co-developed by Nasdaq® and Sprott Asset Management LP. |
| 4 | The Bloomberg Commodity Index (BCOM) is a broadly diversified commodity price index that tracks prices of futures contracts on physical commodities and is designed to minimize concentration in any one commodity or sector. It currently has 23 commodity futures in six sectors. |
| 5 | The S&P 500 or Standard & Poor's 500 Index is a market-capitalization-weighted index of the 500 largest U.S. publicly traded companies. |
| 6 | Source: Canadian Mining Report, Record U.S. Oil Exports, Crashing Inventories, Higher Diesel Costs Hit Canadian Mining Margins Hard, April 30, 2026. |
| 7 | Source: U.S. Presidential Actions, Presidential Determination Pursuant to Section 303 of the Defense Production Act of 1950, as Amended, on Grid Infrastructure Equipment and Supply Chain Capacity, April 20, 2026. |
| 8 | Source: Mining.com, China Moves to Ban Sulfuric Acid Exports as Iran War Hits Supply, April 10, 2026. |
| 9 | Source: USGS, Mineral Commodity Summaries 2026: Copper. |
| 10 | Source: S&P Global, No Quick Sulfuric Acid Fix for Chilean Copper Sector, Analysts Say, April 21, 2026. |
| 11 | Source: Reuters, Ivanhoe Holds Captive Audience in Congo Sulphuric Acid Market, CEO Says, April 15, 2026. |
| 12 | Bullish is the sentiment that market prices will rise. |


Investment Risks and Important Disclosure
Relative to other sectors, precious metals and natural resources investments have higher headline risk and are more sensitive to changes in economic data, political or regulatory events, and underlying commodity price fluctuations. Risks related to extraction, storage and liquidity should also be considered.
Gold and precious metals are referred to with terms of art like "store of value," "safe haven" and "safe asset." These terms should not be construed to guarantee any form of investment safety. While “safe” assets like gold, Treasuries, money market funds and cash generally do not carry a high risk of loss relative to other asset classes, any asset may lose value, which may involve the complete loss of invested principal.
Past performance is no guarantee of future results. You cannot invest directly in an index. Investments, commentary and opinions are unique and may not be reflective of any other Sprott entity or affiliate. Forward-looking language should not be construed as predictive. While third-party sources are believed to be reliable, Sprott makes no guarantee as to their accuracy or timeliness. This information does not constitute an offer or solicitation and may not be relied upon or considered to be the rendering of tax, legal, accounting or professional advice.