- View Critical Materials September 30, 2024 Performance Table
- For the latest standardized performance and holdings of the Sprott Critical Materials ETFs, please visit the individual website pages: SETM, LITP, URNM, URNJ, COPP, COPJ and NIKL. Past performance is no guarantee of future results.
Key Takeaways
- Expectations of a surge in demand for electricity over the next decade are creating a perfect storm for the U.S. power grid, forcing utilities and carriers to deploy various new and old technologies to keep pace.
- Demand is being driven by new investment in power-hungry industrial facilities, especially the data centers that support artificial intelligence (AI), as well as U.S. reshoring initiatives and the steady electrification of the transport sector.
- Renewable sources like solar and wind, and revived nuclear generation, should play bigger roles in meeting energy needs. For the foreseeable future, natural gas is expected to remain a crucial part of the U.S. energy mix.
September in Review
The Nasdaq Sprott Critical Materials Index (NSETM) surged 105.11 points or 11.83% in September, closing the month at 993.67. All major Index components rebounded sharply from deeply oversold levels at the start of the month. September began on a negative note due to renewed economic concerns, wSeptember ith weak labor and manufacturing data dimming hopes for a soft landing in the U.S. The market bottomed before the U.S. Federal Reserve announced a 50 basis points cut in its benchmark interest rate on September 18, which triggered a broad rally in risk assets.
Late in September, China announced a stimulus package amounting to approximately 3% of GDP, primarily focused on monetary easing. This had an immediate positive impact on China-related asset prices, including the commodity and resource sectors. The Chinese central bank (People’s Bank of China) and Politburo also signaled further fiscal stimulus measures, which were expected to be announced after the Golden Week holiday in early October. The NSETM Index has recovered half of its correction from the mid-May highs.
Global stock markets saw a brief growth scare over the summer, exacerbated by the forced unwinding of complex hedging positions involving volatility options. However, they have since bounced back to post new all-time highs. The outlook for additional Fed rate cuts, alongside a synchronized global rate-cutting cycle and accelerating global M2 growth (a measure of global money supply), has bolstered risk assets. China's surprise large-scale stimulus package further supports the outlook, significantly improving the chances of a soft landing for the global economy as reflected in the price rebound in the energy transition sectors.
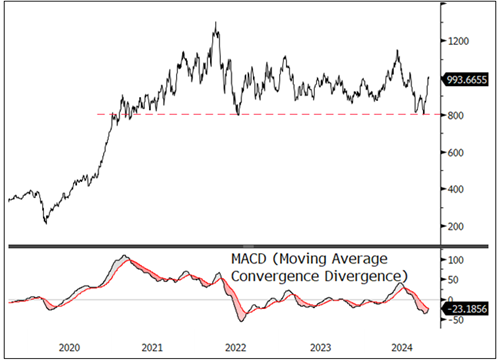
Source: Bloomberg. Nasdaq Sprott Critical Materials Index. Data as of 9/30/2024. Moving average convergence/divergence is a trend-following momentum indicator that shows the relationship between two exponential moving averages (EMAs), calculated by subtracting the 26-period EMA from the 12-period EMA. Past performance is no guarantee of future results.
AI Revolution Transforms Electricity Demand and Power Grids
The U.S. electric grid is facing unprecedented challenges as electricity demand is expected to grow much faster than previously anticipated. The drivers of this surge in electricity demand are multifaceted. At the forefront is massive investment in facilities with large power loads, including manufacturing and industrial facilities and especially data centers supporting AI. The reshoring of U.S. manufacturing spurred by initiatives like the CHIPS and Science Act and the Inflation Reduction Act is also a driving factor. Since 2021, for example, annual construction spending on new U.S. manufacturing facilities has more than doubled. The electrification of transportation and buildings and the increasing frequency of severe weather events further contribute to this trend.
The expected rise in electricity demand signals a significant departure from the previous era of flat power demand and presents a new challenge for grid planners and policymakers. With an additional 333 TWh (terrawhat hours) of new electricity demand expected in the U.S. by 2030, investment in transmission infrastructure must rise to keep pace.
Figure 2 shows certain growth forecasts for U.S. electricity demand and contrasts them with a baseline projection from the historical growth rate (dotted blue line). From 2000 to 2023, growth in U.S. electricity demand averaged 0.58% per year. According to BNEF, a leading provider of research on energy transition, demand over the next decade is expected to compound at an annual rate of 1.3%, twice the growth rate of the prior decade. Other forecasts, which vary considerably mainly due to differing assumptions of AI-driven electricity demand, typically expect an annual growth rate of 2-2.5% over the next decade. Whether actual growth is at the lower or upper end of estimates, the U.S. electricity system is set to undergo dramatic changes.
Figure 2. Diverging Demand Paths (2000-2035)
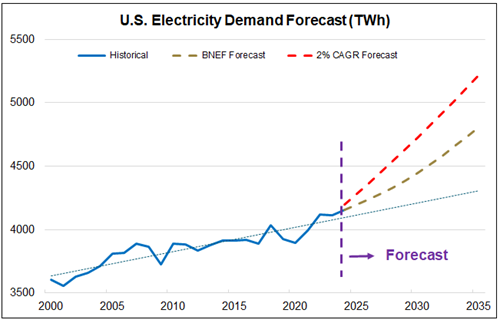
Source: BNEF. US electricity demand (TWh), historical and forecast trends. Past performance is no guarantee of future results.
The AI Factor in Electricity Demand
The rapid growth of generative AI is poised to drastically reshape the energy sector and electricity demand, with profound implications for the power grid. The data center industry, the core of AI operations, is now entering its third wave of growth, driven by AI, machine learning and edge computing (the first wave was the initial adoption of the Internet and e-commerce; the second wave was cloud computing and big data).
AI is fueling a surge in electricity demand, primarily from data centers, necessitating grid upgrades and renewable energy expansion.
AI processing requires significantly more power than traditional computing tasks. AI queries, for example, can consume up to 10 times the energy of a standard Google search. As AI becomes more integrated into day-to-day operations across industries, the grid must adapt to ensure that growing demand does not outstrip supply. The next generation of AI models that can process images, audio and video is expected to require orders of magnitude more power.
A recent Bloomberg Intelligence report, for example, forecasts that electricity consumption by data centers is expected to surge by 4-10 times by 2030.16 At the upper end, data centers could account for up to 17% of total U.S. electricity consumption by 2030, marking a significant shift in how energy is used.
Elsewhere, Goldman Sachs estimates that data centers will drive over a third of an expected 2.4% annual growth in U.S. power demand through 2030, and consume 8% of US electricity by that time.17
While AI model training is energy-intensive, it also has the potential to improve grid efficiency and optimize computing processes, which could help offset the increase in electricity demand. AI can make data centers more flexible in their energy consumption, reducing the need to constantly operate at peak demand.
As AI's energy demands grow, so too will its carbon footprint, leading renewable energy sources to take center stage. Solar power and battery storage are expected to play a critical role in meeting AI-driven electricity needs. Major AI companies like Meta, Microsoft, Amazon and Alphabet are increasingly prioritizing low-emission energy sources as part of their ESG commitments, which is driving the development of massive renewable energy projects.
Governments also view AI as a technological revolution and an essential driver of economic growth with embedded national security interests. Microsoft’s recent deal with Constellation to restart a reactor at the Three Mile Island nuclear plant is an example of efforts to ensure that American companies won’t need to build data centers abroad for energy reasons. Offshoring AI-related technology and industry is a non-starter, so meeting power needs domestically will likely occur by any means.
Perfect Storm for Power Infrastructure
The dramatic upsurge in electricity demand presents the power sector with a perfect storm of energy challenges. One of the biggest challenges for utilities will be building new infrastructure quickly enough to meet the skyrocketing demand now expected from AI-related spending. While data centers can be constructed in two years, the approval process for new transmission lines in the U.S. can take up to a decade, creating a significant mismatch in timelines.
The surge in electricity demand is straining the power grid, requiring utilities to rapidly expand infrastructure and diversify energy sources.
In response, utilities are deploying a variety of new-generation technologies, including solar and wind, while maintaining natural gas as a reliable backup. Although solar and wind projects can be rapidly built, advanced options like small modular nuclear reactors (SMRs) take longer to come online.
Grid-enhancing technologies, which aim to improve the efficiencies of the existing transmission system, offer another partial solution. These technologies could, in theory, enhance efficiency by up to 30%. However, they remain costly and require substantial amounts of critical materials, such as copper, for key components like conductors, transformers and wiring. The integration of these technologies will be essential to meeting future energy needs efficiently.
Dominion Energy, which serves northern Virginia’s "data center alley", aims to generate 90-95% of its electricity from carbon-free sources. However, rising energy demand is prompting the company to consider new natural gas plants, complicating its decarbonization goals. Similarly, Duke Energy has seen its projected load growth increase fivefold, primarily driven by the energy needs of data centers. This surge is forcing utilities, regulators and data centers to seek innovative solutions for expanding generation capacity, upgrading transmission infrastructure, and improving overall efficiency.
PJM Interconnect, the largest electric grid operator in the U.S., reported an 800% increase in forward-looking capacity prices during its 2025/2026 base residual auction, highlighting the mounting pressure on the grid. The price jump reflects the growing imbalance between supply and demand as the aging power infrastructure struggles to keep pace with rising consumption.
While renewable energy sources like solar and wind will play an increasing role in meeting energy needs, natural gas remains a crucial part of the energy mix. Its ability to quickly scale up production makes it ideal for providing backup power when solar and wind sources are unavailable. As AI data centers continue to increase their energy consumption, demand for natural gas is expected to rise, particularly in the U.S., which has an abundant supply.
Reviving Nuclear: Near- and Long-Term Bets
Nuclear power is being promoted as a solution to the world's energy needs due to its low emissions and reliability, but it faces challenges in meeting AI-driven electricity demand. Nuclear power could provide the stable baseload power required by AI data centers. However, its high cost and lengthy timelines—it typically takes more than a decade to build a new reactor—make new nuclear plants unlikely to play a significant role in addressing near-term energy needs. As a result, the rise in electricity demand has pushed deployment of solar power, battery storage and natural gas generation in recent years, which have much shorter construction timelines.
Nuclear power offers long-term potential, and plant revivals and small modular reactors could help meet future energy needs.
This is now changing, however, as the revival of dormant nuclear plants gains traction. Constellation Energy and Microsoft have announced a significant partnership to restart the Three Mile Island Unit 1 nuclear plant in Pennsylvania. This 20-year deal will see Constellation supplying power to Microsoft’s data centers from the plant. The restart of this plant, which was shut down in 2019 for economic reasons, is a notable move toward meeting the growing energy demands of the tech industry with carbon-free power. The plant is expected to generate 835 MW (or ~7 TWh per year) of power. This follows Amazon’s acquisition in March of a data center from Talen Energy that a nuclear power plant directly powers. That leaves Google as the remaining “big three” data center company (Microsoft, Amazon, Google) to not yet sign a deal involving a U.S. nuclear plant.
Another notable example of nuclear revival is the Holtec Palisades plant in Michigan, which is in the process of being recommissioned after receiving regulatory approval and a $1.52 billion loan guarantee from the U.S. Department of Energy (DOE). If fully approved, it would become the first recommissioned nuclear plant in U.S. history.
Nuclear power remains an ideal energy source. The U.S. Energy Information and Administration (EIA) notes that 10 commercial nuclear reactors in the United States have been decommissioned and 20 are in various stages of decommissioning.18 These reactors no longer produce electricity but remain intact, with some being considered for potential revival due to increasing electricity demand.
Nuclear energy, which currently accounts for 18-20% of U.S. power generation, has bipartisan support in Congress. Small modular reactors are another potential source of nuclear power, but challenges remain in obtaining permits and reducing costs to encourage development. Despite the high costs and lengthy regulatory process, similar nuclear revivals are being considered nationwide as the need for clean, reliable power grows. DOE Secretary Jennifer Granholm has emphasized the importance of nuclear power and the need for Congress to treat the grid like other major infrastructure projects, such as highways, with consistent funding and legislative attention.
Clean Technologies Drive Copper Demand
The shift to renewable energy and electric transportation, accelerated by AI and decarbonization policies, is fueling a massive surge in global copper demand. The next decade will likely see copper emerge as the most critical material in the global energy transition. With increasing investment in clean technologies like electric vehicles (EVs), renewable energy and battery storage, copper demand is expected to continue to climb steadily, pushing global supply chains to adapt to meet this demand.
The global shift to renewable energy and electric transportation is driving a significant increase in copper demand.
According to the International Energy Agency (IEA), global copper consumption will grow from 25.9 million tonnes (MT) in 2023 to 32.6 MT by 2035, a 26% increase.19 Clean technologies such as electricity networks, renewable power generation and EVs will be at the core of this rising demand, with clean tech copper usage expected to rise by 81%, from 6.4 MT in 2023 to 11.5 MT by 2035 (see Figure 3). Notably, in the past year, the IEA has revised its 2030 forecast of copper demand from cleantech upward by 13% or a 1.24 MT increase.
Electricity networks and power generation have a particularly high and inelastic demand for copper, making them the most critical demand driver. The IEA expects electricity networks’ copper needs to grow from 4.1 MT in 2023 to 6.2 MT by 2035, a 49% increase. Copper demand for solar photovoltaics (PVs) or solar panels is expected to rise by 43% and for wind power by 38% over the same period. The fastest-growing sector is grid battery storage, where copper demand is expected to surge by 557% to 2035 as the need for energy storage increases. Copper demand from EVs is projected to rise 555% from 396 KT in 2023 to 2.6 MT by 2035, with EVs accounting for 8% of global copper consumption by then.
Figure 3. Forecasting Global Copper Demand
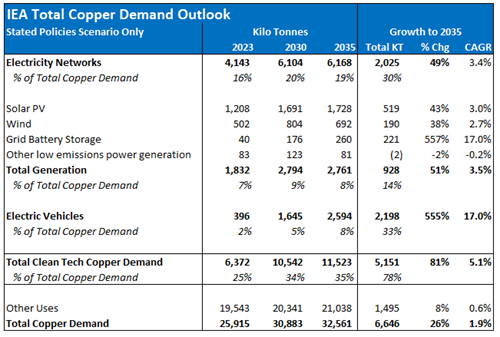
Source: International Energy Agency (IEA). Included for illustrative purposes only. Past performance is no guarantee of future results
Updates on Critical Minerals
Copper: Market Rally Continues
The copper markets rallied further in September, with the spot price rising 6.29% to $4.40. Copper mining stocks rose 8.71%, and copper juniors rose 8.55%. Copper and copper miners are standout performers year-to-date, outperforming most other critical materials and mining equities with 14.51% and 30.91% year-to-date returns, respectively.
While solid fundamentals like burgeoning AI and energy transition demand are bolstering the copper price, negative economic data had been the main headwind until September, when both the U.S. Fed and China made dramatic policy shifts.
The Fed’s rate cut in September marked the beginning of a rate-cutting cycle after it had hiked rates from early-2022 to mid-2023. The 50 basis points cut was also larger than many expected, suggesting the Fed’s attention was shifting from reducing inflation to deterioration in the job market. Copper tends to benefit from lower interest rates that reduce the cost of borrowing and increase spending in the economy, where (in today’s electrified world) copper is ubiquitous. Copper may be further set to benefit as another two or three rate cuts are anticipated in 2024 and another seven or eight cuts in 2025 (see Figure 4).
Figure 4. Pricing in Future Rate Cuts (Current to 2027)
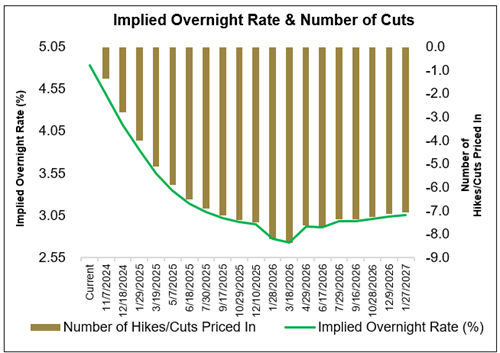
Source: Bloomberg. Expected cuts in the Federal funds rate as indicated by Federal fund futures as of 9/30/2024. Past performance is no guarantee of future results.
Also during September, China unveiled its most significant economic stimulus since the pandemic. Because China is the largest consumer of copper, this further bolstered the copper price and copper mining stocks. The announced monetary stimulus is valued at 3% of GDP and signals a potential demand recovery in China. Consistently disappointing Chinese economic data, like the faltering construction sector and declining growth due to an aging population and diminished productivity, had been a headwind for the copper price year-to-date. The Chinese stimulus is expected to help reverse this. That said, investors are looking for further fiscal stimulus from China as the monetary stimulus is generally not considered enough. Specifically, China has to stabilize its property sector and hit its 2024 economic growth target of roughly 5% (with only a few months left to go in the year). To that end, Reuters reported a potential two trillion yuan ($284 billion) fiscal stimulus20, and Bloomberg reported that China was considering injecting an additional one trillion yuan of capital into its banking system.21 No fiscal stimulus had been announced as of this writing.
Stronger growth from China and a stabilizing property sector would be beneficial for most commodities, but especially copper. Weakness in China has been a headwind for copper. However, it has been more than offset by increased copper demand from investment in electricity grid infrastructure, as well as demand from other sectors like renewables, appliances (for example, air conditioner production), transport and industrial equipment. In the longer term, we believe artificial intelligence and energy transition will increasingly overshadow property markets and general economic growth as key demand factors for copper.
As copper demand showed further improvement in September, inventories fell 31% from their August high level. Rising copper inventories had made headlines, suggesting that demand was weakening, but the quick and substantial reversal proved the contrary to this point. Copper inventories now represent just over a week of global demand, and falling exchange inventories provide the industry with less of a buffer, and heighten the risk of a sudden price surge should buyers make large drawdowns to secure supplies.
We believe that with the global economy turning more favorable, plus strong demand from electrification, AI and the energy transition, and an escalating supply-demand deficit, copper is well-positioned for its next supercycle. Further, copper miners may ultimately benefit as they provide operating leverage on a rising spot price.
Figure 5. Copper Keeps Climbing (2020-2024)
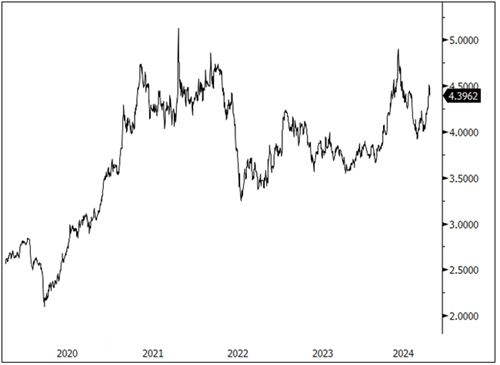
Source: Bloomberg. Copper spot price, $/lb. Data as of 9/30/2024. Included for illustrative purposes only. Past performance is no guarantee of future results.
Lithium: Signs of Life
The lithium carbonate spot price rose modestly by 1.84% in September, marking the first monthly increase since April. Lithium miner stocks rebounded from oversold levels, rising 12.65% in September. However, the lithium spot price remains below a sustainable level, and we believe it will need to rise to incentivize supply in the longer term.
Chinese lithium supply has become susceptible to disruption. Much of China’s lower-grade and higher-cost source of lithium, lepidolite, is no longer economical. Starting in August, this unprofitable supply, which has helped drive down the market, has faced output cuts. First, multiple Chinese lithium producers stated they are cutting or suspending lithium production, noting, “We are under great pressure. Every ton of lithium salts we sell brings us losses.” 22 Then, in September the Chinese battery giant CATL announced plans to reduce its production of lepidolite-based lithium carbonate due to unfavorable market conditions.23 Since CATL’s lithium production is vertically integrated with its operations as the world’s largest maker of batteries, it was considered less likely to cut back, so this move counted as a particularly positive surprise for the market.
The sharp decline in lithium prices juxtaposed with the stark demand-supply imbalance expected in the years ahead positions lithium miners well going forward. Since mining stocks have fallen, mergers and acquisitions at favorable prices are also more likely. To that end, Australian lithium miner Pilbara Minerals Ltd. announced in August that it would acquire a smaller lithium miner, Latin Resources Ltd., for $369.4 million, representing a 66.7% premium to Latin’s last close.24 The acquisition will give Pilbara control over Latin’s flagship Salines project in Brazil and diversify its assets outside Australia.
Lithium miners may also be well-positioned for increased funding opportunities as domestic manufacturing and friend-shoring continue to be a priority for Western countries. In September, the U.S. announced over $3 billion in funding for 25 selected projects to boost the domestic production of advanced batteries and battery materials. Among lithium miners, Albemarle Corp. is to receive $67 million, and a joint venture of Standard Lithium Ltd. and Equinor ASA will receive $225 million.25 Subsequently, U.S. Vice President Kamala Harris promised, if elected, to create a national stockpile of critical minerals like lithium and nickel as part of a broader $100 billion industrial policy.26 Bloomberg reported that the U.S. House of Representatives Select Committee on Strategic Competition between the U.S. and the Chinese Communist Party in December recommended creating a reserve of critical minerals “to insulate American producers from price volatility” and protect against China’s “weaponization of its dominance in critical mineral supply chains.” Further, the committee recommended spending $1 billion to expand an existing National Defense Stockpile, an inventory of critical minerals for the Defence Department. Ultimately, as the West looks to reduce dependencies on China, these and other potential industrial policy moves may benefit miners of critical materials like lithium.
Figure 6. Modest Price Rise in September (2020-2024)
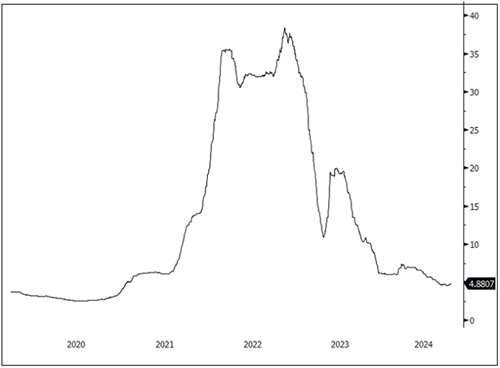
Source: Bloomberg. Lithium carbonate spot price, $/lb. Data as of 9/30/2024. Included for illustrative purposes only. Past performance is no guarantee of future results.
Nickel: Macro and Policy Boosts
The nickel spot price gained 4.40% in September while nickel miner stocks rose by 10.56%. Like copper, nickel has benefitted from the announced Chinese stimulus and the regime-shift to lower interest rates. Nickel is tied to economic growth and lower interest rates through its largest demand segment, stainless steel, which represents 65% of total demand. Like lithium, nickel has benefitted from new policies on critical materials, such as the $3 billion funding program the U.S. government announced in September for domestic production of batteries and battery materials, as well as Harris’s promised critical mineral stockpile. Batteries account for 16% of nickel demand but, more importantly, are expected to be the biggest driver of future demand growth for nickel.
Nickel miners received another boost when Russia’s President Vladimir Putin said on September 11 that Russia should consider restricting nickel exports.27 In a Kremlin official report Putin was quoted as saying:
“Please look at some types of goods that we supply in large quantities to the world market. Supplies of a number of goods to us are limited—maybe we should also think about certain restrictions? Uranium, titanium, nickel. In some countries strategic reserves are being created, and some other measures are being taken. But in general, if this will not harm us ... I am not saying that we need to do this tomorrow, but we could think about certain restrictions on deliveries to the foreign market not only of the goods that I have named, but also of some others.”
Uranium aside, Russian restrictions would not be a massive supply shock to the market. Earlier this year, for example, the London Metal Exchange banned Russian-origin nickel produced after April 13, and the U.S. and UK governments imposed sanctions. However, Russia does supply 6% of the world’s nickel and 14% of the world’s class 1 nickel, which has a higher purity and is used in batteries.
Figure 7. Nickel Gains on Economic Outlook (2020-2024)
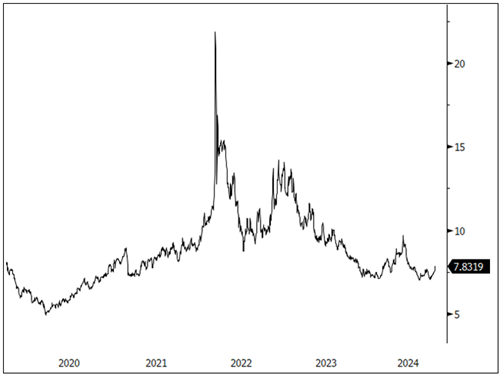
Source: Bloomberg. Nickel spot price, $/lb. Data as of 9/30/2024. Included for illustrative purposes only. Past performance is no guarantee of future results.
Performance as of September 30, 2024
| Metric | 9/30/2024 | 8/30/2024 | Change | % Chg | YTD Chg | Monthly Comment |
| Miners | ||||||
| Nasdaq Sprott Critical Materials™ Index1 | 993.67 | 888.55 | 105.11 | 11.83% | 0.79% |
The NSETM Index recovered more than half of its drawdown from the May highs with the start of the Fed rate-cutting cycle and the announcement of significant monetary stimulus from China. Most energy transition-related indices returned double-digit returns in September from very oversold levels. Further fiscal stimulus announcements from China are expected, providing another potential lift to the group. |
| Nasdaq Sprott Lithium Miners™ Index2 | 470.97 | 418.10 | 52.87 | 12.65% | (36.05)% | |
| North Shore Global Uranium Mining Index3 | 3,716.04 | 3,338.06 | 377.98 | 11.32% | (3.39)% | |
| Nasdaq Sprott Copper Miners Index4 | 1,369.71 | 1,259.93 | 109.78 | 8.71% | 30.91% | |
| Nasdaq Sprott Nickel Miners™ Index5 | 641.36 | 580.11 | 61.25 | 10.56% | (2.97)% | |
| Nasdaq Sprott Junior Copper Miners™ Index6 | 1,225.41 | 1,128.94 | 96.47 | 8.55% | 26.67% | |
| Nasdaq Sprott Junior Uranium Miners™ Index7 | 1,421.57 | 1,225.97 | 195.60 | 15.95% | (2.28)% | |
| Physical Materials | ||||||
| Lithium Carbonate Spot Price $/lb8 | 4.88 | 4.80 | 0.09 | 1.84% | (20.76)% |
First monthly increase since April. |
| U3O8 Uranium Spot Price $/lb9 | 81.75 | 79.00 | 2.75 | 3.48% | (10.16)% |
Begins to rebound from high $70s. |
| LME Copper Spot Price $/lb10 | 4.40 | 4.14 | 0.26 | 6.29% | 14.51% |
Gains on lower rates, China stimulus and fundamentals. |
| LME Nickel Spot Price $/lb11 | 7.83 | 7.50 | 0.33 | 4.40% | 5.44% |
Third monthly increase. |
| Benchmarks | ||||||
| S&P 500 Index12 | 5,762.48 | 5,648.40 | 114.08 | 2.02% | 20.81% |
The S&P 500 closed at a monthly all-time high as the Fed began its rate-cutting cycle with a 50 bps cut. The U.S. dollar fell to an important chart support level, aiding the rally in the commodity-resource groups. |
| DXY US Dollar Index13 | 100.78 | 101.70 | (0.92) | (0.90)% | (0.55)% | |
| BBG Commodity Index14 | 100.34 | 96.09 | 4.25 | 4.43% | 1.72% | |
| S&P Metals & Mining Index15 | 3,247.02 | 3,062.77 | 199.70 | 6.52% | 6.49% | |
*Mo % Chg and YTD % Chg for this Index are calculated as the difference between the month end's yield and the previous period end's yield, instead of the percentage change. BPS stands for basis points.
- For the latest standardized performance and holdings of the Sprott Critical Materials ETFs, please visit the individual website pages: SETM, LITP, URNM, URNJ, COPP, COPJ and NIKL. Past performance is no guarantee of future results.
Footnotes
| 1 | The Nasdaq Sprott Energy Transition Materials™ Index (NSETM™) is designed to track the performance of a selection of global securities in the energy transition materials industry, and was co-developed by Nasdaq® and Sprott Asset Management LP. |
| 2 | The Nasdaq Sprott Lithium Miners™ Index (NSLITP™) is designed to track the performance of a selection of global securities in the lithium industry, including lithium producers, developers and explorers; the Index was co-developed by Nasdaq® and Sprott Asset Management LP. |
| 3 | The North Shore Global Uranium Mining Index (URNMX) is designed to track the performance of companies that devote at least 50% of their assets to the uranium mining industry, which may include mining, exploration, development and production of uranium, or holding physical uranium, owning uranium royalties or engaging in other non-mining activities that support the uranium mining industry. |
| 4 | The Nasdaq Sprott Copper Miners™ Index (NSCOPP™) is designed to track the performance of a selection of global securities in the copper industry. |
| 5 | Nasdaq Sprott Nickel Miners™ Index (NSNIKL™) is designed to track the performance of a selection of global securities in the nickel industry. |
| 6 | Nasdaq Sprott Junior Copper Miners™ Index (NSCOPJ™) is designed to track the performance of mid-, small- and micro-cap companies in copper-mining related businesses. |
| 7 | Nasdaq Sprott Junior Uranium Miners™ Index (NSURNJ™) is designed to track the performance of mid-, small- and micro-cap companies in uranium-mining related businesses. |
| 8 | The lithium carbonate spot price is measured by the China Lithium Carbonate 99.5% DEL. Source Bloomberg and Asian Metal Inc. Ticker L4CNMJGO AMTL Index. Data converted to pounds and to USD with Bloomberg FX Rates. |
| 9 | The U3O8 uranium spot price is measured by a proprietary composite of U3O8 spot prices from UxC, S&P Platts and Numerco. |
| 10 | The copper spot price is measured by the LME Copper Cash ($). Source Bloomberg ticker LMCADY. Data converted to pounds. |
| 11 | The nickel spot price is measured by the LME Nickel Cash ($). Source Bloomberg ticker LMNIDY. Data converted to pounds. |
| 12 | The S&P 500 or Standard & Poor's 500 Index is a market-capitalization-weighted index of the 500 largest U.S. publicly traded companies. |
| 13 | The U.S. Dollar Index (USDX, DXY) is an index of the value of the U.S. dollar relative to a basket of foreign currencies. |
| 14 | The Bloomberg Commodity Index (BCOM) is a broadly diversified commodity price index that tracks prices of futures contracts on physical commodities, and is designed to minimize concentration in any one commodity or sector. It currently has 23 commodity futures in six sectors. |
| 15 | The S&P Metals & Mining Select Industry Index comprises stocks in the S&P Total Market Index that are classified in the GICS metals & mining sub-industry. |
| 16 | Source: Bloomberg Intelligence: AI-Driven Energy Demand Sept 2024. |
| 17 | Source: Goldman Sachs, “AI is poised to drive 160% increase in data center power demand”, May 14, 2024. |
| 18 | Source: U.S. Energy Information and Administration (EIA), “Decommissioning nuclear reactors is a long-term and costly process”, November 17, 2017. |
| 19 | Source: International Energy Agency (IEA), “Global Critical Minerals Outlook 2024: Outlook for key minerals”, May 2024. |
| 20 | Source: Reuters, “Exclusive: China to issue $284 billion of sovereign debt this year to help revive economy”, September 26, 2024. |
| 21 | Source: Bloomberg, “China Weighs $142 Billion Capital Injection Into Top Banks”, September 25, 2024. |
| 22 | Source: Fastmarkets, “Lithium weakness pushes Chinese producers to consider output cuts: sources”, August 16, 2024. |
| 23 | Source: Reuters, “China's CATL says plans to adjust lithium production in Jiangxi”, September 11, 2024. |
| 24 | Source: Mining.com, “Pilbara Minerals to acquire Latin Resources for $369 million (Reuters)”, August 14, 2024. |
| 25 | Source: BNN Bloomberg, “Biden Awards $3 Billion to Boost Domestic Battery Production”, September 20, 2024. |
| 26 | Source: Bloomberg, “Harris Calls for US Critical Minerals Reserve, Tax Credits”, September 25, 2024. |
| 27 | Source: World Nuclear News, “Russia to consider restricting uranium exports, Putin says”, September 12, 2024. |
Investment Risks and Important Disclosure
Relative to other sectors, precious metals and natural resources investments have higher headline risk and are more sensitive to changes in economic data, political or regulatory events, and underlying commodity price fluctuations. Risks related to extraction, storage and liquidity should also be considered.
Gold and precious metals are referred to with terms of art like "store of value," "safe haven" and "safe asset." These terms should not be construed to guarantee any form of investment safety. While “safe” assets like gold, Treasuries, money market funds and cash generally do not carry a high risk of loss relative to other asset classes, any asset may lose value, which may involve the complete loss of invested principal.
Past performance is no guarantee of future results. You cannot invest directly in an index. Investments, commentary and opinions are unique and may not be reflective of any other Sprott entity or affiliate. Forward-looking language should not be construed as predictive. While third-party sources are believed to be reliable, Sprott makes no guarantee as to their accuracy or timeliness. This information does not constitute an offer or solicitation and may not be relied upon or considered to be the rendering of tax, legal, accounting or professional advice.


