We believe the stage is set for a powerful advance in gold mining equities. While the 27.71% year-to-date advance in the bullion price could (but won’t necessarily) take a breather for the rest of 2024, significant catch-up potential for deeply undervalued gold miners has been barely exploited.
With gold trading at all-time highs, precious metals mining shares are just beginning to stir. GDX (VanEck Vectors Gold Miners ETF1 and a proxy for gold mining shares) has increased 28.41% year-to-date, only slightly more than the metal’s year-to-date gain of 27.71% (as of 9/30/2024). Looking at the five-year total return comparison (10/1/2019 to 9/30/2024), mining stocks gained 58.71%, distantly lagging gold’s 78.92% rise.
We have addressed the disconnect between gold bullion and gold equities in previous commentaries. Gold stocks, in our opinion, are coiling for a sharp advance during the remainder of 2024. At the time of writing, GDX is breaking out above a five-year trading range that looks very similar, with a six-month lag, to gold’s breakout earlier this year.
Figure 1a./b. Gold Bullion vs. Gold Mining Stock Prices (2019-2024)
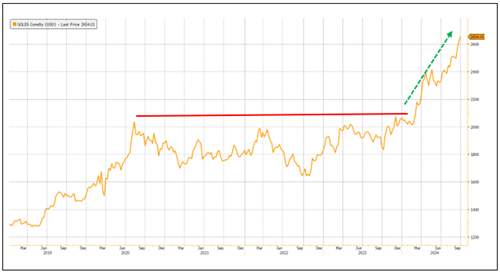
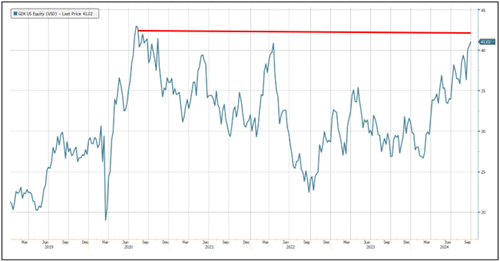
Source: Bloomberg. Data as of 9/30/2024.
Favorable Fundamentals for Gold Miners
The investment fundamentals for miners have rarely been so favorable against a backdrop of such disinterest. The Q3 2024 average gold price (the most important single variable for miners’ earnings and cash flow) will exceed Q2 by 5.2% sequentially, and 2023 by 18.8% year-over-year. For many companies, production is weighted toward the second half; we believe we may see blockbuster Q3 earnings reports later in October and early November.
Looking ahead to 2025, we expect production costs to remain stable or even decline in the event of a recession. Profit margins could expand even if the U.S. dollar gold price marks time (which we don’t expect). Figure 2 depicts the relationship between gold and commodity prices (CRB Index2). A rising trend line tends to be exceptionally bullish for the earnings of gold miners.
Figure 2. Ratio of Gold Price to CRB Index (2022-2024)
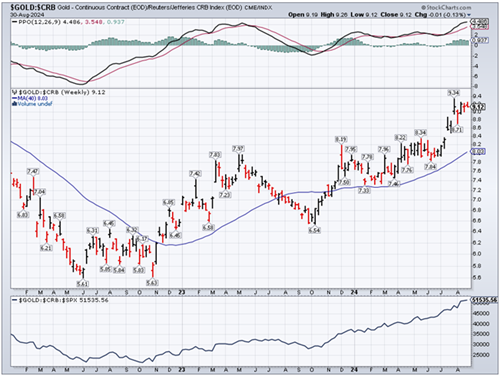
Source: StockCharts.com. Data as of 8/30/2024.
Gold Is Still Underpriced
A key factor in the underperformance of mining shares is general disbelief that current gold bullion prices are sustainable or capable of further increase. In our view, the breakout in the gold price is not a fluke. The many contributing factors include (but are not limited to) de-dollarization, central bank buying, seemingly intractable U.S. fiscal issues, a possible recession, further monetary malpractice by the Federal Reserve (and other central banks) and the worrisome geopolitical landscape. Still, gold skeptics far outnumber believers. Proof can be seen in the forecasts for future gold prices from a broad array of financial firms (compiled by Beacon Securities; individual estimates by firm in Appendix A).
Figure 3. Gold Price Forecast

Who would invest in a gold mining stock with such a negative price outlook? While there are a few outliers, the consensus does not regard current prices as sustainable. We attribute collective bearishness to inattentiveness, lack of understanding, intellectual laziness, disinterest, and incompatibility with the groupthink underpinning mainstream financial market positioning.
For the sake of brevity, we will not elaborate here on the multiple forces (some admittedly speculative) that could power the further gains in monetary metals that we expect. Extensive commentary on our rationale can be found in our previous commentaries, as well as from many other observers.
Western Investors Continue to Ignore Gold
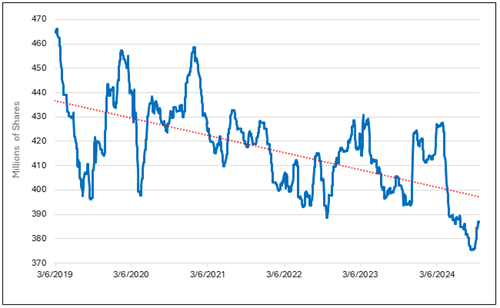
For now, it is enough to note that gold’s 78.92% five-year advance has occurred with almost no participation from U.S. and European investors. Negative investment flows have persisted in both ETFs backed by physical gold and mining stocks, as shown in Figures 4 and 5.
Figure 4. SPDR Gold Shares ETF (GLD) Change in Holdings by Year (2005-2024)
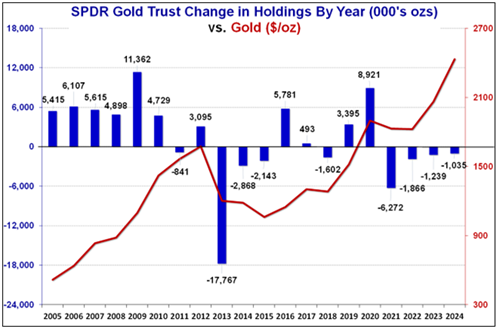
Source: Meridian Macro Research. Data as of 6/30/2024.
Figure 5. Current Shares Outstanding for GDX (2019-2024)
Source: Bloomberg. Data as of 9/30/2024.
Figure 6 shows that the positioning of financial advisors to precious metals is at a five-year low.
Figure 6. Advisors Hold Little Gold (2017-2024)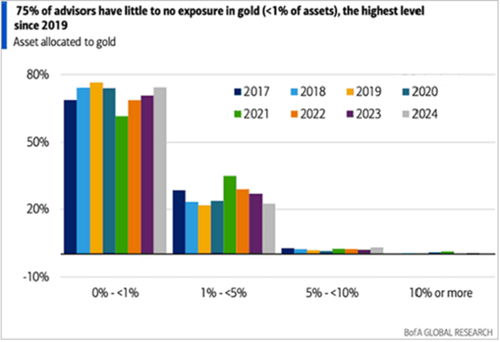
Source: BofA Global Research. Data as of 2/26/2024.
When Western capital market investors decide to reallocate a small portion of their capital to gold, and there are multiple reasons why they might, the metal’s price will likely move higher. The impact on mining company shares, which collectively have a market capitalization approximately equal to Home Depot or Costco's, would, in our opinion, substantially exceed the percentage increase in the metal’s price.
It is worth noting that following the launch of GLD (SPDR Gold Shares ETF)3 in 2004, inflows of approximately 38 million ounces were sufficient to help fuel a 300% rise in the gold price from slightly less than $600 to $1,900 in August 2011, a seven-year span. Since 2010, the quantity of money (M2)4 has increased 248% while the quantity of gold has increased (through mine output) only 22.2%. The quantity of U.S. dollars that could be exchanged for gold has increased 10x relative to the quantity of physical gold over the past 15 years.
Measured against the ratio of U.S. dollars to gold creation, the five-year 70% increase in the gold U.S. dollar price seems both sustainable and probably inadequate. Liquidity created by the Fed’s decade-long policy of ultra-low interest rates and QE (quantitative easing) initially found its way into overvalued equities and assorted other financial assets. A small leakage from those positions would represent enormous buying power relative to available metal.
Early-Stage Bull Market for Gold
The current bull market for gold is embryonic, in our opinion. The classic hallmarks of an early-stage bull market include widespread skepticism and general underpositioning. The inevitable transition of investor psychology from pessimism to exuberance takes several years. Long-term investors in mining stocks are beginning to experience a small amount of daylight with the year-to-date rally.
The temptation to cash in gains that are paltry relative to years of unproductive returns is difficult to resist. We advise further patience. In our view, valuations remain exceptionally attractive assuming only the continuation of spot pricing for precious metals. Inflows into the tiny precious metals mining universe have barely started. The upside potential that likely lies ahead may be well worth any additional wait.
View Appendix A: Gold Price Forecasts by Company
| 1 | VanEck Vectors Gold Miners ETF (GDX) tracks the overall performance of companies involved in the gold mining industry. |
| 2 | The Commodity Research Bureau Index (CRBI) acts as a representative indicator of today's global commodity markets. It measures the aggregated price direction of various commodity sectors. |
| 3 | The SPDR Gold Shares ETF (GLD) tracks the price of gold bullion in the over-the-counter (OTC) market. |
| 4 | M2 is a measure of the money supply that includes cash, checking deposits and easily convertible near money. M2 is a broader measure of the money supply than M1, which includes cash and checking deposits. |
Investment Risks and Important Disclosure
Relative to other sectors, precious metals and natural resources investments have higher headline risk and are more sensitive to changes in economic data, political or regulatory events, and underlying commodity price fluctuations. Risks related to extraction, storage and liquidity should also be considered.
Gold and precious metals are referred to with terms of art like "store of value," "safe haven" and "safe asset." These terms should not be construed to guarantee any form of investment safety. While “safe” assets like gold, Treasuries, money market funds and cash generally do not carry a high risk of loss relative to other asset classes, any asset may lose value, which may involve the complete loss of invested principal.
Past performance is no guarantee of future results. You cannot invest directly in an index. Investments, commentary and opinions are unique and may not be reflective of any other Sprott entity or affiliate. Forward-looking language should not be construed as predictive. While third-party sources are believed to be reliable, Sprott makes no guarantee as to their accuracy or timeliness. This information does not constitute an offer or solicitation and may not be relied upon or considered to be the rendering of tax, legal, accounting or professional advice.


