

Is Gold Still Underpriced?
We believe the next leg up for gold will be driven by a loss of confidence in mainstream positioning in equities, high-yield bonds and private equity. Concerns over tariffs may well have become a contributing factor to the gathering deflation of the financial asset bubble, but overanalyzing their possible impact obscures focus on market forces that were in motion long before “Liberation Day."
The run to record gold bullion prices in 2024 and year-to-date 2025 has been mainly driven by official sector investment motivated in part by the gradual disintegration of the U.S. dollar-based system of international trade and the shakeup of the geopolitical landscape. Official sector demand has been augmented by record Asian and especially Chinese investment buying. These developments have been all but ignored by American and European retail and institutional investors captivated instead by overvalued technology and artificial intelligence (AI) stocks. We believe investor exposure to gold, by several measures, is at historic lows.
As capital flees overvalued assets, gold’s scarcity and safe-haven appeal could drive its price higher.
The essence of a bear market1 is overvaluation and incorrect positioning. The shift in psychology that results from bear market losses may lead to a search for investment alternatives. We believe safe-haven assets, including gold, will capture resulting capital flows.
Gold’s capacity to absorb new inflows is limited by its tiny “float”2 relative to the scale of financial markets denominated in U.S. dollars. Gold-backed exchange traded funds (ETFs) are likely recipients of the shift in capital flows we anticipate. Expanded flows into most gold ETFs must be accommodated by the purchase of physical metal. The migration of capital to gold and possibly other monetary metals could result in a price that is multiples of the current price of $3,000 per ounce.
We believe gold mining equities remain significantly undervalued and stand to benefit from further advances in metal prices. Mining profitability is leveraged to changes in gold prices, which move more quickly than costs. Therefore, in our view, mining shares offer significant torque potential relative to physical gold.
The Equity Bear Market is Not Caused by Tariffs Alone
Even as the Trump administration walks back its stance on tariffs, the contraction in equity market valuations likely has further to run. On April 6, 2025, veteran market analyst and technician Stan Weinstein stated:
“While many traders and investors incorrectly think that this devastating selloff is simply the result of ‘the tariffs,’ as we showed you in detail in last weekend’s update, ‘termites’ have been at work, weakening the market’s technical structure, for the past few months, even as several of the indexes (such as the S&P 500 Index3) were making new highs (and this was being ‘camouflaged’ by the narrow strength of the ‘Magnificent 7,’4 just as was the case in late 1999-early 2000, before the internet bubble ‘popped,’ and in 1973 when the ‘Nifty Fifty’ 5 of that era was ‘all the rage’ – but, in each and every case, the Advance-Decline Line6 had topped out well before the market reached those respective peaks). So what is really happening is that the upsetting fundamental ‘news’ is colliding with an already-weakened technical structure that was getting ready to collapse (so it most definitely couldn’t handle the added ‘worries’) – and, very simply, that ‘perfect storm’ combination has resulted in this ‘crash’!"
Market strategist Michael Belkin, who has correctly called major turning points in the stock market over many decades, noted in his report on March 24, 2025, that the fuel for a market decline could be seen in the record level of margin debt.
“The January margin debt level was $937 billion, equal to the Oct 2021 peak of $936 billion…. Margin debt is a great indication of animal spirits… It’s not what people think about the market (like the AAII Individual Investor Sentiment Index), it’s a measure of how much stock market risk they are willing to take on with leverage.”
You can access more insights from Michael Belkin by listening to our Sprott Radio podcast, The New Sector Rotation.
Carter Worth, a savvy market analyst and eponym of Worth Charting, noted in an April 6, 2025, commentary that the typical stock in the Russell 3000 Index, representing 98% of all investible capital in U.S. equity markets, peaked in October well before “tariffs” was on the tip of everyone's tongue. Roughly 50% of the stocks in that Index are down 35% or more (as of March 31, 2025), giving the lie to Treasury Secretary Bessent’s recent comment that the market carnage was confined mainly to the “Magnificent 7” names. The bear market is pervasive throughout all market sectors based on Worth’s analysis.
In our opinion, the current generation of investors has never experienced a genuine bear market. The notion that a bear market is simply a decline of 20% or more from the trading peak is overly superficial. The bear market of the 1970s was a grinding multi-year affair whose duration was sufficient to suffocate speculative psychology well into the 1980s.
It remains to be seen whether the current bear market will resemble one of the 1970s or of the post-2000 variety, which were mostly ended by Federal Reserve bailouts. History demonstrates that either outcome will be positive for gold.
Gold Positioning by Western Investors is Minimal
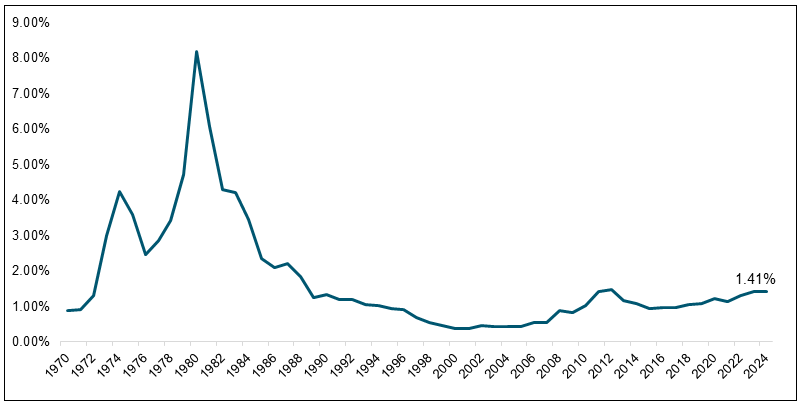
As of year-end 2024, financial advisors recorded the lowest exposure to gold since 2019.
Figure 1: Financial Advisor Allocations to Gold
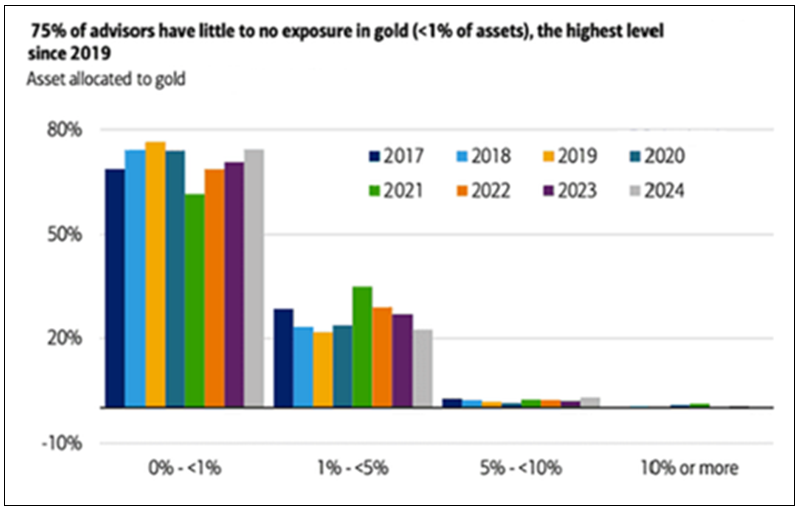
Source: BofA Global Research. Data as of 2/26/2024.
Since 2020, holdings of gold-backed ETFs have declined by 585 metric tonnes, or 17.51% of total assets at year-end 2020. In 2024, holdings rose by 159 tonnes, leaving aggregate AUM by weight nearly 20% below the 2020 peak.
Figure 2: Gold-Backed ETF Holdings Have Declined Since 2019 Peak
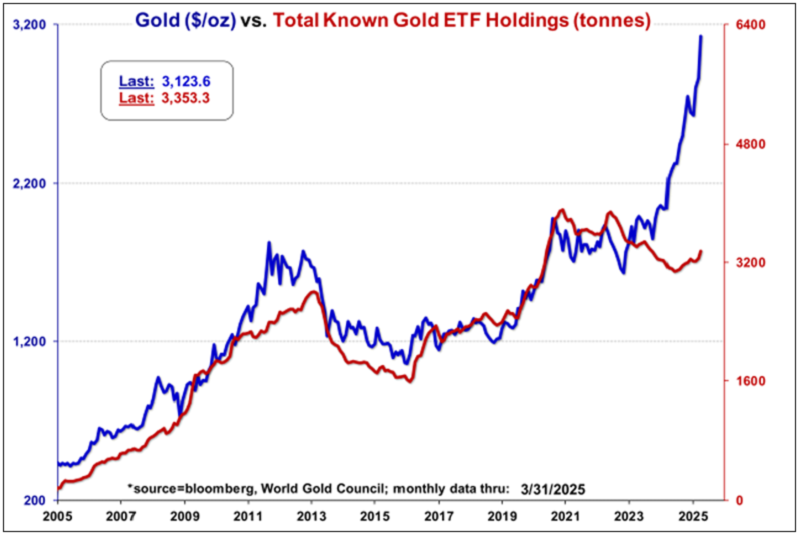
Source: Meridian Macro Research. Data as of 3/31/2025.
Figure 3. Total World Gold ETFs, Change in Total Holdings by Year
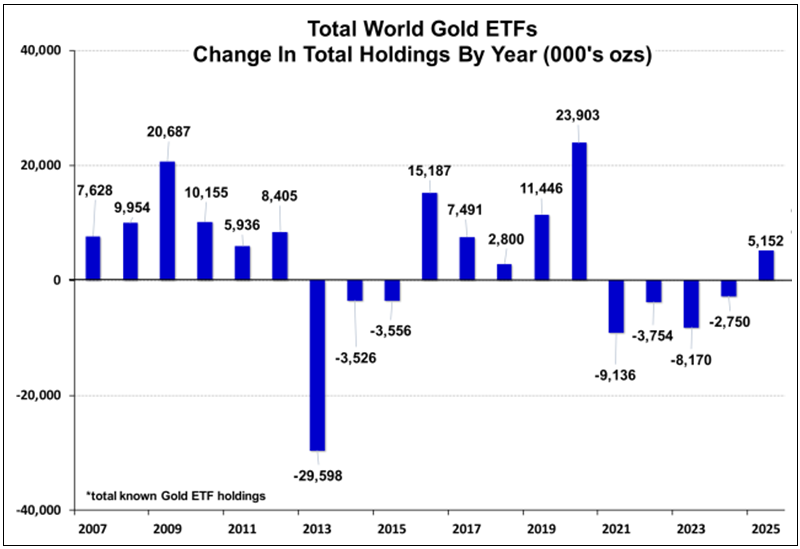
Source: Meridian Macro Research. Data as of 3/31/2025.
Gold is Still Contrarian
Gold, long a Wall Street pariah, has only recently become popular as major investment firms jump on the bandwagon to make gold price forecasts undreamed of only six months ago. Bullion’s newfound popularity may have resulted in a short-term overbought condition, but we believe it has been remedied by the market meltdown.
On Saturday, April 5, 2025, the Financial Times reported that hedge funds had been hit with the largest margin calls since the 2020 COVID crisis. Gold may be temporarily caught up in this “sell everything” scenario. We believe gold’s checkback will prove to be temporary and will serve to correct recent overbought sentiment readings.
A bullish outlook7 for gold is still contrarian. The longer-term consensus forecast among investment firms polled by Bloomberg is for gold prices to decline steeply to $2,100 in 2028 (see Figure 4). We regard this groupthink as a positive sign that strategists see no appeal for metal exposure other than a tactical one beyond the very short term. Another way to put this bearish gold forecast into perspective is the unanimity of bullish calls from leading brokerage firms for the stock market at the beginning of 2025. Example forecasts for the S&P 500 Index include Deutsche Bank (7100), BMO and HSBC (6700), and Goldman Sachs, Morgan Stanley, JP Morgan and Citi (all at 6500).
Figure 4. Consensus Forecasts on Gold Prices to 2028
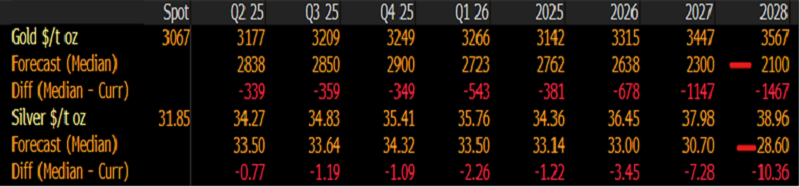
Source: Bloomberg. Data as of March 31, 2025.
With Trump’s detonation of the “pax Americana” liberal world order in place since the end of World War II, “the U.S. dollar becomes a choice, not a necessity, and debt issuance on everything and everywhere — not just by the U.S. Treasury — becomes more risky and expensive” (from "Crashing the Car of Pax Americana Epsilon Theory"). The potential scope for reallocation to gold is suggested by the chart below:
Figure 5. Gold’s Share of Global Equity and Bond Securities
Source: BIS, ICE Benchmark Administration, Metals Focus, Refinitiv GFMS, World Bank, World Federation of Exchanges, World Gold Council.
Gold is Scarce Relative to Financial Assets
Figure 6.
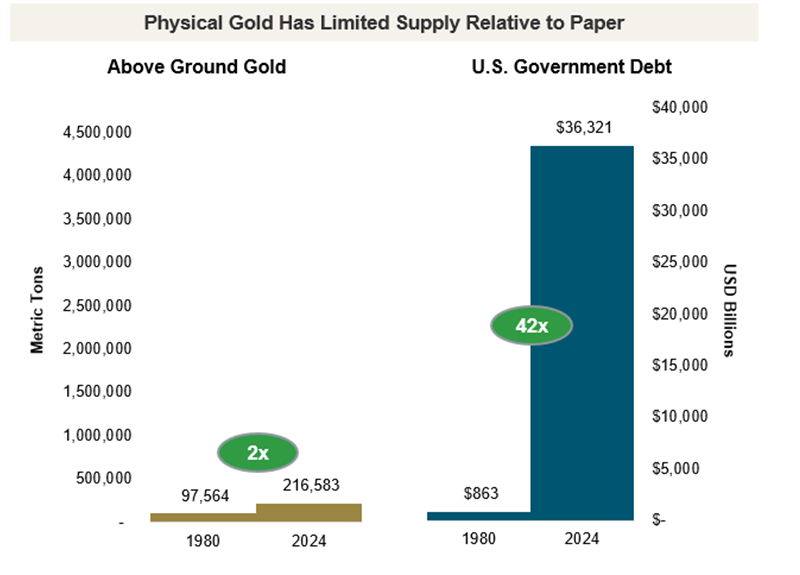
Source: Bloomberg and World Gold Council as of 2024.
The apocryphal tale that every molecule of gold ever mined remains above ground as potential supply (due to recycling, preservation in works of art, high-end jewelry, coins, hoarding and storage as a monetary reserve by central banks) is deeply flawed. As calculated and shown in the gold cube illustration in Figure 7, that quantity is 216,583 metric tonnes, which, for the sake of this exercise, equals $22 trillion at $3,000/oz.
However, only a small fraction of that quantity is potentially in play as “supply”. The gold cube illustration suggests the application of a 72% haircut to arrive at a number for physical gold that could be quasi-tradeable. That would include coins, low-end jewelry (think Middle Eastern souks) and assorted shapes and units not acceptable as good delivery by the London Bullion Market Association (LBMA), Commodity Exchange (COMEX) or Shanghai Gold Exchange (SGE). A tally of metal stored in London, COMEX or Shanghai Gold Exchange inventories results in a tradeable float of approximately $1 trillion.
Figure 7. Estimated Above-Ground Gold Holdings by Demand Categories
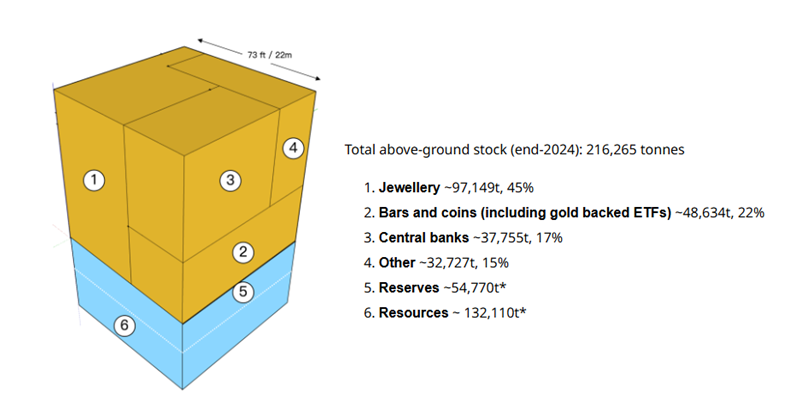
Source: Data as of 2/11/2025. Financial investment includes over-the-counter (OTC) and gold ETFs. World Gold Council, Metals Focus, Refinitiv GFMS.
This exercise leads to three conclusions:
First, the dollar amount of all gold is a small fraction of wealth denominated in U.S. dollars (USD), $100 trillion in global equities and $315 trillion of debt (Source: Institute of International Finance) as of year-end 2024. A small reallocation from liquid financial assets into gold, most easily accessed via gold-backed ETFs, could significantly increase the USD gold price.
Second, the recent scramble to relocate physical gold from London to New York ahead of tariffs illustrated the stark illiquidity of even the tradeable gold float. Following Trump’s victory, COMEX inventories rose 2.6x from approximately 17,000 to 40,000 ounces within a few months. The premium of New York versus London gold prices rose as high as $45 (1.5%) during that period as bullion banks and their clients hurried to withdraw London 400 ounce gold bars to be refined into 100 ounce COMEX good delivery, hardly the indication of a liquid market.
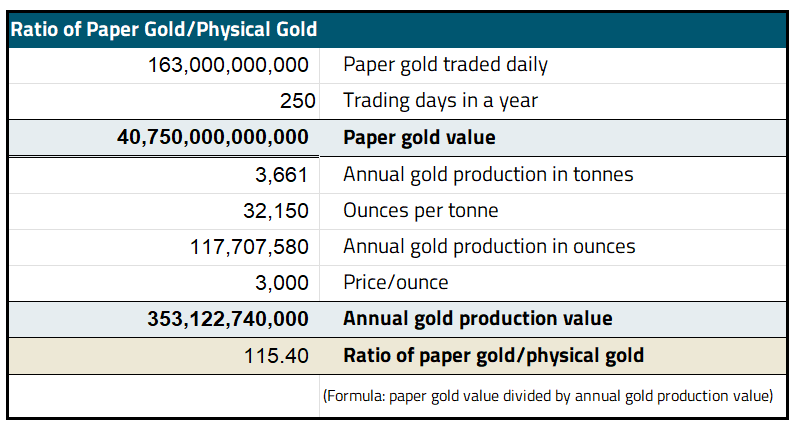
Third, the highly liquid paper gold trade rests on a shaky foundation, best imagined by John Exter, as an inverted pyramid (see Figure 8). Paper gold includes all contracts traded between bullion banks and their clients in the form of swaps, options, futures and other derivatives. According to the LBMA, the daily trading volume of gold in 2024 was 33 million ounces or $80 billion compared to annual gold production of 120,000,000 ounces or $324 billion (2024 prices).
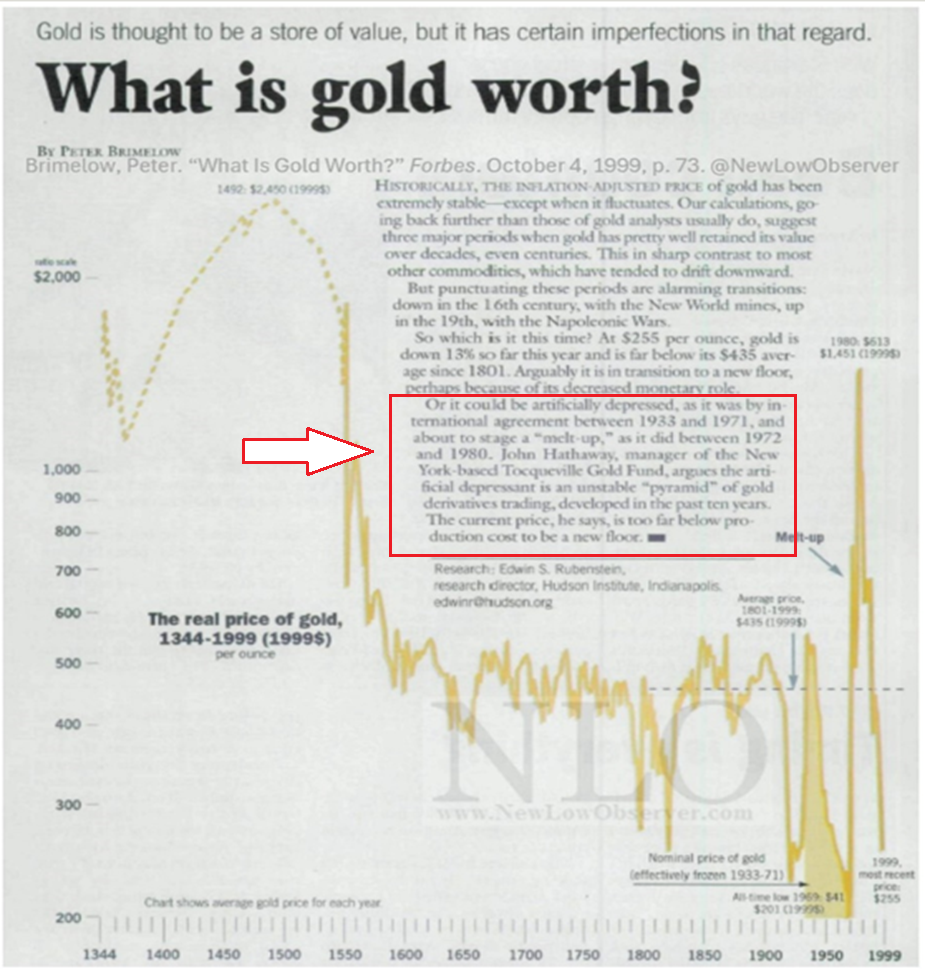
We reckon that the ratio of paper to physical trading is approximately 115 to 1 (based on LBMA and COMEX futures; see Figure 9). It is unclear, but unlikely, that the opaque LBMA market statistics include unreported over-the-counter derivative trades. The tariff scare illustrates the fragility of arrangements underlying the paper gold trade. In our opinion, the extension of credit among bullion banks and their clients will be more cautious following this episode. Our long-held belief (almost 30 years, as shown by my 1999 quote in the Appendix) is that any diminution of the paper gold trade will lead to improved price discovery for physical metal.
Figure 8. Exter's Pyramid in the 21st Century
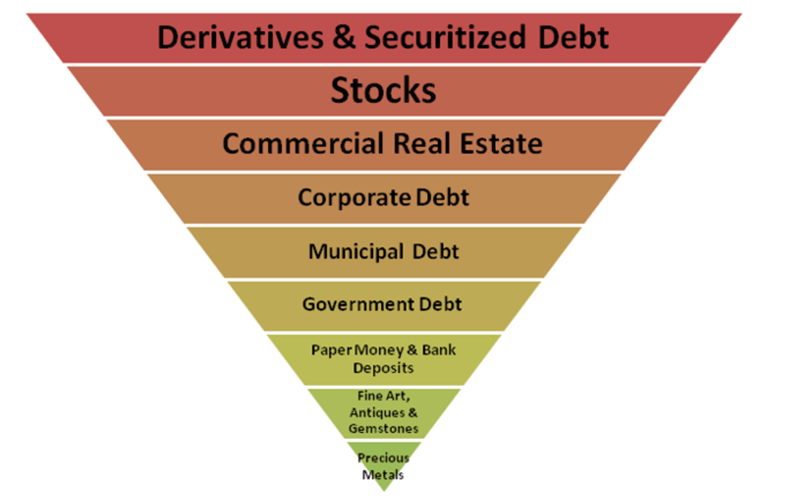
Source: Antiquesage.com.
Figure 9.
Source: LMBA, COMEX and the World Gold Council.
Gold Miners: Potential for a Huge Catch-Up Ahead?
During Q1 2025, gold stocks (using GDX8 as a proxy) outperformed gold bullion with a gain of 35.56% compared to 19.02% for the metal. For many years, miners have underperformed the metal:
Figure 10. Gold Miners Offering Deep Value versus Gold Bullion
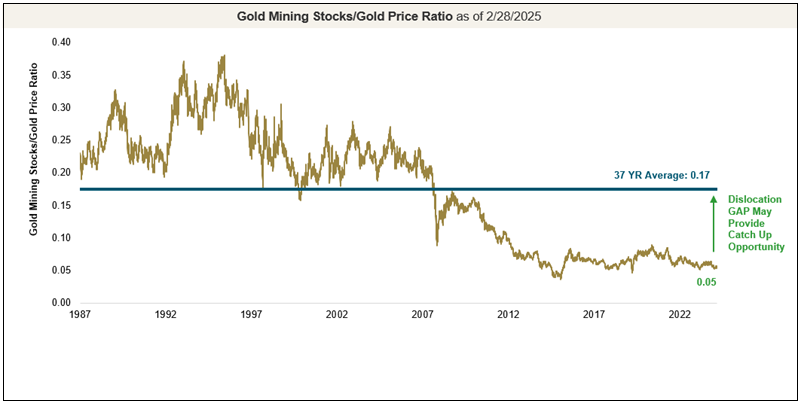
Source: Bloomberg as of 2/28/2025 (reflects past 37 years). Gold is measured by the GOLDS Comdty Spot Price and gold equities by the Philadelphia (PHLX) Stock Exchange Gold and Silver Sector Index (XAU). The Philadelphia (PHLX) Stock Exchange Gold and Silver Index (XAU) is used versus the Philadelphia (PHLX) Stock Exchange Gold and Silver Sector Total Return Index (XXAU) for its longer historical track record. You cannot invest directly in an index.
However, value investors and stock pickers, please take note: it would be ill-advised to take a jaundiced view of each and every gold stock. There are many success stories within the sector. A better perspective can be seen from the wide dispersion of returns:
Figure 11. Gold Miners: A Dispersion of Returns
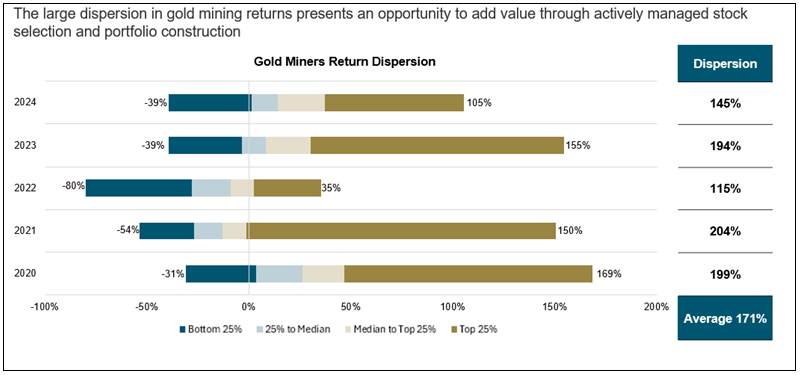
Source: Bloomberg and FactSet as of 12/31/2024. Gold Miners (GDM) represents the NYSE Arca Gold Miners Index (GDMNTR INDEX) and the constituents of GDX US Equity, which tracks the GDMNTR Index. You cannot invest directly in an index.
While not universal, we see growing evidence of intelligent deployment of capital, resistance to the siren call of investment bankers that “bigger is better” and recognition of the need to return capital to shareholders during this period of prosperity for the industry. More enlightened management teams are beginning to think in terms of returns on invested capital (see Figure 12), accountability in terms of per-share metrics and judicious deal making.
Figure 12. Gold Mining Companies Returns to Shareholders, Ex Big 3 (US$M)
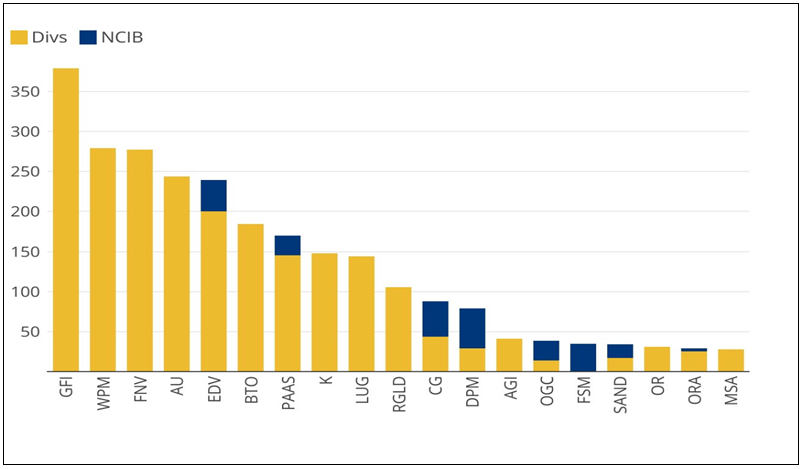
Source: Mining Journal. Data as of 12/31/2024. “Ex Big 3” refers to Newmont, Barrick Gold and Agnico Eagle Mines. A Normal Course Issuer Bid (NCIB), also known as a stock repurchase program, is a company's plan to buy back its own outstanding shares from the market, usually over an extended period, and is subject to regulatory approval.
While many investors trade mining stocks according to every twitch and jiggle in the daily price, we believe a better guide is the average gold price received on a quarterly basis.
Figure 13. Average Gold Price (2023-2025)
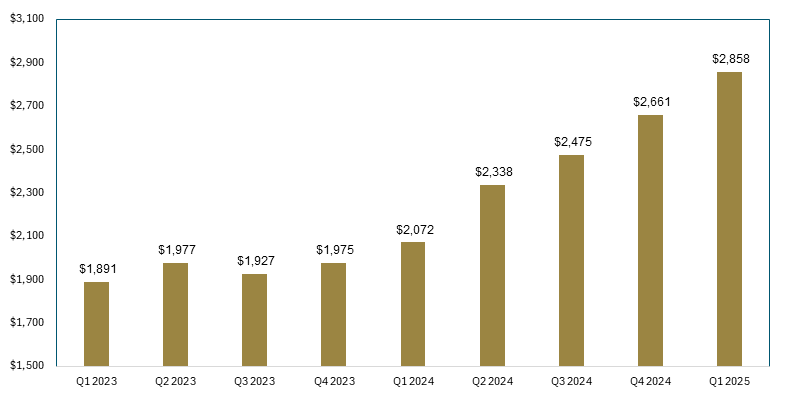
Source: Bloomberg. Data as of March 31, 2025.
And for die-hard value investors, as we are, it is hard to find a more enticing sector in terms of EV/EBITDA9. What is especially appealing is that mining fundamentals, the main component of which is future gold prices, have fared relatively well in periods of recession and inflation.
Figure 14: Gold Miners Appear Undervalued Based on EV/EBITDA (2019-2025)
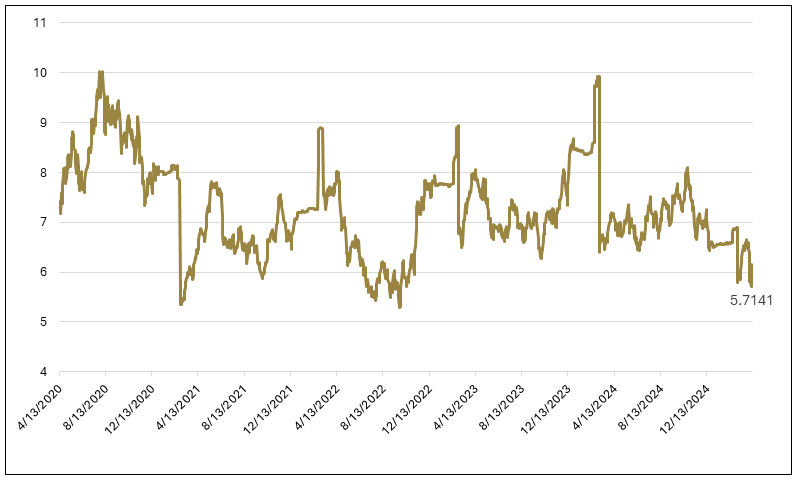
Source: Bloomberg. Data as of March 31, 2025.
Trend Acceleration Ahead?
We concluded our 2024 commentary with the same heading as above. We hypothesized that the catalysts for a step change in the advance of gold prices would be: “a bear market; a steep, lengthy retreat in cryptocurrencies; bond market disruption with interest rate risk morphing into credit risk; and unwanted, persistent U.S. dollar strength that threatens economic instability.”
We are batting about 75% on those calls. The retreat in cryptocurrencies has been steep, but it is too early to call it lengthy. Treasuries have thus far failed to serve as a safe haven and credit risk seems to be furiously springing leaks. The U.S. dollar has weakened instead of strengthening as a corollary of the “Trump trade” that we envisioned. However, an entrenched bear market and spreading credit risk are enough, in our opinion, to drive the gold price substantially higher. Mining stocks, especially those well-managed and positioned, stand to benefit most from the step change in the rate of gold’s advance that we envision.
From the dustbin.
For illustrative purposes only.
| 1 | A bear market is often characterized by negative investor sentiment, leading to a downward trend in market performance over time. |
| 2 | The gold “float” is the amount of gold readily available for trading in the market. |
| 3 | The S&P 500 Index (Standard & Poor's 500) is a stock market index that tracks the performance of 500 of the largest publicly traded companies in the United States. |
| 4 | The Magnificent 7 refers to a group of seven major tech companies known for their significant stock growth and market influence. |
| 5 | The term Nifty Fifty was an informal designation for a group of roughly fifty large-cap stocks on the New York Stock Exchange during the 1960s and 1970s, known for their consistent earnings, considered solid buy-and-hold growth stocks. |
| 6 | The advance-decline line (A/D line) is a technical indicator used in stock market analysis to measure market breadth. It tracks the difference between the number of stocks that are rising in price (advancing) and the number of stocks that are falling in price (declining) on a given day. |
| 7 | A bull market is characterized by rising prices and investor optimism. |
| 8 | VanEck Gold Miners ETF (GDX®) seeks to replicate as closely as possible, before fees and expenses, the price and yield performance of the NYSE Arca Gold Miners Index (GDMNTR), which is intended to track the overall performance of companies involved in the gold mining industry. |
| 9 | EV/EBITDA, a popular valuation metric, compares a company's enterprise value (EV) to its earnings before interest, taxes, depreciation, and amortization (EBITDA) to assess its value and profitability. |


Investment Risks and Important Disclosure
Relative to other sectors, precious metals and natural resources investments have higher headline risk and are more sensitive to changes in economic data, political or regulatory events, and underlying commodity price fluctuations. Risks related to extraction, storage and liquidity should also be considered.
Gold and precious metals are referred to with terms of art like "store of value," "safe haven" and "safe asset." These terms should not be construed to guarantee any form of investment safety. While “safe” assets like gold, Treasuries, money market funds and cash generally do not carry a high risk of loss relative to other asset classes, any asset may lose value, which may involve the complete loss of invested principal.
Past performance is no guarantee of future results. You cannot invest directly in an index. Investments, commentary and opinions are unique and may not be reflective of any other Sprott entity or affiliate. Forward-looking language should not be construed as predictive. While third-party sources are believed to be reliable, Sprott makes no guarantee as to their accuracy or timeliness. This information does not constitute an offer or solicitation and may not be relied upon or considered to be the rendering of tax, legal, accounting or professional advice.