A Special Note from Paul Wong: This report was written before Liberation Day (April 2, 2025) and the roll out of Trump's sweeping global tariffs. Although gold may experience volatility in the short term, we believe that what we have written is likely now more accurate than before April 2.
Key Takeaways
- Gold’s record-breaking rally in Q1 2025 reflects mounting investor anxiety over stagflation, policy volatility and a fraying global economic order.
- Persistent tariffs and policy unpredictability have elevated the risk of stagflation, fueling demand for gold as the lone liquid safe-haven asset.
- The rumored “Mar-a-Lago Accord” has intensified fears about U.S. credibility and dollar stability, contributing to gold’s ascent and raising broader concerns about global financial trust.
- In 2025, gold is evolving from a cyclical inflation hedge to a structural allocation as global investors respond to institutional instability and geopolitical realignment.
- Silver is nearing a potential breakout, with rising lease rates, plunging London Bullion Market Association (LBMA) inventories and robust industrial demand signaling a tightening market and strong upside potential.
Performance as of March 31, 2025
| Indicator | 3/31/2025 | 12/31/2024 | Change | QTD % Chg | YTD % Chg | Analysis |
| Gold Bullion1 | $3,123.57 |
$2,624.50 |
$499.07 |
19.02% | 19.02% | Gold new ATH clearing $3,100 easily |
| Silver Bullion2 | $34.09 |
$28.90 | $5.18 |
17.94% | 17.94% | Silver needs to be >$35 for breakout |
| NYSE Arca Gold Miners (GDM)3 | 1,288.51 |
956.60 |
331.91 |
34.70% |
34.70% |
Gold miners surpass 2000 highs |
| Bloomberg Comdty (BCOM Index)4 | 106.40 | 98.76 | 7.64 | 7.74% | 7.74% | Commodities (hard asset) outperforming |
| DXY US Dollar Index5 | 104.21 | 108.49 | (4.28) | (3.94)% | (3.94)% | DXY is not behaving as a safe haven |
| S&P 500 Index6 | 5,611.85 | 5,881.63 | (269.78) | (4.59%) | (4.59%) | One of the quickest market selloffs ever |
| U.S. Treasury Index | $2,357.12 | $2,290.24 | $66.88 | 2.92% | 2.92% | Bond rally on recession/growth fears |
| U.S. Treasury 10 YR Yield* | 4.21% | 4.57% | (0.36)% | (0.36)% | (0.36)% | Sitting on 4.20% support |
| U.S. Treasury 10 YR Real Yield* | 1.83% | 2.23% | (0.39)% | (0.39)% | (0.39)% | Reals along with term premium sticky |
| Silver ETFs** (Total Known Holdings ETSITOTL Index Bloomberg) | 719.87 | 716.19 | 3.68 | 0.51% | 0.51% | Silver holdings are building a base |
| Gold ETFs** (Total Known Holdings ETFGTOTL Index Bloomberg) | 87.92 | 82.85 | 5.07 | 6.12% | 6.12% | Retail gold buying is turning higher |
Source: Bloomberg and Sprott Asset Management LP. Data as of March 31, 2025.
*QTD % Chg and YTD % Chg for this Index are calculated as the difference between the quarter end's yield and the previous period end's yield, instead of the percentage change. BPS stands for basis points. **ETF holdings are measured by Bloomberg Indices; the ETFGTOTL is the Bloomberg Total Known ETF Holdings of Gold Index; the ETSITOTL is the Bloomberg Total Known ETF Holdings of Silver Index.
Market Review
For the quarter ending March 31, spot gold soared $499.07/oz (or +19.02%) to close at $3,123.57, decisively clearing the psychological $3,000 level and hitting an all-time high. Since the start of the year, gold has been climbing steadily with only minor, very short-lived pullbacks. The torrent of macro headlines and developments — coupled with a notable non-performance of traditional safe-haven assets such as the U.S. dollar and U.S. Treasuries — has led gold to emerge as the lone liquid safe-haven asset.
The year began with broad market optimism. Investors had high expectations that the second Trump administration's market-friendly policies (tax cuts, deregulation, stimulative fiscal policy) would more than offset the negatives (namely, tariffs). Furthermore, many believed the exceptionally high proposed tariff levels were simply a negotiation tactic.
However, on February 1, the first of many large-scale tariff announcements began — massive 25% across-the-board tariffs on all goods from Mexico and Canada, and 10% on China, only to be delayed a few days later. A series of on/off tariff announcements followed in the ensuing weeks. The resulting uncertainty has begun to slow business investments, and the higher prices from tariffs (essentially, a consumption tax) have seen consumer inflation expectations soar to 30-year highs. Government cuts by the Department of Government Efficiency (DOGE) have further crushed consumer sentiment. Domestically, the damage is becoming increasingly evident in the market price action, and the worrisome economic data appears set to worsen. In short, a stagflationary impulse has begun to take hold in the US.
Globally, the rapid and sizable tariffs imposed by the U.S. — 25% on steel, aluminum and automobiles — are part of a larger pattern of unilateral moves rattling global trade partnerships and upending decades-long international agreements. The post-WWII U.S.-led global order is quickly disappearing, along with the credibility that anchored U.S. foreign and economic policy. With the dissolution of the long-standing Western defense framework, geopolitical risk is becoming untethered, while global military defense spending is soaring.
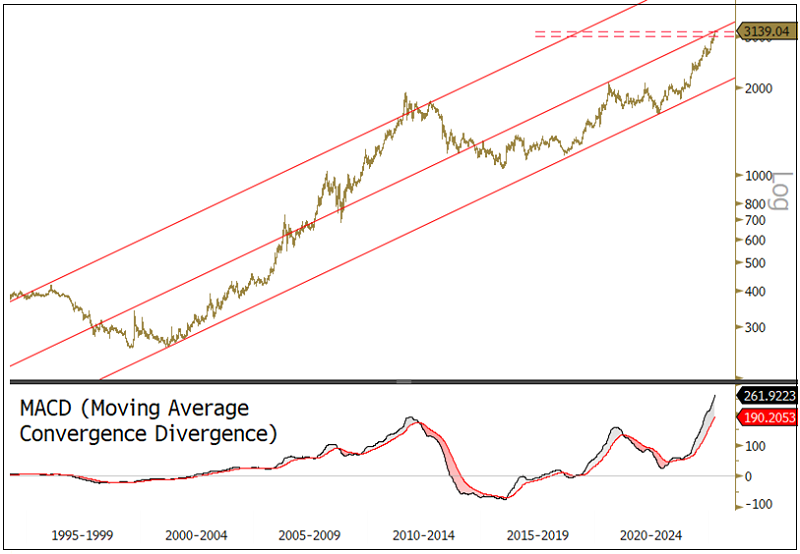
Notably, the price action on gold, driven primarily by central banks and sovereigns rather than investment funds, signals far greater concerns than tariff-related economic weakness. In Figure 1, we highlight the gold bullion chart sub-divided into two distinct bullish channels. Should gold surpass the $3200 level, we believe it could begin trading into the upper, more bullish channel, with price behavior evolving accordingly.
Figure 1. Gold Bullion Prices (1999-2025)
Source: Bloomberg. Data as of 3/31/2025. Past performance is no guarantee of future results.
Part 1: Stagflation, Gold Hedge Against Slowing Growth and Rising Prices
Fears of stagflation — where inflation remains elevated even as economic growth sputters — are rising. Investors are seeking reliable hedges in the face of volatile trade policy, shifting central bank dynamics and consumer pessimism. Amid these concerns, gold is soaring as a store of value and portfolio diversifier.
1. The Stagflation Backdrop
Aggressive tariffs on everything from metals to automobiles to food are fueling rising consumer prices, while large-scale public-sector layoffs and unpredictable policy pivots undermine GDP growth. In previous economic cycles, such as the 1970s, sustained inflation and slower growth created ideal conditions for gold to surge, as it served as a hedge against both currency weakness and deteriorating economic fundamentals.
2. Are Tariffs Inflationary or Recessionary?
Some argue that tariffs are not “truly inflationary,” characterizing them as a one-time price increase. The term “transitory” has even been bandied about. However, in Figures 2a and 2b, we illustrate how tariffs can push prices upward in multiple, interlocking ways well beyond the immediate “consumption tax” effect of cost pass-through to consumers. It is easy to see how retaliatory tariffs, supply chain disruptions, higher input costs and reduced competition can interact in a feedback loop, amplifying inflationary impulses.
Figure 2a. How Tariffs Raise Inflation
| Mechanism | Explanation |
| Supply chain Disruptions | Sudden or unpredictable tariff hikes force businesses to scramble for new suppliers or shipping routes, inflating logistical and production costs that are passed to consumers. |
| Input cost escalation for domestic producers | With higher tariffs on key materials, domestic manufacturers see costs jump; switching to local sources often means fewer supplier choices and higher prices. |
| Reduced competitive pressure | Limiting cheaper imports gives domestic producers room to raise prices, as there is less foreign competition. Over time, diminished competitive forces can fuel wider inflationary pressures. |
| Retaliatory tariffs abroad | Other countries often impose counter-tariffs, escalating supply-chain costs for companies dependent on global inputs. These added expenses ultimately filter down to consumers, further driving up prices. |
| Investor & currency turbulence | Tariff battles unsettle currency markets; a weakened domestic currency makes imported goods pricier. Exchange-rate volatility can magnify inflationary pressures beyond just the direct effect of the tariffs themselves. |
| Long-term structural shifts | Persistent tariffs prompt firms to relocate production or reorganize supply chains in ways that may be less cost-effective, eroding economies of scale. Over time, these structural inefficiencies push operating costs — and eventually prices — permanently higher. |
Source: Sprott Asset Management.
The same logic applies to slowing growth. Retaliatory trade barriers, reductions in investments, declining consumer spending and lower corporate profits can easily spiral into a regressive, self-defeating cycle. Given the size and scope of the tariffs likely to come, the outcome may be recession, inflation—or worse, both. Indeed, the bond market appears to be pricing in stagflation as the most probable scenario.
Figure 2b. How Tariffs Slow Growth
| Mechanism | Explanation |
| Reduced export competitiveness | Sudden or unpredictable tariff hikes force businesses to scramble for new suppliers or shipping routes, inflating logistical and production costs that are passed to consumers. |
| Retaliatory actions stifle overall trade | With higher tariffs on key materials, domestic manufacturers see costs jump; switching to local sources often means fewer supplier choices and higher prices. |
| Business uncertainty & delayed investment | Limiting cheaper imports gives domestic producers room to raise prices, as there is less foreign competition. Over time, diminished competitive forces can fuel wider inflationary pressures. |
| Supply chain restructuring | Other countries often impose counter-tariffs, escalating supply-chain costs for companies dependent on global inputs. These added expenses ultimately filter down to consumers, further driving up prices. |
| Margin pressure & reduced hiring | Tariff battles unsettle currency markets; a weakened domestic currency makes imported goods pricier. Exchange-rate volatility can magnify inflationary pressures beyond just the direct effect of the tariffs themselves. |
| Reduced consumer spending | Persistent tariffs prompt firms to relocate production or reorganize supply chains in ways that may be less cost-effective, eroding economies of scale. Over time, these structural inefficiencies push operating costs — and eventually prices — permanently higher. |
| Deteriorating business climate & foreign investment | Protectionist policies can repel foreign investors who are wary of new barriers and heightened risk. Lower Foreign Direct Investment (FDI) can mean reduced job creation and weakened innovation over the long term. |
| Potential currency volatility | Trade tensions can rattle currency markets, potentially weakening the domestic currency. While a weaker currency may help some exporters, it raises import costs and saps consumer purchasing power — further weighing on growth. |
Source: Sprott Asset Management.
3. Stagflation Risks Becoming Embedded
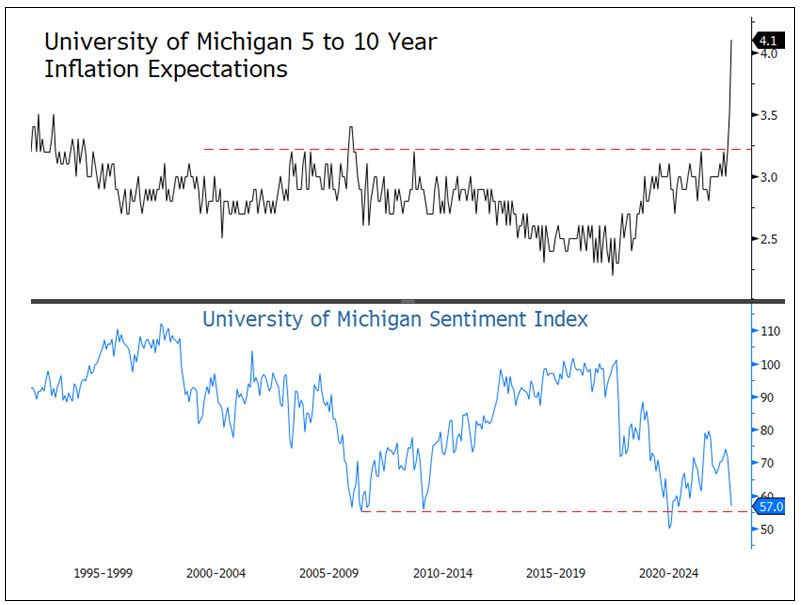
As measured by the Conference Board and the University of Michigan, consumer sentiment is plunging to multi-decade lows, while long-term inflation expectations are rising in an alarming manner. Historically, these measures correlate with a flight to safe-haven assets, especially gold. Long-term inflation expectations are also becoming unmoored as the U of Michigan’s 5- to 10-year inflation outlook has recently surged to 4.1%. In Figure 3, we highlight the stagflationary impulse. If these readings stay elevated for any extended period, consumer expectations will quickly turn into consumer actions, embedding stagflation into the broader consumer psychology.
Figure 3. Bad Stagflationary Vibes (1995-2025)
Source: Bloomberg. Data as of 3/31/2025.
Part 2: The Mar-a-Lago Accord and the Rule of Law
The rule of law is paramount from a market perspective — particularly regarding U.S. Treasuries and the U.S. dollar. It forms the foundational bedrock of both the U.S. Treasury market and the dollar reserve system. The phrase “the full faith and credit of the United States Government” represents an unconditional commitment to uphold the interest and principal on U.S. debt, ensuring payment under virtually all economic conditions. Unless a future Administration decides otherwise, multiple legal frameworks and regulatory bodies enforce this guarantee. With these points in mind, let us turn to the rumored “Mar-a-Lago Accord.”
What Is the Mar-a-Lago Accord?
The Mar-a-Lago Accord is a rumored proposal designed to restructure the global trading system and address the U.S. trade deficit by deliberately weakening the U.S. dollar. It reportedly contains the following key elements:
- Debt Restructuring: Foreign holders of U.S. Treasury bonds would be compelled or incentivized to exchange their current holdings for 100-year, zero-coupon bonds, ostensibly in return for tariff relief or military protection. The immediate effect would be a reduction in interest payments on U.S. federal debt, which currently exceeds the defense budget.
- Weaker Dollar: By devaluing the dollar, the plan aims to reduce borrowing costs and stimulate investment in U.S. manufacturing. A weaker dollar is viewed as critical to supporting tariff and trade policies.
- Global Economic Reordering: The proposal seeks to align major U.S. trading partners and creditors in jointly weakening the dollar while preserving its status as the world’s primary reserve currency.
A Closer Look at Each Element
1. Debt Restructuring
Who would voluntarily hold a zero-coupon, century-long bond? According to rumors, these bonds may not be readily marketable but would instead involve a swap arrangement with the Federal Reserve. For sovereign central banks, such bonds would pose significant interest-rate and inflation risks, offer no liquidity and pay no interest. Some speculate these bonds could be partially backed by physical gold, though many central banks already prefer to buy gold directly. By comparison, Austria’s 95-year bond with a 0.85% coupon has seen a drawdown of around 75% and exhibits high volatility, illustrating the potential pitfalls of extremely long-dated sovereign debt.
If the U.S. government forces a debt swap or changes the terms of its obligations, it would likely be viewed as a selective default. How might credit rating agencies react? If creditors refuse to exchange their current holdings for zero-coupon century bonds, would they face higher tariffs or decreased military support?
2. Weaker Dollar
In practice, engineering a weaker dollar would prompt investors to shift toward gold and other tangible assets while reducing dollar-denominated holdings. It would also raise critical questions about the Eurodollar market (i.e., U.S. dollars in circulation held outside the United States). Higher risks of dollar-funding stress could escalate the risk of a global financial crisis.
3. Global Economic Reordering
Why would any nation continue to trust or work with the U.S. government after it has been unilaterally subjected to tariffs, coercion, or other punitive measures? The Bretton Woods and Plaza Accords succeeded because participating countries recognized the mutual benefits of working with the U.S. If the rule of law is no longer considered secure, the prospects of establishing a new global arrangement are slim. Instead, the situation could devolve into a range of severe adverse outcomes. In short, this is playing with fire.
Implications for the Market
Reports of the Mar-a-Lago Accord have likely contributed to the recent upward trend in gold prices. Meanwhile, the European Union plans to issue roughly $1 trillion in new bonds for military and infrastructure spending over the next few years, which will create significant competition for U.S. Treasuries. In such an environment, why would investors choose to buy U.S. debt of any maturity if they fear an imminent restructuring?
Central banks and sovereign investors, rather than traditional investment funds, have been driving recent gold demand. Their objectives differ from those of typical investors, and they often have little choice but to diversify away from the U.S. dollar. Holdings of dollar reserves already constitute about 60% of global reserves. Angering the U.S. raises the retribution risk of foreign exchange seizures, a further reason for many to look elsewhere. The EU (at roughly 20% of global reserves) is set to issue vast volumes of new debt, while Japan’s share is only around 4%. Gold, which comprises about 23% of global reserves, remains a liquid, non-political and time-tested store of value.
Part 3. Gold in 2025: A Crisis of Trust Drives Gold Demand
As of the first quarter of 2025, gold is the best-performing major asset class in 2025. While headlines often point to traditional drivers like inflation hedging, geopolitical risk, or central bank buying, the real story behind gold's surge this year may run deeper: investors may be hedging against something more fundamentally structural — the unraveling of trust in the U.S.-led global financial system.
From Safe Haven to Structural Hedge
In 2025, the market narrative around gold shifted from cyclical hedge to structural allocation. This pivot is being driven by the breakdown in confidence across three key dimensions:
- Erosion of U.S. Credibility Abroad:
The second Trump administration has taken a combative stance toward its traditional allies, international institutions and long-standing security agreements. The abandonment of Ukraine, threats to NATO and sudden imposition of auto tariffs on trading partner countries like Canada, Mexico, Japan, Germany and South Korea have caused foreign partners to rethink their exposure to U.S. policy unpredictability. In addition, the risk related to the highly rumored “Mar-a-Lago Accord” hangs in the background. - Weaponization of the Dollar and Swap Line Risk:
Perhaps most alarming to global investors is the possibility, previously unthinkable, that the U.S. could politicize the Federal Reserve’s dollar swap7 lines. These emergency liquidity lifelines are essential to global dollar funding in times of crisis. Recent discussions within the European Central Bank (ECB) and reports from Reuters suggest that this scenario, while still a tail risk, is now being seriously considered by foreign central bankers.8 - Dollar Dominance Under Threat:
While most de-dollarization narratives are easy to dismiss, what is happening now is different. It is not autocracies trying to bypass the dollar; America’s closest allies are wondering if they can still rely on it. If the U.S. cuts off financial lifelines, undermines the rule of law and politicizes monetary policy, central bank reserve managers and sovereign wealth funds may begin reducing their exposure not out of ideology but self-preservation, a much more potent driver.
U.S. Institutional Integrity in Question
Investors, however, are not just watching trade policy. The integrity of American institutions, especially those critical to financial stability, is also being called into question. Trump’s attacks on the judiciary, threats to replace Fed Chair Jerome Powell with a loyalist and politicization of federal law enforcement have raised alarms about the future independence of the Federal Reserve and the credibility of U.S. fiscal and monetary policy. Already this year, direct defiance of federal court orders has legal experts and economists openly discussing the risk of a constitutional crisis. In this environment — for institutional and retail investors — gold looks increasingly attractive as a politically neutral, stateless asset.
So far this year, the U.S. dollar has weakened even as U.S. tariffs on global imports have climbed from under 2% to roughly 10%, with expectations for further increases. Compounding this unusual move, real yields have also been rising. This rare divergence is likely a warning sign. The Bloomberg Dollar Spot Index is on pace for its worst Q1 in seven years. Foreign exchange markets, traditionally slow to price in structural political risks, may be starting to reflect concerns about America’s direction.
Investment Implications
If the current U.S. administration continues to undermine the legal foundations of the American system, antagonize allies and politicize key economic institutions, the structural bid for gold is likely to intensify. Continued dollar weakness, further geopolitical escalation, or an outright crisis of confidence in U.S. governance could propel gold well beyond recent highs. In this environment, gold should be considered not just a tactical hedge but a core allocation for investors seeking insulation from geopolitical and institutional volatility.
The relentless rise in gold prices in 2025 may be more than a reaction to dizzying headlines; it may represent a referendum on U.S. stewardship of the global financial system. If trust continues to erode, gold may increasingly be viewed not as a hedge against macro instability but as a store of value in a world where the rule of law and reserve currency credibility are no longer taken for granted.
Part 4. Silver On the Cusp of a Major Breakout
For the quarter ending March 31, spot silver soared $5.18/oz (or +17.94%) to close at $34.09, the highest quarter close since 2Q 2011. Like gold, silver has been steadily climbing since the start of the year. Similar to the tariff effects on gold, silver was dislocated from London to Comex to avoid any potential tariffs on silver. Combined with the last several years of structural deficits — driven mainly by the surge in solar panel demand while supply remained flat — there is mounting evidence that silver may be approaching a squeeze higher in prices sooner than expected.
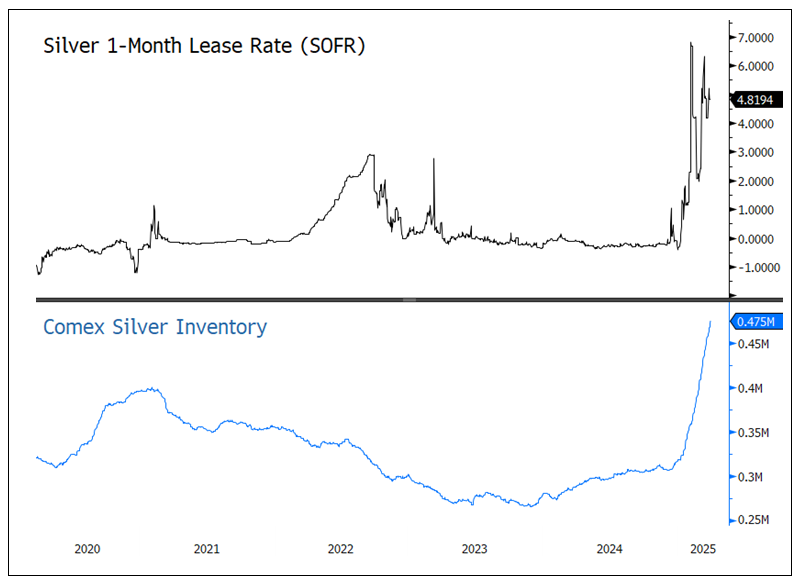
Figure 4 below shows the surge in the 1-month silver lease rate (using Secured Overnight Financing Rate, or SOFR, base), which surged in early January as tariff fears began the arbitrage from London to Comex. The silver lease rates remain elevated at 4.82% (YTD average is 3.18%) and the Comex silver inventory (lower panel) continues to build, reaching an all-time high of 475 million ounces. The incentive to drive silver to Comex remains intact and should provide significant price support.
Figure 4. Silver 1-month Lease Rates and Comex Inventories (2020-2025)
Source: Bloomberg. Data as of 3/31/2025. Past performance is no guarantee of future results.
The LBMA (London Bullion Market Association) silver inventory refers to the total amount of silver stored in LBMA-approved vaults in and around London. This data is published monthly and provides valuable information regarding market transparency of silver physical stock, a measure of liquidity (London is a main trading hub for silver), supply-demand imbalances and investor confidence (inventories provide a measure of how “real metal” is underpinning the silver market). Overall, the LBMA silver inventory is an essential reference point for physical market conditions in silver. Traders, investment managers and market observers use these inventories as one of many data points in analyzing price trends, supply security and overall market health.
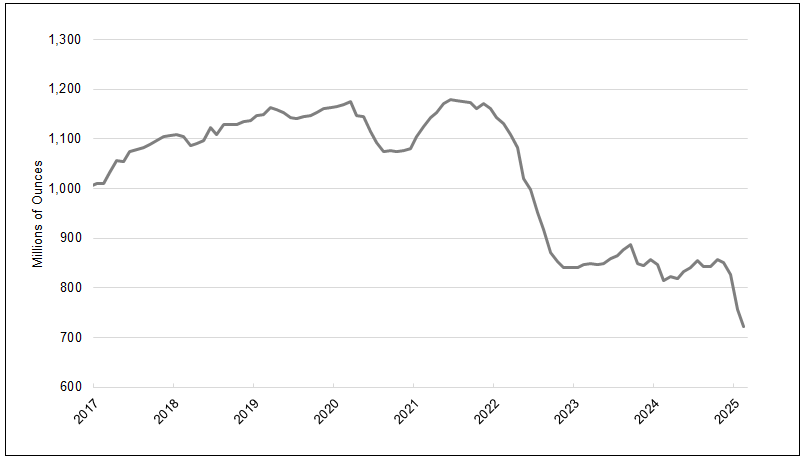
Figure 5 highlights the LBMA silver inventory to February 2025, and there has been a significant drain in inventory levels to the lowest reading of available data. In the first two months of 2025, there was a 105 million ounce draw of silver, the largest two-month withdrawal recorded. Data for March is expected to show a similar trend. Since 2022, there has been a dramatic shrinking of silver inventory, indicating a dramatic tightening in supply-demand fundamentals. The large outflows from the LBMA vaults point to potential upward convex price pressures, as primary silver mine supply has been flat for at least a decade.
Figure 5. LBMA Silver Inventory8 (2017-2026)
Source: LMBA London Vault Data, https://www.lbma.org.uk/prices-and-data/london-vault-data.
As a reminder, the U.S. is a significant industrial consumer of silver, accounting for about 20% of global industrial demand (about half the size of China’s demand). The growth in silver remains via photovoltaics and electronics, and while sentiment has rolled back, actual growth remains robust at multiples of GDP-potential growth rates. The tariff escalations will likely add to the complexity of the silver supply chain, just as LMBA silver inventory is being drawn down rapidly.
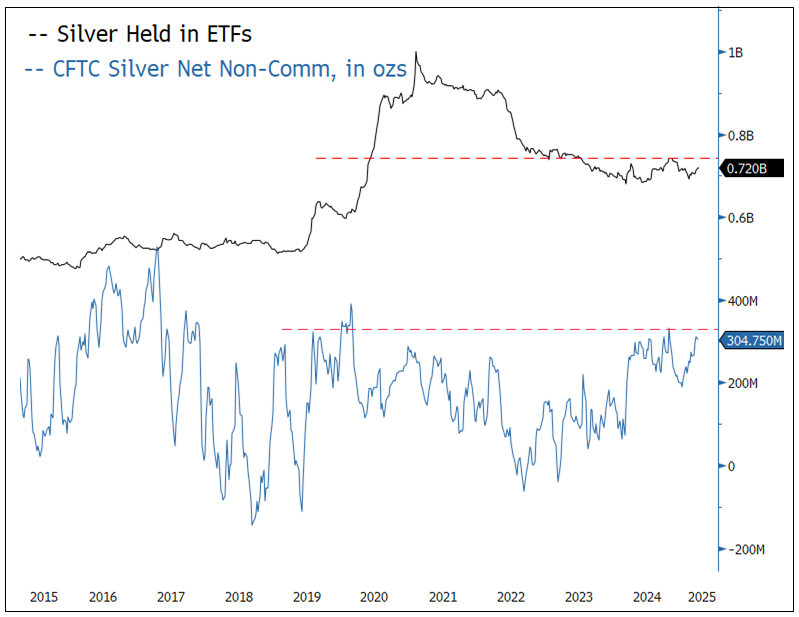
Unlike gold, silver does not have large-scale, price-insensitive central bank and sovereign buying. However, silver is more driven by speculative flows, which history has shown can create its own price dynamics. While there are several sources of silver holdings and buying (CTA, Shanghai, risk parity, various discretionary traders, etc.), the one that stands out is silver held in ETFs (see Figure 6). Currently, there are about 720 million ounces held in ETFs, but a few years ago, that number was well above 900 million ounces, reaching one billion ounces briefly. If silver held in ETFs returns to near the highs, such a move may create a near collapse in the liquidity functioning of the available LMBA silver inventory.
Figure 6. Silver Holdings in ETFs and CFTC (2015-2025)
Source: Bloomberg. Data as of 3/31/2025. Past performance is no guarantee of future results.
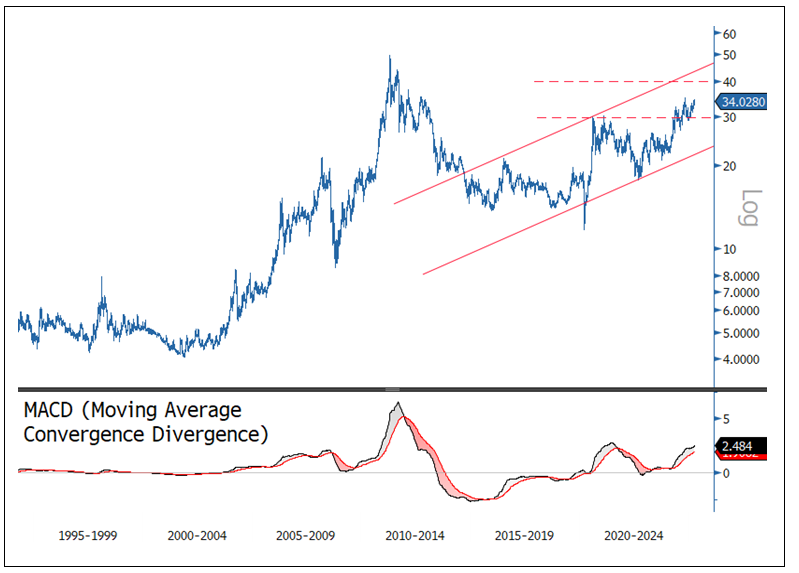
The silver chart (Figure 7) continues to display a very bullish technical pattern. There is a $35 resistance level that projects a quick move to $40/42 as the first target projection. We believe the fundamentals of silver (strong demand, flat supply growth, plunging LBMA silver inventory, low speculative investment levels, etc.) are all pointing to a potential silver price breakout of significant magnitude.
Figure 7. A Bullish Silver Chart (1995-2025)
Source: Bloomberg. Data as of 3/31/2025. Past performance is no guarantee of future results.
Footnotes
| 1 | Gold bullion is measured by the Bloomberg GOLDS Comdty Index. |
| 2 | Silver bullion is measured by Bloomberg Silver (XAG Curncy) U.S. dollar spot rate. |
| 3 | The NYSE Arca Gold Miners Index (GDM) is a rules-based index designed to measure the performance of highly capitalized companies in the Gold Mining industry. |
| 4 | The Bloomberg Commodity Index (BCOM) is a broadly diversified commodity price index distributed by Bloomberg Indices. |
| 5 | The U.S. Dollar Index (USDX, DXY, DX) is an index (or measure) of the value of the United States dollar relative to a basket of foreign currencies, often referred to as a basket of U.S. trade partners' currencies. |
| 6 | The S&P 500 or Standard & Poor's 500 Index is a market-capitalization-weighted index of the 500 largest U.S. publicly traded companies. |
| 7 | Federal Reserve dollar swap lines allow foreign central banks to deliver U.S. dollar funding to institutions in their jurisdictions during times of market stress. |
| 8 | Reuters, “Exclusive: Some European officials weigh if they can rely on Fed for dollars under Trump,” March 24, 2025. |
| 9 | LBMA, London Vault Data, data as of February 2025. |
Investment Risks and Important Disclosure
Relative to other sectors, precious metals and natural resources investments have higher headline risk and are more sensitive to changes in economic data, political or regulatory events, and underlying commodity price fluctuations. Risks related to extraction, storage and liquidity should also be considered.
Gold and precious metals are referred to with terms of art like "store of value," "safe haven" and "safe asset." These terms should not be construed to guarantee any form of investment safety. While “safe” assets like gold, Treasuries, money market funds and cash generally do not carry a high risk of loss relative to other asset classes, any asset may lose value, which may involve the complete loss of invested principal.
Past performance is no guarantee of future results. You cannot invest directly in an index. Investments, commentary and opinions are unique and may not be reflective of any other Sprott entity or affiliate. Forward-looking language should not be construed as predictive. While third-party sources are believed to be reliable, Sprott makes no guarantee as to their accuracy or timeliness. This information does not constitute an offer or solicitation and may not be relied upon or considered to be the rendering of tax, legal, accounting or professional advice.


