June was an extremely difficult month for most asset categories and marked a first half that was one of the worst in decades. Although gold bullion1 lost ground, it remains relatively flat for the year at -1.20% YTD through June 30, 2022, while silver bullion2 has declined 13.00% YTD. Gold mining equities3 were hard hit in June and are down 9.90% YTD. This compares to a YTD decline of 20.58% for the S&P 500 Index6 and the continuation of a historic drawdown for bond markets which have lost 9.14% YTD, as measured by the U.S. Treasury Index.
Month of June 2022
| Indicator | 6/30/2022 | 5/31/2022 | Change | Mo % Chg | YTD % Chg | Analysis |
| Gold Bullion1 | $1,807.27 | $1,837.35 | ($30.08) | (1.64)% | (1.20)% | Holding value in risk asset bear market |
| Silver Bullion2 | $20.28 | $21.55 | ($1.27) | (5.90)% | (13.00)% | At major nine-year support zone |
| Gold Senior Equities (SOLGMCFT Index)3 | 111.15 | 126.24 | (15.09) | (11.95)% | (9.90)% | At major nine-year support zone |
| Gold Equities (GDX)4 | $27.38 | $31.73 | ($4.35) | (13.71)% | (14.52)% | (Same as above) |
| DXY US Dollar Index5 | 104.69 | 101.75 | 2.93 | 2.88% | 9.42% | Highest monthly close since Nov. 2002 |
| S&P 500 Index6 | 3,785.38 | 4,132.15 | (346.77) | (8.39)% | (20.58)% | Worst first half start since 1970 |
| U.S. Treasury Index | $2,271.46 | $2,291.62 | ($20.16) | (0.88)% | (9.14)% | Worst first half start since before 1973 (start of data) |
| U.S. Treasury 10 YR Yield* | 3.01% | 2.84% | 0.17% | 0.17% | 1.50% | Largest six month basis point increase since 1994 |
| U.S. Treasury 10 YR Real Yield* | 0.66% | 0.19% | 0.47% | 0.47% | 1.77% | Largest six month basis point increase in 25 years |
| Silver ETFs (Total Known Holdings ETSITOTL Index Bloomberg) | 850.48 | 885.93 | (35.45) | (4.00)% | (4.02)% | First month of ETF selling this year |
| Gold ETFs (Total Known Holdings ETFGTOTL Index Bloomberg) | 104.35 | 105.18 | (0.83) | (0.79)% | 6.65% | Gold in ETFs steady, activity in CTAs |
Source: Bloomberg and Sprott Asset Management LP. Data as of June 30, 2022.
*Mo % Chg and YTD % Chg for this Index are calculated as the difference between the month end's yield and the previous period end's yield, instead of the percentage change. BPS stands for basis points.
June Review: Toughest Month in Years
Spot gold fell $30.08 (losing 1.64%) to close at $1,807.27 for the month. June concluded one of the worst first half-year returns for most major asset classes. June finally saw the broad commodities index (the last person standing) break sharply lower, losing 10.88% as measured by the Bloomberg Commodity Index (BCOM).7
The June 10 release of the May 2022 Consumer Price Index (CPI) report showed an increase of 8.6% year-over-year, the largest 12-month increase since 1981. The difficult May CPI report catalyzed the latest risk-off selling event, which was the worst decline yet for 2022. The CPI report quickly doused the short-lived peak inflation narrative, forcing investors to consider the impact of a recession and other potential left-tail outcomes (i.e., losses) with an even more aggressive tightening impulse. Throughout 2022, we have seen across-the-board exposure and risk reduction across all investment types, with the month of June accounting for the most dramatic exposure reductions, whether it was strategic fund allocation or VaR (value-at-risk) driven forced allocation.
Gold continues to perform as a safe haven store of value....We believe there is a possible major re-allocation event towards safe haven, capital preservation assets in the second half of 2022.
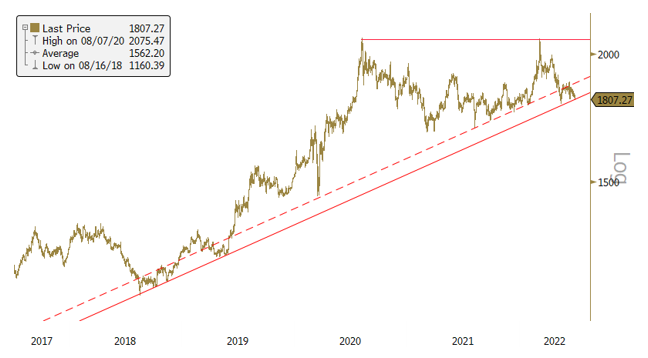
While most asset classes fell hard in June, gold bullion managed to hold relatively well considering the carnage (see summary table above). Figure 1 updates the current gold bullion chart, which maintains the uptrend from the 2018 lows. Examining our gold models, we see that most downside pressure comes from the Federal Reserve's (Fed) impact on interest rates. But gold's other characteristics of currency risk buffer and safe haven asset, along with relatively positive inflows have offset the adverse yield effects and kept gold flat this year. With clear signs of recession risk, the torrid upward momentum in long-term yields may stall further, ameliorating the yield factor's downward pressure on gold bullion.
Figure 1. Gold Bullion Holding Trend (2017-2022)

Source: Bloomberg and Sprott Asset Management. Data as of 7/02/2022. Included for illustrative purposes only. Past performance is no guarantee of future results.
Gold Bullion Continues to Perform as Safe Haven
Thus far, 2022 has been an abysmal year for risk assets as the macro background has proven to be one of the most challenging in decades. As measured by the S&P 500 Index, equities have recorded the worst first-half start to a year since 1970. The U.S. Treasury Index has also registered its worst first six months since before 1973 (based on available data). Speculative assets have fared far worse this year, with 60% to 70% drawdowns being common. By contrast, gold has remained relatively flat year-to-date, down 1.20%.
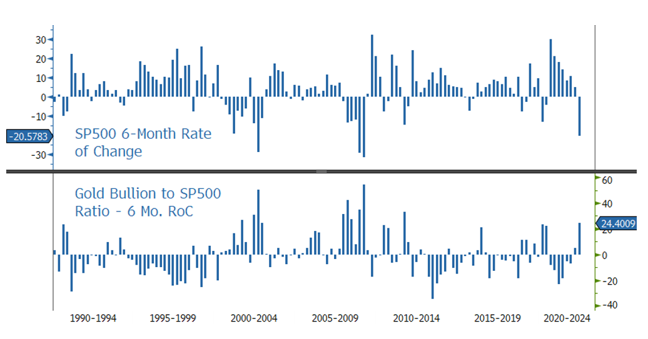
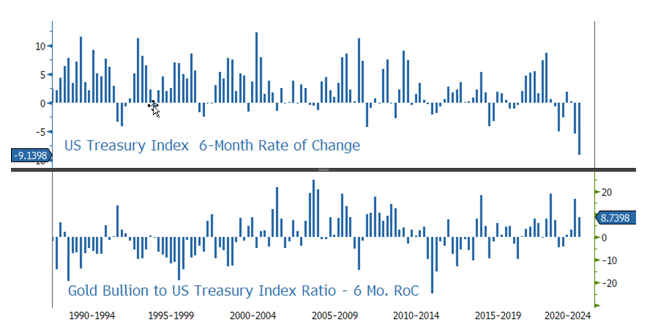
Figure 2 highlights the six-month rate of change for the S&P 500 Index (in the top panel) since 1990. In the lower panel, the gold bullion to S&P 500 ratio shows relative return in the top decile over this period. Visually, the hedge or non-correlation of returns between gold and equities during extended periods of extreme pressure is evident. We repeat the same exercise for U.S. Treasuries in Figure 3. Note that the negative correlation between equity and bond returns pre-2022 has passed, with both bonds and equities recording their worst six-month return periods ever. Gold continues to perform as a safe haven store of value.
Figure 2. S&P 500 and Gold Bullion to S&P 500 Ratio: Six-Month Rate of Change (1990-2024)

Source: Bloomberg and Sprott Asset Management. Data as of 7/03/2022. Included for illustrative purposes only. Past performance is no guarantee of future results.
Figure 3. Gold Bullion to U.S. Treasury Index: Six-Month Rate of Change (1990-2024)

Source: Bloomberg and Sprott Asset Management. Data as of 7/03/2022. Included for illustrative purposes only. Past performance is no guarantee of future results.
Sticky, Stubborn Inflation at a Four Decade High
The May CPI report indicated a reacceleration of inflation and had every major consumer category higher and at an untenable pace for the Fed. In response, the Fed hiked interest rates 75 basis points at its June 14-15 Federal Open Market Committee (FOMC) meeting and is planning additional near-term future rate hikes in the 50 to 75 basis points range. With the Fed prepared to do more, markets sank sharply as recession risks increased. Adding to the inflation outlook was the Atlanta Fed's Wage Growth Tracker8 at 6.1%, an all-time high indicative of wage spiral inflation pressures and its impact on long-term inflation expectations. The Fed continues to be very concerned about long-term inflation expectations building, and has heavily front-loaded rate hikes, pushing the terminal rate higher and aggressively tightening financial conditions. The June sell-off was the markets' read-through that the Fed was far more concerned with embedded inflation expectations than downside risks.
We believe that the Fed cannot quickly address the primary causes of this inflation surge – which has proved far from "transitory". Supply chain challenges are global, and elevated commodity prices are due to supply shocks; both are out of the Fed's domain, as the long-term solutions are political, not monetary. While the current inflation issue is predominantly supply driven, the Fed can affect the demand side of the equation, but only to a degree. For example, food demand and nearly three-quarters of energy demand (transportation use) are near price inelastic. Historically, supply driven food price shocks have persistent pressures on headline CPI one year out. That leaves only a portion of demand that the Fed can address to bring down inflation. In other words, the Fed may have no choice but to pursue a deeper recession and further wealth effect reduction to bring down inflation.
Making Things Worse: QT, Shallow Market Depth and Deteriorating Financial Conditions
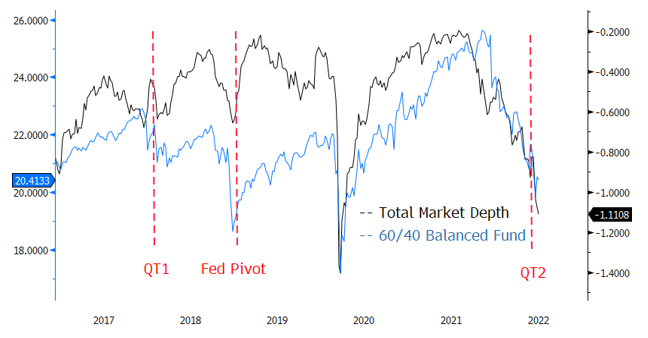
As the Fed steps up the pace of reversing wealth effect reduction, it will be doing it with market depth (trading liquidity) at exceptionally low levels. The Fed has started its quantitative tightening cycle (QT), and if we compare this QT cycle (QT2) with the first one in 2018 (QT1), QT2 is much more aggressive and is likely to have a more significant impact on markets. For comparison, QT1 started in Q1 2018 with a one-year phase-in, a $30 billion cap on U.S. Treasuries, and a $20 billion cap on mortgage-backed securities (MBS). QT2 began in June 2022 with a three-month phase-in, a $60 billion U.S. Treasury cap and a $35 billion cap on MBS. Though QT2 may start with a run-off of maturing assets, the delta in liquidity is significant for market functioning. As QT2 rolls out, there will be a need to find new buyers, but the withdrawal of liquidity may not have a linear effect.
Figure 4 highlights our proxy of market depth (trading liquidity composite of bonds, equities, credit and currencies) overlain with a 60/40 balanced fund. QT1 began in January 2018 and ended in August 2019, but the market stopped pricing QT effects after the Fed Pivot in January 2019. QT2 started in June 2022, but the current market depth level is far worse than in 2018, leading to a "selling into a vacuum" price action, and more so if a crisis event were to occur. Without a market stress event, QT is likely to result in less liquidity to absorb more collateral. This loss of liquidity will likely bleed into spread products (i.e., taxable bonds that are not Treasury securities), increasing spreads.
Figure 4. QT2 Starting at Abysmal Market Depth Readings (2017-2022)

Source: Bloomberg and Sprott Asset Management. Data as of 7/04/2022. Included for illustrative purposes only. Past performance is no guarantee of future results.
The Fed has caused the GS FCI9 to increase sharply with the quickest rate of change since the GFC (global financial crisis) and the March 2020 COVID selloff (see Figure 5). The Fed has been pressuring GS FCI higher to reverse the wealth effect to lower inflation expectations. The main components of the NFCI are equities, bonds, credit and currencies. The Fed has a choice in which area to pressure: 1) increase already high interest rate volatility and impair Treasury liquidity further; 2) press credit spreads wider and exacerbate financial system risk; 3) increase the U.S. dollar (USD) further and risk USD funding and liquidity stress; or 4) let the equity markets fall further. None of these are pleasant choices, but the path of least resistance with the smallest amount of systematic risk is option 4, which means, the Fed is likely to sacrifice equity markets in order to reign in the wealth effect.
Figure 5. Goldman Sachs Financial Conditions Index (GS FCI) with 13-Week Rate of Change (2000-2024)

Source: Bloomberg and Sprott Asset Management. Data as of 7/03/2022. Included for illustrative purposes only. Past performance is no guarantee of future results.
S&P 500 Downward Earnings Revisions Coming
Surprisingly, the S&P 500 earnings estimate for 2022 continues to trend higher at about an 8% annualized rate (top right corner of Figure 6). We expect to see significant downward earnings revisions soon. There are too many headwinds for corporate earnings to hold up. Soaring input and transportation costs, higher wages and labor shortages, inventory overhang, currency headwinds, rising debt expense and much more are pressuring margins and growth indicators are rolling over dramatically. Over the past two years, margin expansion was a primary source of positive earnings surprises. Analyst earnings expectations look too high, and their unwillingness to cut earnings estimates is centered on a continuation of growing, near-impossible margins.
So far, the price decline in the S&P 500 has been based on multiple contractions, as seen in Figure 6. S&P 500 earnings estimate momentum has slowed considerably in 2022 compared to the prior two years, and we expect significant earnings downgrades. Historically, during recessions, the median peak-to-trough decline in expected earnings is about -20%. The current P/E ratio for 2022 is 16.6x using BBG's Best EPS function. The average P/E ratio since the GFC is also 16.6x, indicating further downside as equities are nowhere near inexpensive. Even if P/E multiples do not contract further (doubtful), there is still a significant downside risk from falling earnings.
Figure 6. S&P 500 Price, EPS and P/E Ratio (2017-2022)

Source: Bloomberg and Sprott Asset Management. Data as of 7/03/2022. Included for illustrative purposes only. Past performance is no guarantee of future results.
Global Recession Risks are Rising
GDPNow10 (see Figure 7) closed negative for Q2 at -1.0%, and with a Q1 negative 1.5% GDP (gross domestic product) print already, we are likely at least in a technical recession or so close that it scarcely matters. GDPNow is not an official measure of GDP; it is a "nowcasting model" for real GDP. We would point out the sharp decrease from mid-May of positive 2.5% to the current -1% reading for Q2. Other economic data points such as PMIs (Purchasing Managers' Indices) also collaborate with the narrative of a quick deceleration of the U.S. economy. The Eurodollar futures market spread has also materially widened, indicating a call for three rate cuts for 2023, a radical change from current conditions.
A technical recession that very few predicted (including no one in the Fed) will result in analysts bringing down earnings estimates dramatically. The coming earnings markdown will not be a single occurrence as the recent global policy tightening is still making its way through the real economy. Its effects will be felt over the next several months with negative consequences for earnings and financial system risk.
The risk for equities is clear; the economy will likely slow enough to price in recession, and earnings will then be revised materially lower but not likely sufficient enough to strike the Fed put11 or cancel another 125 basis points of rate hikes in the next few months. For equities to re-rate higher (increasing P/Es) would require an accommodative Fed, which will require a series of monthly cooling inflation data, which we have yet to see.
Figure 7. GDPNow and Eurodollar Futures Spread Forecasting Recession (2022)

Source: Bloomberg and Sprott Asset Management. Data as of 7/03/2022. Included for illustrative purposes only. Past performance is no guarantee of future results.
Systematic Risks12 Still Rising
The global financial system and the global economy are more complex than ever and are now seeing multiple exogenous rate shocks, one after the other. The latest is the immediate growing threat of a synchronized global recession, in which there is no growth region to offset weakness and no ability to lean on exports to save the day. Meanwhile, developed central banks will likely aggressively hike rates to bring down the highest inflation readings in decades. The markets remain in a difficult situation: the Fed will likely increase rates if we get solid economic data, and if we get weaker data, the market will likely price in recession.
Systematic risks will likely trend higher if a synchronized global recession develops while central banks are still aggressively hiking rates. As recession moves to the forefront, the risk associated with high debt levels will likely become topical again and prices may begin to reflect that risk. Ultimately, the current stagflation environment combined with a U.S. 120% debt-to-GDP is a potent risk generator, increasing the attraction and need for gold bullion as a safe haven asset. The multiple contraction phase driven by rate hikes has been dramatic, but we are still far away from a dovish Fed pivot and much closer to the approaching risk stage driven by recession dynamics. We believe there is a possible major re-allocation event towards safe haven, capital preservation assets in the second half of 2022.
| 1 | Gold bullion is measured by the Bloomberg GOLDS Comdty Spot Price. |
| 2 | Silver bullion is measured by Bloomberg Silver (XAG Curncy) U.S. dollar spot rate. |
| 3 | The Solactive Gold Miners Custom Factors Index (Index Ticker: SOLGMCFT) aims to track the performance of larger-sized gold mining companies whose stocks are listed on Canadian and major U.S. exchanges. |
| 4 | VanEck Vectors® Gold Miners ETF (GDX®) seeks to replicate as closely as possible, before fees and expenses, the price and yield performance of the NYSE Arca Gold Miners Index (GDMNTR), which is intended to track the overall performance of companies involved in the gold mining industry. The SPDR Gold Shares ETF (GLD) is one of the largest gold ETFs. |
| 5 | The U.S. Dollar Index (USDX, DXY, DX) is an index (or measure) of the value of the United States dollar relative to a basket of foreign currencies, often referred to as a basket of U.S. trade partners' currencies. |
| 6 | The S&P 500 or Standard & Poor's 500 Index is a market-capitalization-weighted index of the 500 largest U.S. publicly traded companies. |
| 7 | Bloomberg’s commodity indices are a family of financial benchmarks designed to provide liquid and diversified exposure to physical commodities via futures contracts. |
| 8 | The Atlanta Fed's Wage Growth Tracker is a measure of the nominal wage growth of individuals. It is constructed using microdata from the Current Population Survey (CPS) and is the median percent change in the hourly wage of individuals observed 12 months apart. |
| 9 | The Goldman Sachs Financial Conditions Index (GSFCI) is defined as a weighted average of riskless interest rates, the exchange rate, equity valuations, and credit spreads, with weights that correspond to the direct impact of each variable on GDP. |
| 10 | The growth rate of real gross domestic product (GDP) is a key indicator of economic activity, but the official estimate is released with a delay. The GDPNow forecasting model provides a "nowcast" of the official estimate before its release by estimating GDP growth using a methodology similar to the one used by the U.S. Bureau of Economic Analysis. |
| 11 | The "Fed put" is the level where the Federal Reserve will take action to begin supporting asset markets by reversing rate hikes and restarting quantitative easing (QE) programs. |
| 12 | Systematic risk is risk that is inherent to the entire market or the whole market segment as it affects the economy as a whole and cannot be diversified away; it is also known as an “undiversifiable risk” or “market risk” or even “volatility risk.” |
Important Disclosure
Past performance is no guarantee of future results. You cannot invest directly in an index. Investments, commentary and statements are that of the author and may not be reflective of investments and commentary in other strategies managed by Sprott Asset Management USA, Inc., Sprott Asset Management LP, Sprott Inc., or any other Sprott entity or affiliate. Opinions expressed in this commentary are those of the author and may vary widely from opinions of other Sprott affiliated Portfolio Managers or investment professionals.
This content may not be reproduced in any form, or referred to in any other publication, without acknowledgment that it was produced by Sprott Asset Management LP and a reference to sprott.com. The opinions, estimates and projections (“information”) contained within this content are solely those of Sprott Asset Management LP (“SAM LP”) and are subject to change without notice. SAM LP makes every effort to ensure that the information has been derived from sources believed to be reliable and accurate. However, SAM LP assumes no responsibility for any losses or damages, whether direct or indirect, which arise out of the use of this information. SAM LP is not under any obligation to update or keep current the information contained herein. The information should not be regarded by recipients as a substitute for the exercise of their own judgment. Please contact your own personal advisor on your particular circumstances. Views expressed regarding a particular company, security, industry or market sector should not be considered an indication of trading intent of any investment funds managed by Sprott Asset Management LP. These views are not to be considered as investment advice nor should they be considered a recommendation to buy or sell. SAM LP and/or its affiliates may collectively beneficially own/control 1% or more of any class of the equity securities of the issuers mentioned in this report. SAM LP and/or its affiliates may hold a short position in any class of the equity securities of the issuers mentioned in this report. During the preceding 12 months, SAM LP and/or its affiliates may have received remuneration other than normal course investment advisory or trade execution services from the issuers mentioned in this report.
The information contained herein does not constitute an offer or solicitation to anyone in the United States or in any other jurisdiction in which such an offer or solicitation is not authorized or to any person to whom it is unlawful to make such an offer or solicitation. Prospective investors who are not residents of Canada or the United States should contact their financial advisor to determine whether securities of the Funds may be lawfully sold in their jurisdiction.
The information provided is general in nature and is provided with the understanding that it may not be relied upon as, or considered to be, the rendering of tax, legal, accounting or professional advice. Readers should consult with their own accountants and/or lawyers for advice on their specific circumstances before taking any action.
© 2024 Sprott Inc. All rights reserved.


