


- View Critical Materials January 31, 2025 Performance Table
- For the latest standardized performance and holdings of the Sprott Critical Materials ETFs, please visit the individual website pages: SETM, LITP, URNM, URNJ, COPP, COPJ and NIKL. Past performance is no guarantee of future results.
Key Takeaways
- China is becoming the leader in future clean technology supply chains. The country invested more than twice as much in energy transition as the U.S. in 2024, and the gap is likely to widen given the policy stances of the new U.S. administration.
- DeepSeek’s “cheap AI” model has disrupted the industry and raised questions about the investment-heavy approach to AI development favored by the U.S. However, history suggests that more efficient AI could paradoxically increase future demand for computing infrastructure and data centers. It will also likely lead to an increase in total electricity consumption due to quicker and broader AI adoption, as well as computing infrastructure and data centers.
- Tariffs and trade wars disrupt critical materials markets, leading to resource nationalism and reorganized supply chains. The resulting price fluctuations can slow production timelines initially but also foster research and development, producing new breakthroughs.
January in Review: Critical Materials Rise Amid Volatility
The Nasdaq Sprott Critical Materials™ Index (NSETM™) rose 2.65% in January to close the month at 872.04. The market rebounded from oversold conditions in December 2024, which had been driven by year-end-related selling.
January was a volatile month, shaped by crosswinds from multiple sources. At the start of the month, China’s economic data pointed to continuing weakness, although this was tempered by expectations of further government economic stimulus. The broader commodity indices were buoyed by higher energy prices, brought on by new sanctions on Russian oil, cold weather and higher inflationary expectations. Meanwhile, the inauguration of the new Trump administration brought bullish tailwinds, as investor expectations turned to higher economic growth from stimulative policies like tax cuts, deregulation, reshoring of U.S. industrial manufacturing and massive AI investments. More importantly, no major tariff announcements were made on day one of the new administration, catalyzing a broad market rally from oversold and over-hedged positions.
Amid market turmoil, critical materials show resilience beyond the headlines.
However, market sentiment shifted when DeepSeek, a Chinese startup, made headlines by claiming to have created an open-source AI model that rivaled those of the U.S. AI giants, but at a fraction of the cost and with reduced computing power requirements. In response, the technology-heavy U.S. market sold off along with every derivative play on the AI boom, including critical minerals. Then, on Saturday, February 1, U.S. President Trump announced massive 25% tariffs on Mexico and Canada and a 10% tariff on China. It sparked a global stock market sell-off before Trump abruptly announced a few days later that there would be a one-month pause on the announced tariffs.
Despite the astonishing degree of market volatility, the Nasdaq Sprott Critical Minerals Index has remained relatively steady (see Figure 1). This month’s commentary reviews some of the main factors impacting critical materials. While headlines have been overwhelmingly negative, a deeper look reveals a more nuanced and fundamentally positive picture.
Figure 1. Critical Materials Rebounding from Oversold (2020-2025)
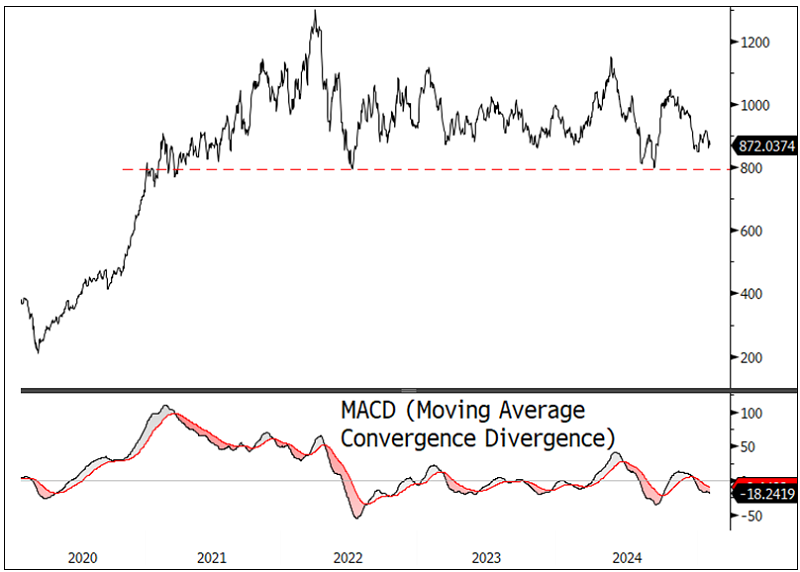
Source: Bloomberg. Nasdaq Sprott Critical Materials™ Index. Data as of 1/31/2025. Moving average convergence/divergence is a trend-following momentum indicator that shows the relationship between two exponential moving averages (EMAs), calculated by subtracting the 26-period EMA from the 12-period EMA. Included for illustrative purposes only. Past performance is no guarantee of future results.
U.S. Policy Upsets EV Market While China Forges Ahead
The electric vehicle (EV) market continues to expand, albeit at a slower pace, particularly in Europe. China has emerged as the dominant force in the EV sector, with its automakers leading international markets and domestic production reaching record levels.
China accelerates in the EV race, while U.S. policy shifts put the brakes on growth.
In the U.S., recent policy proposals—such as eliminating the $7,500 federal tax credit for EVs and ending support for charging infrastructure—have introduced new uncertainties. However, these proposed changes may face significant legislative and legal hurdles, especially regarding the attempts to block California and eight other states from banning gas-powered vehicles by 2035.
Despite these political headwinds, major automakers remain committed to their EV strategies, driven by promising business fundamentals. Tesla's profit margin, for instance, is nearly twice that of traditional auto manufacturers. In 2024, U.S. EV sales reached 1.3 million vehicles, representing a record 8% of total sales, though still significantly behind China's numbers.
While the current U.S. administration is rolling back support, several factors support the continued transition to EVs. These include ongoing technological improvements in batteries and charging systems, growing environmental awareness, and the increasingly competitive total cost of EV ownership versus internal combustion cars. Even with challenges like an underdeveloped charging infrastructure, these factors suggest the EV transition will continue, with varying speeds across regions.
The EV industry's future appears to hinge not on whether the transition to EVs will occur but on how different markets and manufacturers adapt to this evolving landscape. Major U.S. automakers may oppose specific mandates, but they generally support maintaining federal EV incentives to remain competitive, particularly against Chinese manufacturers who have already established a commanding lead in the fastest-growing segment of the global EV market. Overall, the pace of EV growth is still very strong globally, but in the U.S., this pace is likely to moderate.
Energy Transition Investment Gap Gets Bigger
China is far outpacing the U.S. with its energy transition investments, with even the EU surpassing U.S. spending levels. As Figure 2 shows, China invested $818 billion in the sector in 2024 (39% of the $2 trillion global total), while the EU-27 invested $381 billion (18% of the total). The U.S.’s investment was only $338 billion (16%). China's spending represented 4.5% of its gross domestic product (GDP), showing its much stronger commitment to the transition to clean technology than the U.S., which is 1.2% of GDP. The data also indicates robust investment from the EU-27 and the rest of the world ($546 billion combined), indicating that the global energy transition will continue advancing regardless of U.S. policy changes.
China races ahead in clean energy, while the U.S. risks falling behind in the global transition.
Even if the U.S. were to slow its cleantech investments, the impact on global momentum would be limited since it represents a relatively small share of worldwide spending. China's dominance across categories—particularly in renewable energy ($290 billion) and other clean industries ($412 billion)—suggests it is positioning itself as the leader in future clean technology supply chains and markets. This could have significant negative consequences for U.S. economic and technological competitiveness. American companies could find themselves at a disadvantage in the rapidly growing clean energy economy, where investment spending alone is advancing at a 22% CAGR and reached a record $2.1 trillion in 2024, according to Energy Transition Investment Trends 2025, an annual report released today by research provider BloombergNEF (BNEF).
Figure 2. U.S. Trails in Energy Transition Investment
Investment in energy transition by the U.S. lagged other industrial powers in 2024, and the gap will likely widen. On a dollar basis, China’s energy transition investment in 2024 exceeded the U.S. and EU-27 combined. China invested 4.5% of its GDP in 2024, versus the EU-27’s 2.0% and only 1.2% for the U.S.
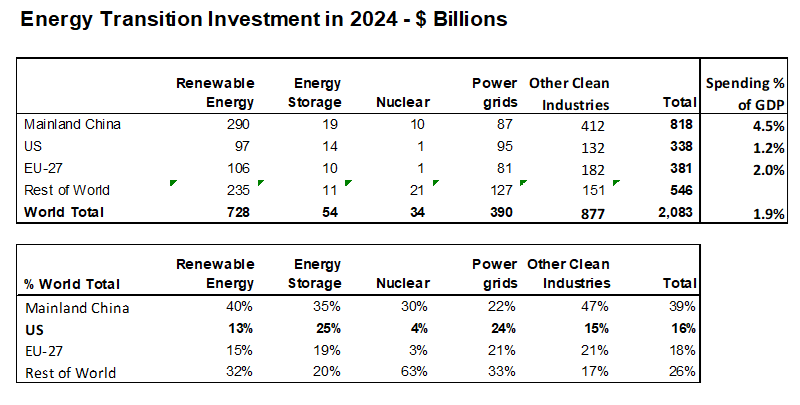
Source: BloombergNEF Energy Transition Investment Trends 2025.
Seeking the Meaning of DeepSeek
DeepSeek, a Chinese AI startup, has disrupted the industry by creating an open-source AI model, R1, which performs similarly to top American models while being developed at a significantly lower cost and with far less computing power. This has raised questions about the U.S. tech industry’s approach to AI development, especially its reliance on massive investments in computing infrastructure and power-intensive data centers.
DeepSeek is widely recognized as a breakthrough, but conflicting views exist on its technical claims and potential impact. Some analysts remain skeptical of the reported development costs and resource usage. Others question whether the model truly rivals top performers without the use of advanced GPUs. The long-term impact on the AI infrastructure market is also a subject of discussion, with some predicting reduced data center spending and others expecting continued growth driven by wider AI adoption. Regardless, DeepSeek has clearly accelerated discussions around the future of AI efficiency.
DeepSeek’s AI breakthrough may cut costs—but could supercharge global energy demand.
Jevons Paradox
DeepSeek's breakthrough could lead to a rapid shift towards more efficient AI models, theoretically reducing the need for massive data centers and lowering overall electricity demand. However, lower-cost AI models could just as easily expand AI adoption and increase electricity demand. The net impact will depend on how use patterns evolve. The AI industry was already moving toward prioritizing efficiency over raw computing power. DeepSeek may have accelerated this trend.
Increased efficiency can often lead to increased usage—the so-called Jevons paradox, where growing efficiency in resource use increases rather than decreases resource consumption. History offers useful parallels:
- Rise of the personal computer: PCs initially seemed like a way to reduce reliance on large power-hungry mainframes. However, their proliferation increased overall electricity demand as PCs became ubiquitous. DeepSeek, while more efficient per model, could similarly lead to a surge in AI applications, potentially offsetting overall energy savings.
- Open-source software movement: Open-source software (OSS) doesn't directly impact electricity demand, but OSS applications certainly do. The rise of the internet, which is heavily reliant on OSS technologies, has led to a massive increase in data center electricity consumption. DeepSeek's open-source nature could similarly fuel a boom in AI applications and drive energy use.
- Mobile revolution: Smartphones are more energy-efficient than laptops or desktops. However, their ubiquity, along with constant connectivity and data consumption, has significantly increased global electricity consumption. Likewise, DeepSeek's efficiency could lead to a similar explosion in AI-powered devices and applications, potentially driving up electricity demand.
When technology becomes more efficient, it tends to become more widely used. DeepSeek's AI models may be less power-hungry, but their improved efficiency could lead to broader adoption and new applications and ultimately increase total energy consumption.
For critical materials, the amount of electricity demand matters, not the type of AI model, cost of computing or data center configuration. AI is not the only factor. Two other factors are set to drive up U.S. electricity demand: industrial reshoring and the continuing expansion of the digital economy.
Tariffs, Trade Wars and Critical Materials
Critical materials are essential for emerging technologies and military applications, but in today’s de-globalizing world, their value as strategic geopolitical assets is rising. Tariffs and trade wars could have far-reaching effects, reshaping both supply chains and environmental policies while fundamentally altering how these strategic resources are sourced and utilized. While short-term challenges—such as increased costs and supply bottlenecks—are likely, the long-term trend points toward a more diversified but costlier global supply network.
Supply Chain Disruption
Many critical materials are sourced from a handful of countries with unique geological deposits and specialized processing capabilities. Tariffs or retaliatory trade measures make these concentrated supply chains vulnerable to disruption. For example, China dominates in rare earth elements. In a trade conflict, China could encourage it to impose export restrictions or withhold supply, causing production delays in sectors like electronics and defense.
A trade conflict would also likely spur companies to seek alternative sourcing, diversify geographically, or reconfigure their supply chains by investing in domestic or regional production. New mining operations and processing facilities may be required. The cost of affected critical minerals would likely rise due to added costs.
Tariffs disrupt critical materials, fueling both supply risks and innovation.
Tariffs also increase the cost of imported critical minerals. Combined with uncertainty from trade disputes, this can lead to short-term price spikes and greater market volatility. As increased costs filter through the supply chain, end products—from consumer electronics to renewable energy technologies—face higher prices, potentially impacting demand in sensitive market segments.
Resource Nationalism
Trade conflicts tend to fragment global markets but can also lead to new bilateral or multilateral agreements aimed at stabilizing supply. International bodies and diplomatic initiatives may play a critical role in mediating disputes and setting global standards for resource governance.
Countries affected by trade tensions are increasingly forming new alliances to secure critical material supplies. Bilateral agreements and regional trade pacts help buffer against volatile global markets. Nations rich in critical materials may adopt policies based on resource nationalism, prioritizing domestic consumption or restricting exports to enhance national security.
Control over critical material supplies can translate into significant geopolitical leverage. Countries with abundant resources may use this advantage to negotiate favorable trade terms, shape international resource governance, or enhance global influence. Such actions can bolster national security but also risk creating fragmented markets and further complicating international trade dynamics.
Fluctuation and Innovation
Industries like renewable energy, EVs, and high-tech manufacturing are susceptible to fluctuations in mineral prices and availability. Higher input costs can slow production timelines and stifle innovation. However, these challenges can also spark research and development to find substitutes for high-risk minerals or enhance efficiency in material usage, creating new breakthroughs.
Updates on Critical Minerals
Copper: Complex Interplay of Factors
In January, copper prices were driven by a complex interplay of macroeconomic developments, U.S. policy shifts, and ongoing supply challenges. The copper spot price began the year at $3.92 per pound, its lowest level since August 2024, as the U.S. dollar strengthened in anticipation of the new Trump administration’s economic policies. Over the month, the copper price gained ground, rising 3.19% to close at $4.05 per pound. Copper mining stocks had a mixed month, falling 2.74% overall, while junior copper miners gained 0.17%.
Uncertainty about the incoming Trump administration’s trade policy weighed on the market, particularly the prospect of tariffs on copper. On February 1, Trump issued executive orders imposing new tariffs on imports from Canada, Mexico, and China, citing a national emergency posed by illegal aliens and drugs.16 While all imports from Canada and Mexico were initially set to face a 25% tariff, "energy or energy resources" from Canada were granted a lower 10% tariff.
Copper’s future heats up as policy shifts, AI breakthroughs and supply strains collide.
However, on February 3, just before the new tariffs were due to take effect, the U.S. temporarily paused them on Canada and Mexico for 30 days to allow for negotiations, while the additional 10% tariff on all imports from China was imposed as scheduled on February 4. Additionally, Trump’s executive orders included withdrawing from the Paris Agreement, rolling back EV mandates, and restricting offshore wind development, all of which negatively impact long-term copper demand from the energy transition sector.
Despite these negative events, Trump’s other policies have acted as a counterbalance and may increase demand for copper. The U.S. Department of Energy has a new directive to “Advance Energy Addition, Not Subtraction” and “Strengthen Grid Reliability and Security”. 17 The administration is clearly focused on increasing the energy supply to meet surging U.S. electricity demand, perhaps intensified by Trump initiatives like reshoring industries to the U.S. and accelerating U.S. AI dominance. Copper is critical to the transmission of electricity in each of these aspects. As the U.S. undergoes its electricity-intensive fourth industrial revolution, we believe the demand pressure for critical materials, like copper, will likely spark a new commodity supercycle.
The announcement of DeepSeek’s energy-efficient AI model added volatility to the copper market in January. Previously, it had been assumed that AI-related power infrastructure would continue to expand, and DeepSeek’s revelation initially led to a sharp selloff in AI-related sectors. However, the market recovered as investors reassessed. DeepSeek came to be seen as a positive factor since, per Jevon’s paradox, more cost-effective and efficient technologies could lead to increased energy consumption and even greater copper demand.
China continues to play a pivotal role in driving copper demand through its record-breaking progress in the energy transition. In 2024, the country’s total power generation capacity grew by 14.6%, driven by solar with a 45.2% increase.18 Notably, China achieved its 2030 clean energy goal six years ahead of schedule, reinforcing its long-term commitment to gaining energy independence. Meanwhile, the State Grid Corporation of China unveiled a $90 billion investment plan for 2025 aimed at enhancing the efficiency and distribution of the power grid, a move that continues to support increased copper consumption.19
Given this robust demand backdrop, the copper concentrate market remains tight. The spot treatment charge turned negative in January, reflecting a scarcity of copper concentrate. Smelters that lack long-term contracts may come under financial pressure, potentially causing them to reduce output to offset mounting losses.
On the supply side, disruptions further intensified market tightness. A fire at Ivanhoe Mines’ Kamoa-Kakula smelter in the Congo Republic on January 2 led the company to postpone its supply ramp-up by as much as three months. Major mining companies such as BHP, Teck Resources, First Quantum and Zijin Mining downgraded production guidance. Freeport-McMoRan’s 2025 guidance also came in at the lower end of market expectations, adding to concerns about supply availability.
Looking ahead, copper’s role continues to evolve and grow. Grid modernization, AI-driven infrastructure expansion, and rising industrial activity in emerging markets are expected to drive sustained demand growth. The market also faces supply-side constraints, including declining ore grades, project delays and geopolitical risks, which could further tighten availability. Trade policies under the new U.S. administration remain a key uncertainty. Ultimately, we believe that copper fundamentals are strengthening; it should remain one of the most compelling commodities in the year ahead.
Figure 3. Copper Spot Market Up, Miners Mixed (2020-2025)
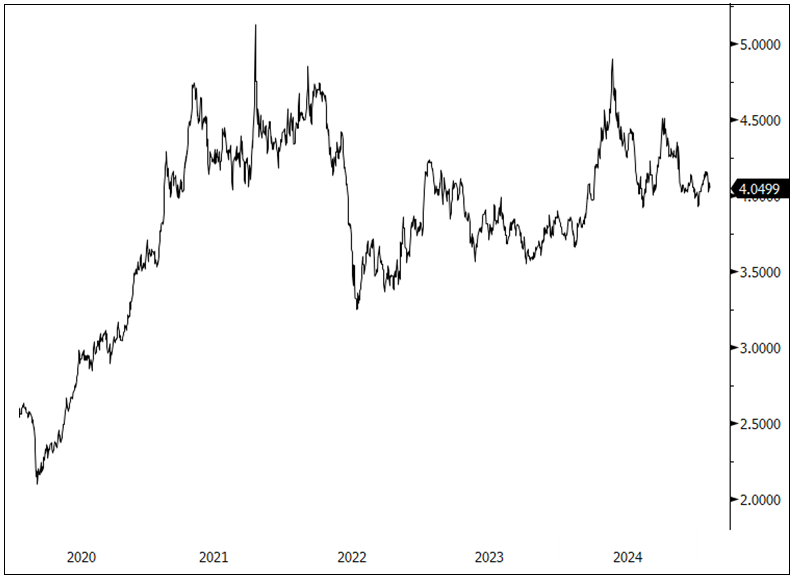
Source: Bloomberg. Copper spot price, $/lb. Data as of 1/31/2025. Included for illustrative purposes only. Past performance is no guarantee of future results.
Lithium: Market Shrugs Off U.S. Actions Against EVs
The lithium carbonate market saw modest gains in January, with the spot price rising 2.14% and lithium mining stocks increasing 0.89%. Market sentiment remained mixed, but various factors provided support, including supply adjustments, strong EV demand in China, and increasing industry consolidation.
Lithium holds steady as China’s EV boom outweighs U.S. policy shifts.
A key development was Trump’s initiatives to eliminate EV mandates and end federal EV subsidies. This shift introduced uncertainty about the future of EV adoption in the U.S. However, the broad impact on lithium demand is expected to be limited as the U.S. represents a relatively small portion of global EV sales. China is the dominant force in the sector. It is projected to account for 65% of global EV sales in 2025, during which worldwide sales are expected to reach 22 million vehicles, a 30% rise from 2024’s 17.2 million.20 A similar trend is forecast for Europe, where EV sales are projected to grow 31% to 4.2 million units in 2025. These strong forecasts suggest that global lithium demand will remain resilient despite shifting U.S. policies.
After a prolonged period of declining prices, lithium may stabilize in 2025, supported by mine closures and continued demand growth in China. From the peak in November 2022, lithium prices have dropped nearly 88%, forcing several producers to suspend operations and creating tighter supply conditions. Meanwhile, China renewed its EV subsidy in January. This subsidy, which officially expired at the end of 2024, was doubled in mid-2024 and provided a significant boost to the sector, with over five million vehicles benefiting from the incentives by mid-December.21
Amid this evolving landscape, M&A activity may increase in the lithium industry as companies look to consolidate and position themselves for long-term growth. The current low-price environment in battery metals markets has encouraged deal-making. Producers are seeking to scale operations, reduce costs and gain exposure to long-term demand trends in lithium and other battery metals. Several major acquisitions have already taken place, reinforcing this shift. Rio Tinto announced a $6.7 billion acquisition of Arcadium Lithium in October 2024, paying a 90% premium for the deal. In January 2025, Zijin Mining disclosed that it paid $1.87 billion for a 24.8% stake in Zangge Mining.
As supply adjustments take hold and global EV demand remains strong, 2025 is shaping up to be a pivotal year for lithium. Price stabilization, industry consolidation and continued government stimulus measures in China should support long-term growth prospects even as shifting U.S. policies create uncertainty.
Figure 4. Lithium Posts Modest Gains in Mixed Market (2020-2025)
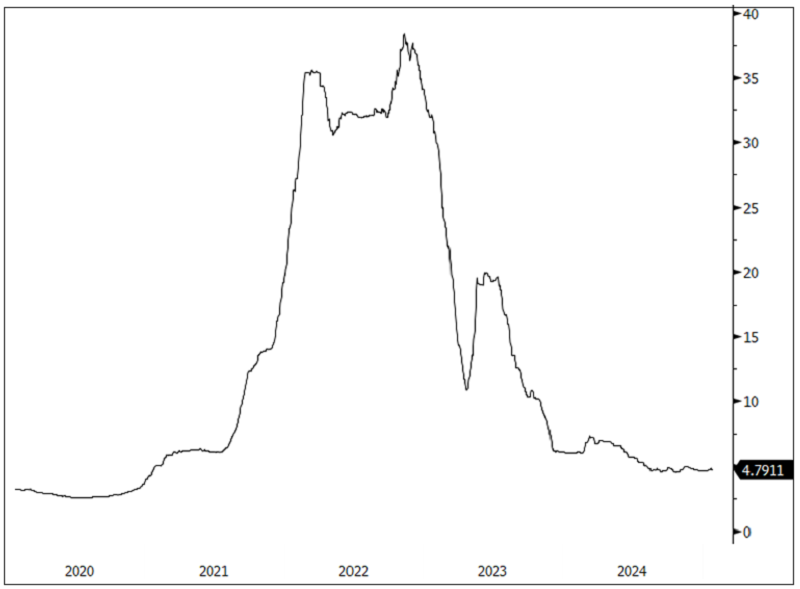
Source: Bloomberg. Lithium carbonate spot price, $/lb. Data as of 1/31/2025. Included for illustrative purposes only. Past performance is no guarantee of future results.
Nickel: Looking to Batteries for Long-Term Growth
Nickel prices edged down 0.71% in January, while nickel mining stocks fell 7.08%.11,5 The metal remains heavily reliant on stainless steel production, which accounted for 66% of total demand in 2024, while batteries made up 16%.22 However, despite stainless steel being the dominant use case, the battery sector is expected to drive long-term demand growth, particularly as electric vehicle technology advances.
Despite January's dip, long-term demand for nickel is set to grow with the rise of high-nickel EV batteries.
Like lithium, nickel was negatively impacted by the Trump administration’s initiatives to roll back EV subsidies and mandates, which added uncertainty to the U.S. EV market. However, American and European consumer preferences for longer-range EVs are raising demand for high nickel-content batteries, particularly nickel cobalt manganese (NCM) cathodes. While China has largely favored lithium iron phosphate (LFP) batteries, which contain no nickel, the U.S. and Europe have adopted NCM at 67% and 78%, respectively, compared to China’s 25%. Further, the U.S. and Europe are increasing nickel demand by moving toward higher nickel ratios within NCM batteries to maximize driving range and by having larger battery pack sizes for these NCM batteries. This shift may bolster nickel demand as automakers focus on larger and higher nickel-content batteries. Beyond EVs, the demand for stainless steel, which is more closely linked to global economic growth, was also impacted by trade tensions and tariffs.
On the supply side, the market remains in a state of oversupply, though there were important developments in January. Indonesia, the world’s largest nickel producer, accounting for more than half of global mined nickel output, approved a higher 2025 mining quota of 29823 million wet metric tons, up from 271.89 million wet metric tons in 2024. This decision dampened market optimism that Indonesia would take more price-supportive actions by limiting production. However, the country has previously stated its commitment to stabilizing prices by regulating nickel ore sales and production licenses, aiming to keep prices in the $15,000 to $18,000 per metric ton range. By the end of January, nickel prices were hovering near the lower end of this target at $15,003.
Figure 5. Nickel Seeks Price Stability (2020-2025)
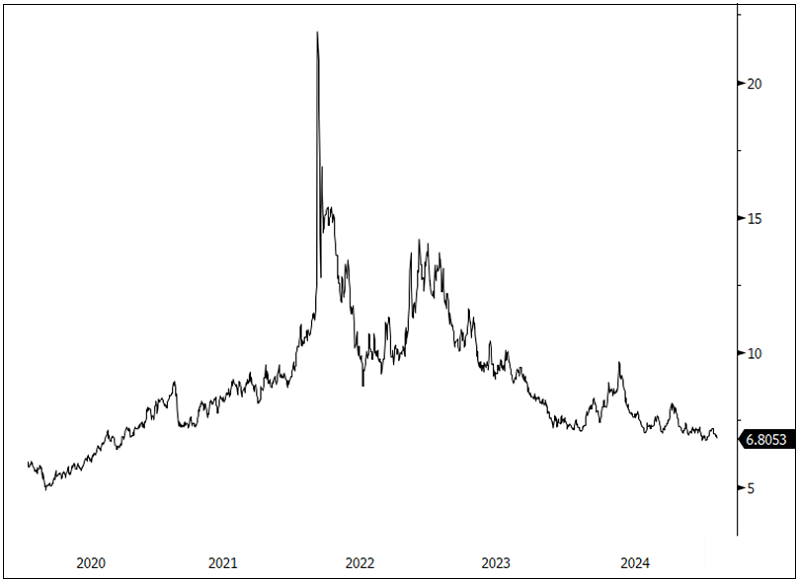
Source: Bloomberg. Nickel spot price, $/lb. Data as of 1/31/2025. Included for illustrative purposes only. Past performance is no guarantee of future results.
Performance as of January 31, 2025 Performance
| Metric | 1/31/2025 | 12/31/2024 | Change | % Chg | YTD Chg | Monthly Comment |
| Miners | ||||||
| Nasdaq Sprott Critical Materials™ Index1 | 872.04 | 849.53 | 22.51 | 2.65% | 2.65% |
NSETMTM Index rebounded in January after a sharp sell-off into the year-end close. The start of the second Trump term has weighed on the critical minerals complex with fears of tariffs and rollbacks in green energy spending countered by higher economic growth driven by deregulation, tax cuts, and further economic stimulus. |
| Nasdaq Sprott Lithium Miners™ Index2 | 412.25 | 408.60 | 3.66 | 0.89% | 0.89% | |
| North Shore Global Uranium Mining Index3 | 3390.76 | 3342.43 | 48.33 | 1.45% | 1.45% | |
| Nasdaq Sprott Copper Miners Index4 | 1070.92 | 1101.10 | (30.18) | (2.74)% | (2.74)% | |
| Nasdaq Sprott Nickel Miners™ Index5 | 477.17 | 513.55 | (36.38) | (7.08)% | (7.08)% | |
| Nasdaq Sprott Junior Copper Miners™ Index6 | 1069.46 | 1067.70 | 1.77 | 0.17% | 0.17% | |
| Nasdaq Sprott Junior Uranium Miners™ Index7 | 1286.54 | 1213.77 | 72.77 | 6.00% | 6.00% | |
| Physical Materials | ||||||
| Lithium Carbonate Spot Price $/lb8 | 4.79 | 4.69 | 0.10 | 2.14% | 2.14% |
Stabilizes with strong China demand and U.S. uncertainty. |
| U3O8 Uranium Spot Price $/lb9 | 70.91 | 73.18 | (2.26) | (3.09)% | (3.09)% |
Volatility with DeepSeek and Trump 2.0. |
| LME Copper Spot Price $/lb10 | 4.05 | 3.92 | 0.13 | 3.19% | 3.19% |
Rebounds with multiple competiting factors. |
| LME Nickel Spot Price $/lb11 | 6.81 | 6.85 | (0.05) | (0.71)% | (0.71)% |
Hits lower end of Indonesian nickel price target. |
| Benchmarks | ||||||
| S&P 500 Index12 | 6,040.53 | 5,881.63 | 158.90 | 2.70% | 2.70% |
The S&P 500 began the month on a negative note as bond yields, driven by the term premium, soared higher on risks of excessive stimulus pressuring inflation and concerns of funding rapidly expanding debt and deficits. |
| DXY US Dollar Index13 | 108.37 | 108.49 | (0.12) | (0.11)% | (0.11)% | |
| BBG Commodity Index14 | 102.29 | 98.76 | 3.53 | 3.58% | 3.58% | |
| S&P Metals & Mining Index15 | 3033.78 | 2904.89 | 128.89 | 4.44% | 4.44% | |
*Mo % Chg and YTD % Chg for this Index are calculated as the difference between the month end's yield and the previous period end's yield, instead of the percentage change. BPS stands for basis points.
- For the latest standardized performance and holdings of the Sprott Critical Materials ETFs, please visit the individual website pages: SETM, LITP, URNM, URNJ, COPP, COPJ and NIKL. Past performance is no guarantee of future results.
Footnotes
| 1 | The Nasdaq Sprott Energy Transition Materials™ Index (NSETM™) is designed to track the performance of a selection of global securities in the energy transition materials industry, and was co-developed by Nasdaq® and Sprott Asset Management LP. |
| 2 | The Nasdaq Sprott Lithium Miners™ Index (NSLITP™) is designed to track the performance of a selection of global securities in the lithium industry, including lithium producers, developers and explorers; the Index was co-developed by Nasdaq® and Sprott Asset Management LP. |
| 3 | The North Shore Global Uranium Mining Index (URNMX) is designed to track the performance of companies that devote at least 50% of their assets to the uranium mining industry, which may include mining, exploration, development and production of uranium, or holding physical uranium, owning uranium royalties or engaging in other non-mining activities that support the uranium mining industry. |
| 4 | The Nasdaq Sprott Copper Miners™ Index (NSCOPP™) is designed to track the performance of a selection of global securities in the copper industry. |
| 5 | Nasdaq Sprott Nickel Miners™ Index (NSNIKL™) is designed to track the performance of a selection of global securities in the nickel industry. |
| 6 | Nasdaq Sprott Junior Copper Miners™ Index (NSCOPJ™) is designed to track the performance of mid-, small- and micro-cap companies in copper-mining related businesses. |
| 7 | Nasdaq Sprott Junior Uranium Miners™ Index (NSURNJ™) is designed to track the performance of mid-, small- and micro-cap companies in uranium-mining related businesses. |
| 8 | The lithium carbonate spot price is measured by the China Lithium Carbonate 99.5% DEL. Source Bloomberg and Asian Metal Inc. Ticker L4CNMJGO AMTL Index. Data converted to pounds and to USD with Bloomberg FX Rates. |
| 9 | The U3O8 uranium spot price is measured by a proprietary composite of U3O8 spot prices from UxC, S&P Platts and Numerco. |
| 10 | The copper spot price is measured by the LME Copper Cash ($). Source Bloomberg ticker LMCADY. Data converted to pounds. |
| 11 | The nickel spot price is measured by the LME Nickel Cash ($). Source Bloomberg ticker LMNIDY. Data converted to pounds. |
| 12 | The S&P 500 or Standard & Poor's 500 Index is a market-capitalization-weighted index of the 500 largest U.S. publicly traded companies. |
| 13 | The U.S. Dollar Index (USDX, DXY) is an index of the value of the U.S. dollar relative to a basket of foreign currencies. |
| 14 | The Bloomberg Commodity Index (BCOM) is a broadly diversified commodity price index that tracks prices of futures contracts on physical commodities, and is designed to minimize concentration in any one commodity or sector. It currently has 23 commodity futures in six sectors. |
| 15 | The S&P Metals & Mining Select Industry Index comprises stocks in the S&P Total Market Index that are classified in the GICS metals & mining sub-industry. |
| 16 | Source: U.S. White House, “Fact Sheet: President Donald J. Trump Imposes Tariffs on Imports from Canada, Mexico and China”, February 1, 2025. |
| 17 | Source: U.S. Department of Energy, “Secretary Wright Acts to “Unleash Golden Era of American Energy Dominance”, February 5, 2025. |
| 18 | Source: Globe and Mail, “China’s Renewable Energy Boom: A Record-Breaking Shift or Still Chained to Coal?”, February 11, 2025. |
| 19 | Source: Reuters, “China's State Grid outlays record $88.7 bln investment for 2025”, January 15, 2025. |
| 20 | Source: BloombergNEF, “Clean Transport: 10 Things to Watch in 2025”, January 13, 2025. |
| 21 | Source: Reuters, “Lithium prices to stabilise in 2025 as mine closures, China EV sales ease glut, analysts say”, January 13, 2025. |
| 22 | Source: Benchmarkminerals.com, “Mine to Grid: NCM”, February 5, 2025. |
| 23 | Source: Mining.com, “Indonesia approves 2025 nickel mining quota”, January 23, 2025. |
Investment Risks and Important Disclosure
Relative to other sectors, precious metals and natural resources investments have higher headline risk and are more sensitive to changes in economic data, political or regulatory events, and underlying commodity price fluctuations. Risks related to extraction, storage and liquidity should also be considered.
Gold and precious metals are referred to with terms of art like "store of value," "safe haven" and "safe asset." These terms should not be construed to guarantee any form of investment safety. While “safe” assets like gold, Treasuries, money market funds and cash generally do not carry a high risk of loss relative to other asset classes, any asset may lose value, which may involve the complete loss of invested principal.
Past performance is no guarantee of future results. You cannot invest directly in an index. Investments, commentary and opinions are unique and may not be reflective of any other Sprott entity or affiliate. Forward-looking language should not be construed as predictive. While third-party sources are believed to be reliable, Sprott makes no guarantee as to their accuracy or timeliness. This information does not constitute an offer or solicitation and may not be relied upon or considered to be the rendering of tax, legal, accounting or professional advice.