

Key Takeaways
- Record Prices: U.S. copper prices reached an all-time high of $5.28/lb on March 26.
- Tariff Momentum: March’s rally was fueled by the potential for a duty of as much as 25% on copper imports to the U.S.
- April Reversal: The broader-than-expected tariff announcement triggered a global market sell-off, dragging copper and copper miners lower.
- Risk Reset: Correlations have spiked, volatility has surged and risk-off sentiment is here.
- Structural Support Remains: Copper’s strategic importance and limited supply have created an escalating supply-demand imbalance in the face of surging global energy demands.
Performance as of March 31, 2025
Average Annual Total Returns*
| Indicator | 1 MO* | 3 MO* | YTD* | 1 YR | 3 YR | 5 YR |
| Copper Price (COMEX Futures)1 | 11.51% | 25.02% | 25.02% | 25.63% | 1.95% | 17.71% |
| Copper Price (LME Futures)2 | 3.76% | 10.74% | 10.74% | 9.51% | -2.18% | 14.42% |
| Copper Mining Equities (Nasdaq Sprott Copper Miners Index TR)3 | -0.27% | -4.49% | -4.49% | -12.77% | -4.41% | 29.35% |
| Copper Junior Mining Equities (Nasdaq Sprott Junior Copper Miners Index TR)4 | 7.93% | 9.34% | 9.34% | 8.51% | 0.29% | N/A |
| Broad Commodities (BCOM Index)5 | 3.55% | 7.74% | 7.74% | 6.95% | -5.07% | 11.45% |
| U.S. Equities (S&P 500 TR Index)6 | -5.63% | -4.27% | -4.27% | 8.25% | 9.06% | 18.58% |
*Performance for periods under one year is not annualized.
Source: Bloomberg as of 03/31/2025. You cannot invest directly in an index. Past performance is no guarantee of future results.
Copper Performance Review
U.S. copper futures (COMEX, or Commodity Exchange) hit an all-time intraday high of $5.28/lb on March 26, driven by rising anticipation around the potential of a U.S. tariff and a rush to move the metal into the U.S. market. Copper prices remained elevated at the end of the month, finishing March at $5.03/lb, representing a gain of 11.51%. The rally created a significant dislocation between U.S. copper prices and global London Metal Exchange (LME) ones, with the futures spread widening to 16% on March 26, a record high (see Figure 1). For context, the five-year average spread is only 0.5%, and even during the COMEX short squeeze in May 2024, the spread only reached 8%. This latest move reflected a mix of tariff-driven restocking behavior, redirected flows into the U.S. and rising financial positioning.
Copper surged to a record $5.28/lb in March, driven by tariff fears and U.S. demand — before April’s tariff shock sparked a sharp market reversal.
April brought a dramatic shift in tone. President Trump’s April 2 announcement of sweeping “reciprocal tariffs” on imported goods from countries worldwide triggered a global wave of risk aversion, sparking a broad-based sell-off across asset classes. Markets across the globe were decimated, with the S&P 500 Index down over 10% for the two days after the announcement and marking the worst two-day performance since the beginning of the COVID-induced market crash of March 2020. Copper prices have also retreated with the surge in market volatility and a spike in cross-asset correlations, though year-to-date COMEX at $4.40 is still up, and LME at $3.98 is flat. The market's repricing of demand destruction and tariff-induced inflation — causing fears of stagflation — has shifted the near-term market environment to liquidity-driven selling.
The performance of copper mining equities was more measured in March. The Nasdaq Sprott Copper Miners Index declined 0.27% as investors weighed strong copper pricing against a more uncertain macroeconomic backdrop. While higher commodity prices support margins, miners were impeded by trade-related volatility, a shifting geopolitical landscape introducing new risks and broader risk-off sentiment.
Junior copper miners performed better than senior miners in March, gaining 7.93%. U.S.-focused developers outpaced the broader group and were the standout performers, boosted by renewed interest in U.S. production potential. Companies like Northern Dynasty Minerals Ltd. and Arizona Sonoran Copper Co. Inc. led gains as investors responded to the possibility of new policy support and a structurally higher domestic copper price environment. However, these miners have not been immune to the early-April market sell-off and have fallen similarly.
Figure 1. COMEX Copper Hits a Record Premium Over LME (2020-2025)
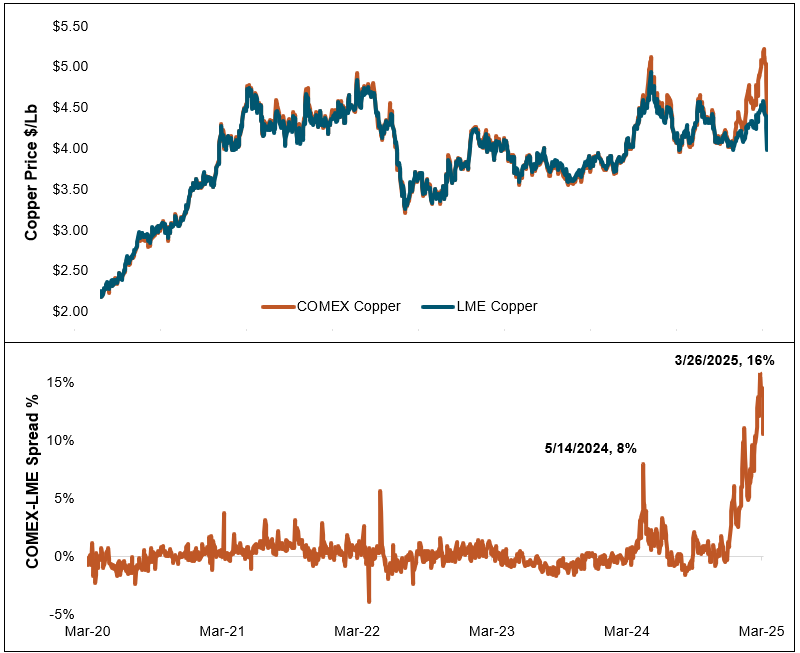
Source: Bloomberg. Data as of 04/04/2025. COMEX Copper is represented by the front-month standardized contract on the CME, ticker HG1. LME Copper is represented by the LME Copper 3 Month Rolling Forward, Bloomberg ticker LMCADS03.
Sprottlight: Copper x Tariffs
How Tariff Anticipation Fueled Copper’s Breakout
Copper’s sharp rally in March was a market reaction to a dramatic shift in U.S. trade policy. On February 25, President Trump signed an executive order directing the Commerce Department to launch a Section 232 investigation into whether America’s reliance on foreign copper constitutes a national security threat.7 The probe opened the door to potential tariffs or quotas on copper imports, marking a significant turning point for the U.S. government’s view of red metal.
While such investigations often span up to 270 days, the Trump administration signaled a heightened sense of urgency. Officials indicated a decision could arrive within weeks rather than months — a stark contrast to the nearly year-long process behind Trump’s steel and aluminum tariffs during his first term. Trump has consistently voiced his intention to impose a 25% tariff on all copper imports, mirroring the strategy used in those earlier cases. The message to the markets was unmistakable: copper is next.
Copper is no longer just a commodity — it's now a strategic asset in the crosshairs of U.S. trade policy.
Anticipating tighter supply and regional price distortion, buyers rushed to move physical copper into the U.S., triggering restocking activity and speculative flows. This contributed to record-high spreads between COMEX and LME copper futures as U.S. prices surged on localized demand and tariff expectations. The effects were not limited to the U.S.; the diversion of copper into American warehouses occurred during a period of already tight global supply, effectively reducing available material in the rest of the world. As physical flows chased policy headlines, copper markets began to reflect logistical friction and a deepening scarcity outside U.S. borders.
At the heart of the tariff rationale is a broader policy effort to revive the U.S. copper industry and reduce reliance on overseas producers. Copper’s critical role in everything from electrical grids to artificial intelligence data centers to weapons manufacturing has elevated its status from industrial input to a strategic asset. Tariffs are being framed as a tool to incentivize new investment and secure domestic supply. However, they will likely raise costs for manufacturers and will take years to translate into meaningful new production.
While copper was explicitly excluded in the sweeping April 2 reciprocal tariff announcement, the market continues to price in the likelihood of targeted copper levies in the weeks ahead. That anticipation has added fuel to an already volatile market, pulling copper into the center of a broader debate over reindustrialization, trade security and resource nationalism.
Figure 2. Copper Mine Production by Country in 2024
The U.S. produces domestically just over 50% of the refined copper it consumes each year. The remainder is imported primarily from Chile, Canada and Peru, according to the United States Geological Survey (USGS).
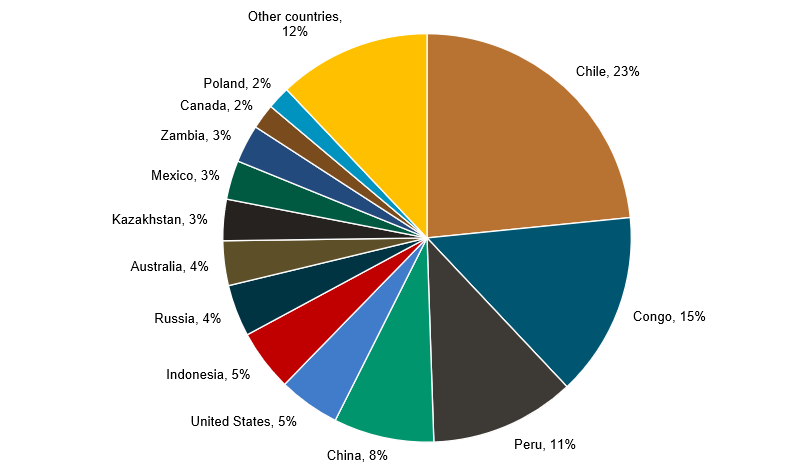
Source: U.S. Geological Survey, Mineral Commodity Summaries, January 2025.
Trump’s “Liberation Day” Market-Wide Risk Catalyst
The optimism around targeted copper tariffs was overtaken by a much larger and more complex policy shock on April 2, when President Trump announced a sweeping package of “reciprocal tariffs” that jolted global markets. The measures' scale, speed and potential permanence went well beyond investor expectations.
Trump’s package introduced a baseline 10% tariff on virtually all U.S. imports, effective April 5, alongside a series of “reciprocal tariffs,” effective April 9, ranging from 10% to 50% against countries around the world, including top trade partners such as China, the European Union and Vietnam.8 The executive order included mechanisms for negotiation, but the baseline 10% duty will remain regardless of trade talks.
Copper was dragged into the market shockwave from Trump’s sweeping tariff announcement on April 2, despite its exemption.
Copper was not included in the reciprocal tariff list. It was one of several metals explicitly exempted, along with uranium, lithium, cobalt and rare earths, in Trump's move to bolster domestic production and manufacturing. However, with a Section 232 investigation still underway, many expect copper to be targeted with a 25% import tariff in the coming weeks.
Canada and Mexico were exempted from the new tariffs under the provisions of the United States-Mexico-Canada Agreement (USMCA), preserving most cross-border trade flows. However, previously imposed tariffs on autos, steel and aluminum still apply. Canada responded with a 25% retaliatory tariff on U.S. autos, while Mexico has thus far held off on retaliation, pursuing diplomatic channels instead.9
China responded on April 4 with a 34% tariff on all U.S. imports, effective April 10, and introduced export controls on rare earths, citing national security.10 These actions were aimed at retaliating against the sharply more aggressive U.S. stance. The U.S. has already imposed two prior tranches of 10% duties on Chinese imports, making the effective new cumulative U.S. tariff rate on Chinese goods 54% when combined with the new reciprocal framework. This escalation confirms what markets had only recently begun to price in and reflect: a full-blown trade war and a change in the world’s economic order.
Investor reaction was immediate. With tariffs threatening to disrupt global growth, copper was swept into a broader correlation-one sell-off,11 as volatility surged and risk positions were rapidly de-grossed.12 Despite supportive fundamentals, the policy pivot triggered margin calls, deleveraging, and aggressive rotation out of cyclical assets, including copper miners.
Are Tariffs a Blunt Tool for a Complex Problem?
The broader 2025 tariff regime carries significant macroeconomic consequences. According to estimates from the Yale Budget Lab, the cumulative impact of all tariffs implemented this year — including the April 2 announcements — is expected to increase overall U.S. consumer prices by approximately 2.3%, amounting to an average annual cost of $3,800 per household. These tariffs are also projected to dampen U.S. gross domestic product (GDP), driven by supply chain disruptions and weaker real demand. Together, these forces raise the risk of stagflation — a combination of sluggish economic growth and persistent inflation. Although commodities like copper have historically performed well in such environments, their growing financialization and increased use as collateral since the last stagflationary period may temper that advantage.
For copper investors, tariffs mark a shift to a macro-driven market dominated by volatility and geopolitical risk.
Further complicating matters is the issue of reciprocity. The executive order permits targeted countries to lower their trade barriers in exchange for relief from U.S. reciprocal tariffs. However, many countries already impose low — or even negligible — tariffs on U.S. goods, leaving limited room for meaningful concessions. In essence, these countries lack viable levers to negotiate. This creates an imbalanced negotiating environment and casts doubt on how much genuine tariff reduction can be achieved through this framework. As a result, the policy functions less as a bargaining tool and more as a de facto mechanism for managing the U.S. trade deficit — focusing on consumption patterns rather than addressing deeper structural imbalances. It also risks deepening long-term tensions with allies who have few practical options for compliance.
With the Federal Reserve (Fed) caught between rising inflation and decelerating growth, it has adopted a cautious, wait-and-see stance. Other central banks, particularly in Asia and Europe, may respond with easing to stabilize domestic growth and currency markets.
For copper investors, the April 2 tariffs represent a turning point. The market has evolved into a broader macroeconomic volatility event dominated by liquidity, uncertainty and geopolitical retaliation. Yet, amid the turbulence, the copper-specific policy trajectory is still moving forward.
Figure 3. Copper Price & Key U.S. Policy Events (2024-2025)
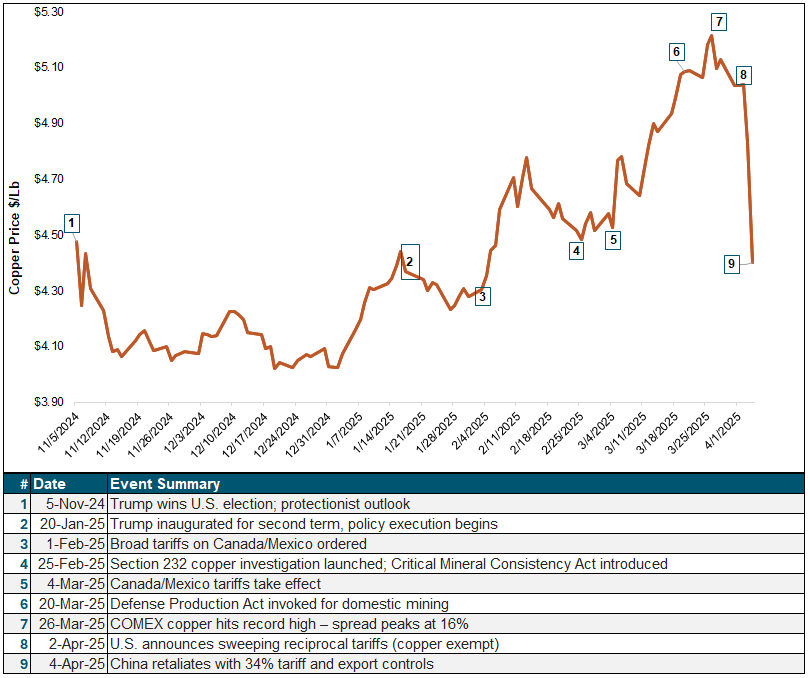
Source: Bloomberg. Data as of 04/04/2025. COMEX Copper is represented by the front-month standardized contract on the CME, ticker HG1.
Market Drivers
U.S. Mining Push: Emergency Powers and Junior Copper Momentum
In March, the Trump administration moved decisively to reindustrialize America’s mineral supply chain. On March 20, President Trump signed an executive order invoking the Defense Production Act (DPA) to fast-track the development of critical minerals, with copper featured prominently.13 The order included multiple prongs: expediting mine permitting, boosting American mineral production and financing, loans and investment support for new mineral production projects. These tools aim to reduce U.S. reliance on foreign resources and catalyze domestic investment.
Trump’s DPA order puts copper at the heart of U.S. industrial policy — fast-tracking mines to close a widening supply gap.
The market response particularly benefitted junior copper developers with U.S.-based assets. Northern Dynasty Minerals, owner of the massive Pebble Mine project in Alaska, saw its share price nearly double in March as optimism grew around its regulatory prospects under the new policy regime.
The policy shift comes amid a global backdrop of tightening copper supply and a widening structural deficit. We believe the copper market will fall further into shortage territory with the accelerating demand from electrification and grid expansion. Yet copper supply growth remains constrained as it currently takes an average of 16.8 years to move from first discovery to production for a copper mine, an extraordinarily long lead time given the scale of surging energy demand.14 By using emergency powers to streamline permitting and funding, the Trump administration is attempting to address this critical development gap.
Copper Poised for Critical Mineral Designation
Complementing the executive action, a bipartisan group of U.S. lawmakers introduced the Critical Mineral Consistency Act of 2025 on February 25.15 If passed, the bill would officially add copper to the U.S. Geological Survey’s list of critical minerals, aligning it with the Department of Energy’s designation. This would unlock federal incentives, tax credits and funding support currently available to other critical materials like lithium and nickel.
The legislation reflects rising concern over China’s dominance in mineral processing and supports a long-term policy pivot toward building secure U.S. supply chains. While the bill remains under debate, its introduction alone has added weight to the idea that copper is being repositioned as a strategic resource, not just an industrial metal.
China Stimulus and Strategic Stockpiling Boost Sentiment
China accounts for more than half of global copper consumption, making its economic direction critically important for market sentiment and price formation. In early March, the Chinese government reaffirmed its “around 5%” GDP growth target for 2025 and announced a budget deficit of 4% of GDP, up from 3% in 2024, committing to increased fiscal and monetary support.16 Industrial production rose 5.9% year-over-year in the first two months of the year, while retail sales and fixed asset investment also gained momentum.17
China also unveiled its 30-point “Special Action Plan for Boosting Consumption” on March 16, targeting income growth, stabilization of the struggling property market and more.18 Though light on specifics, the plan was seen as a signal of intent to rebalance the economy toward domestic demand, a long-term tailwind for copper.
Additionally, the government revealed plans to expand strategic reserves of key industrial metals, including copper, lithium, nickel and cobalt.19 These purchases are intended to strengthen China’s resilience amid growing geopolitical uncertainty and trade risk. This combination of stimulus, consumer-driven policy and strategic stockpiling has reinforced global copper demand sentiment.
Looking Ahead
Copper Tariff Path
While copper was excluded from the April 2 reciprocal tariffs, many expect the White House to impose import duties on copper within weeks, an accelerated timeline compared to initial expectations. The outcome of the Section 232 investigation remains the biggest near-term implication. If the Trump administration proceeds with a 25% copper tariff, it could lead to another wave of buying, disrupt global trade flows and further widen location-based spreads.
As tariff threats mount and global retaliation builds, copper markets are caught between short-term dislocation and long-term scarcity — with policy risk now rivaling fundamentals as the key price driver.
Beyond market mechanics, the policy path remains politically charged. The push for copper tariffs and broader protectionist trade measures appears increasingly linked to the Trump administration’s larger goal of reindustrialization and domestic tax reform. Tariff revenue may be targeted as a bridge to fund campaign promises, including tax cuts. However, should trade flows decline or retaliation intensify, the fiscal sustainability of this strategy may face scrutiny.
Trade Policy Reactions
The European Union is expected to respond in mid-April, potentially as early as the April 13, with retaliatory tariffs targeting emblematic U.S. exports such as bourbon, denim and motorcycles.20 While EU leaders will likely pursue negotiations first, any path toward de-escalation looks tenuous. Meanwhile, China has already retaliated with a 34% tariff on U.S. goods and export controls on critical minerals. As a result, further escalation appears more likely than resolution, which may reinforce stagflation fears, as retaliatory tariffs push up input costs and weigh on global demand.
Macroeconomic Crosscurrents and Fed Policy
Fed Chair Jerome Powell recently reiterated that the central bank is not yet ready to cut rates, citing “significantly larger than expected” tariffs and the likelihood thereby of their economic effects, higher inflation and slower growth, to be larger than expected as well. While initial impacts may be inflationary, second-order effects are expected to hit growth and employment, which could eventually pull the Fed into action.
Markets have meaningfully repriced rate expectations following the tariff announcement, and stagflation risk is rising. At the beginning of the year, the market had priced in 1.7 rate cuts this year. However, as of April 7, the market is now pricing in 4.5, despite Powell’s comments. Lower real rates and a softer dollar will be key developments to watch for copper.
Copper Fundamentals
Given the heightened policy and macro uncertainty currently driving copper markets, it’s essential to separate the short-term dislocations from the underlying fundamentals that continue to support copper’s long-term investment case. While recent price action has been shaped by tariff speculation, the market sits atop a deeper story of constrained supply and accelerating structural demand (Figure 3).
The growing investments in grids, the rapid buildout of AI data centers, the urbanization and industrialization of emerging economies and the energy transition all point to a sustained increase in copper demand. At the same time, copper supply remains increasingly difficult to grow, with long lead times, falling copper ore grades, declining major copper discoveries and frequent supply disruptions.
An important dynamic that may fuel this further is the emergence of “trapped copper,” metal imported into the U.S. ahead of anticipated tariffs but not immediately consumed. This copper is often held in warehouses or tied up in collateralized financing agreements, and due to high U.S. premiums, it is uneconomical to export back to global markets. In effect, it could become stranded within the U.S., unavailable to buyers in the rest of the world. This may distort physical flows, forcing Shanghai and London to compete for a shrinking pool of free-floating copper.
Figure 4. Copper Supply and Demand Imbalance Likely to Grow (2023-2050E)
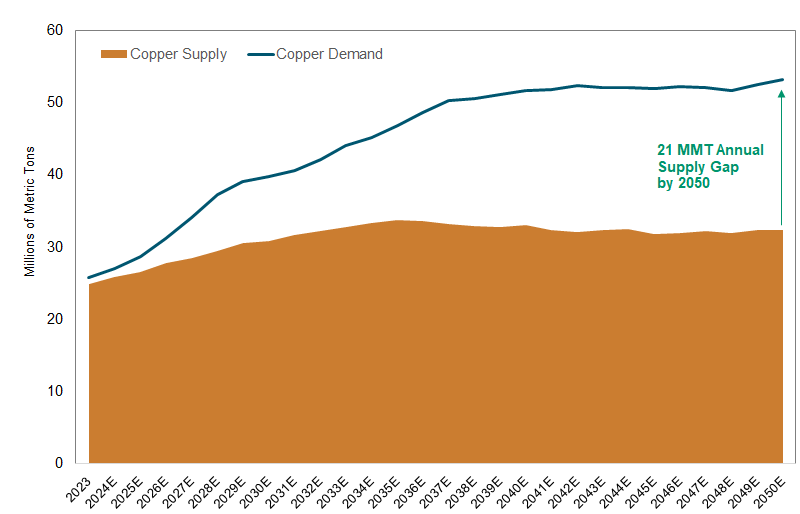
Source: BloombergNEF Transition Metals Outlook 2024. The line represents demand and the shaded area represents supply. Demand is based on a net-zero scenario, i.e., global net-zero emissions by 2050 to meet the goals of the Paris Agreement.
Footnotes
| 1 | The COMEX copper futures are measured by the front-month (HG1) standardized contract on the CME. Source: Bloomberg ticker HG1. |
| 2 | The LME copper futures are measured by the LME Copper 3 Month Rolling Forward. Source: Bloomberg ticker LMCADS03. |
| 3 | The Nasdaq Sprott Copper Miners™ Index (NSCOPP™) is designed to track the performance of a selection of global securities in the copper industry; the Index was co-developed by Nasdaq® and Sprott Asset Management LP. |
| 4 | Nasdaq Sprott Junior Copper Miners™ Index (NSCOPJ™) is designed to track the performance of mid-, small- and micro-cap companies in copper-mining related businesses; the Index was co-developed by Nasdaq® and Sprott Asset Management LP. |
| 5 | The Bloomberg Commodity Index (BCOM) is a broadly diversified commodity price index that tracks prices of futures contracts on physical commodities and is designed to minimize concentration in any one commodity or sector. It currently has 23 commodity futures in six sectors. |
| 6 | The S&P 500 or Standard & Poor's 500 Index is a market-capitalization-weighted index of the 500 largest U.S. publicly traded companies. |
| 7 | Source: The White House, 2/25/2025. ADDRESSING THE THREAT TO NATIONAL SECURITY FROM IMPORTS OF COPPER. |
| 8 | Source: CBS News, 4/4/2025. See the full list of reciprocal tariffs by country from Trump’s “Liberation Day” chart. |
| 9 | Source: National Post, 4/3/2025. Canada slaps 25% counter-tariffs on U.S.-made cars, but not parts. |
| 10 | A "correlation one sell-off" refers to a situation where nearly all asset classes move in the same direction, typically downward, during a market sell-off. This phenomenon occurs when the correlations between different asset classes approach one, meaning they all behave similarly regardless of their usual independent price movements. |
| 11 | "De-grossing" refers to the process of reducing the gross exposure of a portfolio, typically in response to market volatility or significant losses. Gross exposure is the total value of all buy and sell positions in a portfolio. |
| 12 | Source: CNN, 4/4/2025. China imposes 34% reciprocal tariffs on imports of US goods in retaliation for Trump’s trade war. |
| 13 | Source: The White House, 3/20/2025. Fact Sheet: President Donald J. Trump Takes Immediate Action to Increase American Mineral Production. |
| 14 | Average lead time is almost 18 years for mines started in 2020–23, S&P Global. March 20, 2024. |
| 15 | Source: Senate Committee on Energy & Natural Resources, 2/25/2025. Lee, Kelly Introduce Bill to Strengthen the U.S. Critical Mineral Supply Chain. |
| 16 | Source: AP, 3/5/2025. China sticks to an economic growth target of ‘around 5%’ despite a looming trade war with U.S. |
| 17 | Source: Reuters, 3/16/2025. China’s industrial output growth beats expectations in January-February. |
| 18 | Source: Global Times, 3/16/2025. Chinese cities strengthen policy efforts to help stabilize real estate market. |
| 19 | Source: Bloomberg, 3/20/2025. China to Add Cobalt, Copper in Boost to State Metal Reserves. |
| 20 | Source: Euractiv, 4/2/2025. Brussels leaves timeline for EU’s tariff retaliation open, rejecting French comments. |


Investment Risks and Important Disclosure
Relative to other sectors, precious metals and natural resources investments have higher headline risk and are more sensitive to changes in economic data, political or regulatory events, and underlying commodity price fluctuations. Risks related to extraction, storage and liquidity should also be considered.
Gold and precious metals are referred to with terms of art like "store of value," "safe haven" and "safe asset." These terms should not be construed to guarantee any form of investment safety. While “safe” assets like gold, Treasuries, money market funds and cash generally do not carry a high risk of loss relative to other asset classes, any asset may lose value, which may involve the complete loss of invested principal.
Past performance is no guarantee of future results. You cannot invest directly in an index. Investments, commentary and opinions are unique and may not be reflective of any other Sprott entity or affiliate. Forward-looking language should not be construed as predictive. While third-party sources are believed to be reliable, Sprott makes no guarantee as to their accuracy or timeliness. This information does not constitute an offer or solicitation and may not be relied upon or considered to be the rendering of tax, legal, accounting or professional advice.