

Key Takeaways
- Copper and Miners Break Higher: Copper reached record highs in August, while copper miners and junior miners delivered stronger gains, reflecting their leverage to rising metal prices.
- Mine Supply Falls Short: Global mined copper output declined in the first half of 2026 as disruptions, aging assets, lower ore grades and persistent weakness in Chile deepened the market deficit.
- Tariff Risk Distorts Inventories: Expectations for potential U.S. tariffs pulled copper into American warehouses, reducing availability elsewhere and increasing volatility across global markets.
- Strategic Demand Builds: Grid investment, AI data centers and defense programs are creating durable sources of demand that may remain resilient even at elevated copper prices.
- Producer Economics Strengthen: Higher prices, constrained concentrate supply and a slow project-development cycle support robust margins and a favorable outlook for pure-play copper miners.
Performance as of August 31, 2026
| Metric | 1 MO* | 3 MO* | YTD* | 1 YR | 3 YR | 5 YR |
| Copper Spot Price1 | 4.41% | 6.22% | 16.00% | 47.08% | 19.79% | 8.68% |
| Copper Mining Equities (Nasdaq Sprott Copper Miners Index TR)2 | 17.11% | 6.27% | 30.51% | 91.62% | 34.70% | 20.88% |
| Copper Junior Mining Equities (Nasdaq Sprott Junior Copper Miners Index TR)3 | 20.76% | 6.00% | 21.90% | 91.64% | 47.46% | 23.21% |
| Broad Commodities (BCOM Index)4 | 7.05% | 4.63% | 28.88% | 37.53% | 10.05% | 8.05% |
| U.S. Equities (S&P 500 TR Index)5 | 2.72% | 1.68% | 13.14% | 20.38% | 21.02% | 12.78% |
*Performance for periods of less than one year is not annualized.
Source: Bloomberg as of 8/31/2026. You cannot invest directly in an index. Past performance is no guarantee of future results.
Performance Overview: Copper Reaches New Highs as Miners Outperform
Copper reached record highs as weak mine supply, especially from Chile, and tariff-driven inventory imbalances tightened availability. At the same time, growing demand from energy, advanced technology and defense strengthened the market’s long-term outlook.
August was a spectacular month for physical copper and copper mining equities. The LME copper spot price advanced 4.41%, bringing its year-to-date gain to 16.00%, while mining equities delivered considerably greater upside. Copper miners surged 17.11% in August and reached a 30.51% year-to-date return. Junior copper miners led the sector with an exceptional 20.76% gain in August, bringing their year-to-date return to 21.90%. The strength of mining equities reflected their leverage to higher copper prices, with August's rally driven by powerful margin expansion for existing producers and the growing strategic value of future copper supply.
Chile’s copper shortfall is tightening an already constrained market.
Copper’s rally began more than a year ago and has been fueled by increasingly tight mine supply. Disruptions at Grasberg in Indonesia, operated by Freeport-McMoRan, and Kamoa-Kakula in the Democratic Republic of the Congo, operated by Ivanhoe Mines, pushed the market further into deficit last year. Global mine production has continued to disappoint in 2026. Despite multiple record prices in the first half of the year and strong financial incentives to increase output, mined copper production fell 1.1% year over year.6
Chile was a major source of the copper supply shortfall, with production down 6.6%. Lower output at several major mines reflected both operational setbacks and persistent challenges at aging mines. These supply constraints leave the global market less able to absorb further disruptions as demand from electricity grids, AI data centers and defense programs continues to grow.
Refined copper supplies also tightened outside the United States as the prospect of U.S. tariffs prompted traders to shift substantial volumes into American warehouses. These shipments were driven by financial incentives, concentrating inventories in the U.S. rather than where copper was needed for consumption. With mine supply already constrained, the shift left less copper available in LME warehouses and China to meet regional shortfalls.
The strain came to a head on the day copper reached its August record high, when immediately available LME copper commanded a $545 per metric ton premium over copper deliverable three months later, the widest backwardation since 2021.7 Backwardation generally signals tight near-term supply because buyers are willing to pay more to secure metal immediately.
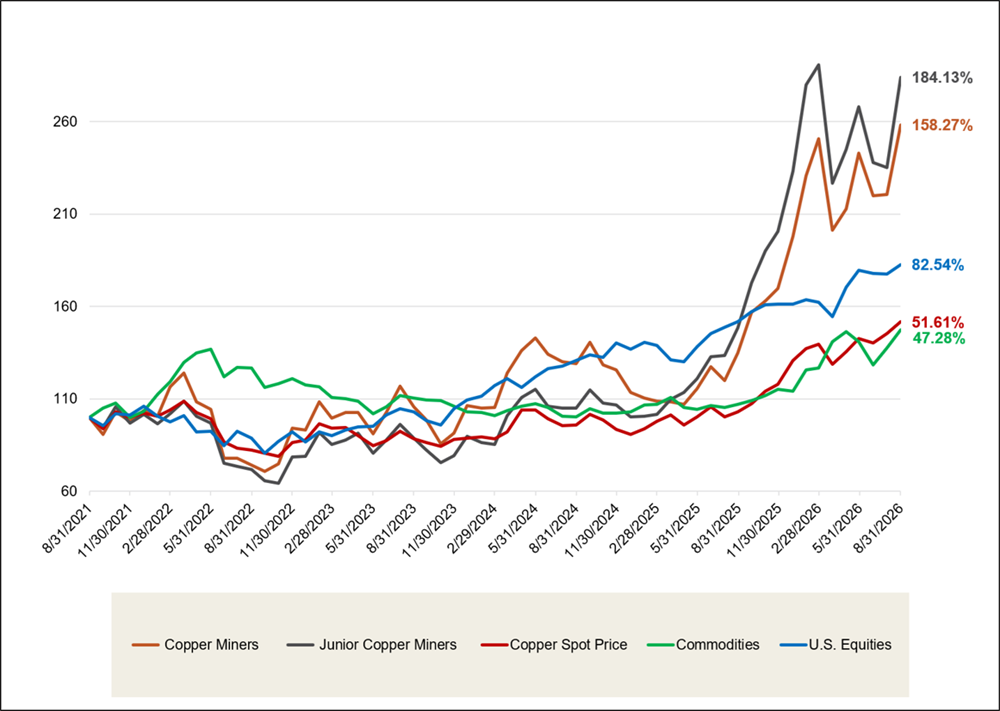
Looking at longer-term performance, copper and copper miners have outpaced broader commodities and equities over the past five years (Figure 1).
Figure 1. Physical Copper and Copper Stocks Have Outperformed Other Asset Classes Over the Past Five Years (8/31/2021-8/31/2026)
Source: Bloomberg and Sprott Asset Management. Data as of 08/31/2026. Copper Miners are measured by the Nasdaq Sprott Copper Miners™ Index (NSCOPPT index); Junior Copper Miners are measured by the Nasdaq Sprott Junior Copper Miners™ Index (NSCOPJT index); U.S. Equities are measured by the S&P 500 TR Index; the Copper Spot Price is measured by LMCADY Comdty; and Commodities are measured by the Bloomberg Commodity Index (BCOM). Definitions of the indices are provided in the footnotes. You cannot invest directly in an index.
Sprottlight: Mine Shortfalls Deepen the Copper Deficit
Global Production Continues to Disappoint
The copper market entered 2026 with limited capacity to absorb further supply disappointments. The disruptions at the Grasberg and Kamoa-Kakula copper mines in 2025 removed an estimated 600,000 metric tons of expected 2026 production, representing approximately 2.5% of the annual global mined copper supply. This added to the challenges for the copper market, which is facing modest growth from existing operations and a limited pipeline of new projects. Global mine production fell 1.1% in the first half of 2026, raising the possibility that annual copper output could register its first decline since 2017.
Plagued by major disruptions, global copper supply could face its first decline since 2017.
Chile remains a major source of weakness in copper supply. As the world’s largest producer, accounting for 23% of global mine output in 2025, Chile has an outsized influence on the market’s supply-demand balance.8 Chilean production fell 9.4% year over year in July, following a 6.6% decline in the first half of 2026, extending a multiyear pattern of output falling short of expectations.9 In an August update, the Chilean Copper Commission, known as Cochilco, lowered its 2026 production outlook to 5.27 million metric tons, representing a decline from 2025.10
Codelco’s persistent shortfalls underscore the challenge. The state-owned company, the world’s second-largest copper miner, has missed its production targets for seven consecutive years. In April 2026, Codelco targeted production of 1.34 MMT from its operations for the year as it pursued a broader ambition to restore production to 1.7 MMT by the end of the decade. By August, less than four months later, the company had withdrawn its 2026 production target amid setbacks and effectively abandoned its longer-term 1.7 MMT growth target.11 After losing its position as the world’s largest copper producer to BHP in 2025, Codelco is now focused on stabilizing production around current levels.
Chile’s production challenges broadened further in August as Antofagasta plc12 and Lundin Mining13 both lowered their 2026 copper production guidance. Together, the revisions removed 35,000 to 55,000 metric tons from their combined outlook, adding to the mounting supply disappointments from the world’s largest copper-producing country. The reductions carry greater significance in a market already in deficit.
Escondida, the BHP-operated mine in Chile and the world’s largest copper mine, faces similar pressures. Despite record mining and processing rates in FY2026, declining ore grades are expected to reduce FY2027 production by approximately 210,000 metric tons at the midpoint of BHP’s guidance, equivalent to nearly 1% of the annual global mined copper supply.14 The projected decline underscores how geological constraints can limit output even at the industry’s largest and most advanced operations.
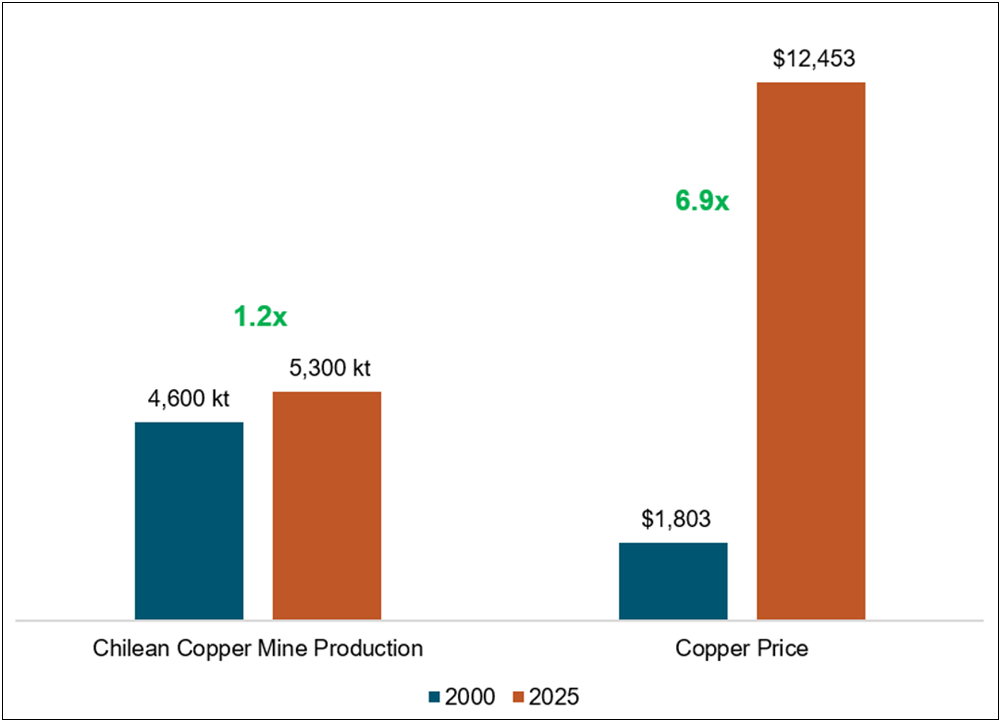
The widening gap between copper prices and Chilean production highlights how slowly mine supply responds to higher prices. From 2000 to 2025, copper prices rose nearly sevenfold, while Chilean mine output increased just 15% (Figure 2). Declining ore grades, aging operations, capital constraints and increasingly complex project requirements have limited production growth. Higher prices can boost existing mines’ profitability, but expanding supply requires sustained investment, effective execution and successful development of new projects.
As Chile struggles to expand output, the market increasingly depends on growth from countries with greater geopolitical and operational risks, particularly the Democratic Republic of the Congo (DRC), China and Russia. The DRC is expected to contribute the largest increase in global mine supply in 2026, following continued production growth in the first half of the year. However, much of its output relies on imported sulfuric acid, leaving it exposed to disruptions in acid and sulfur supplies. The Persian Gulf accounts for approximately 25% of global sulfur production and 50% of seaborne sulfur trade. Disruptions through the Strait of Hormuz, combined with China’s suspension of sulfuric acid exports, could therefore constrain acid availability. DRC output has remained resilient, but supply risks may increase as existing inventories and contracted deliveries are depleted.
Figure 2. Copper Price Increases Nearly Sevenfold While Chilean Copper Mine Production Increases 15% (2000 vs. 2025)
Source: The Copper Price is the year-end price measured by LMCADY Comdty. Chilean production data sourced from the USGS https://www.usgs.gov/centers/national-minerals-information-center/copper-statistics-and-information
Copper Flows to the U.S. as Tariff Risk Builds
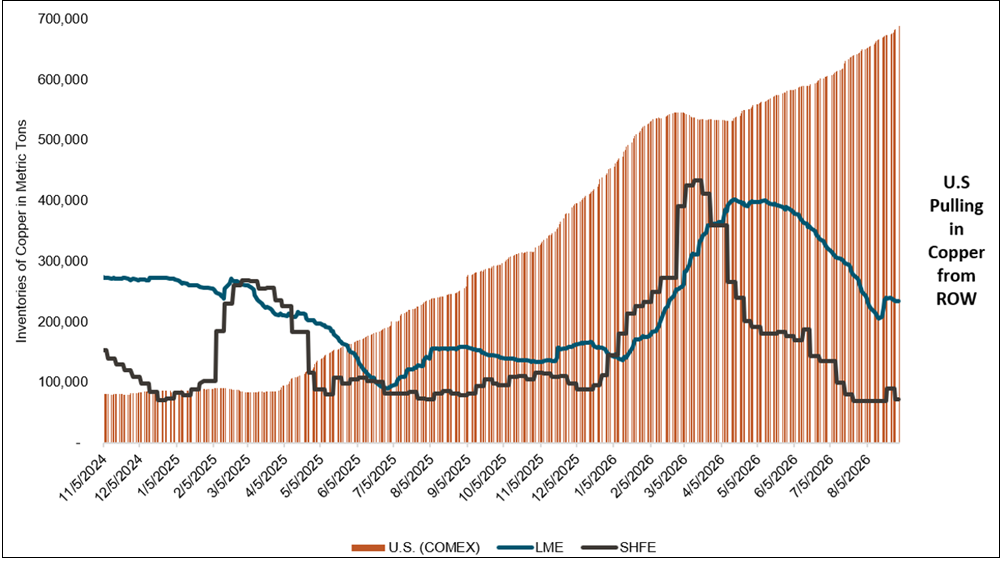
Record copper shipments into the U.S. intensified an already constrained global market in August. U.S. copper cathode imports reached a record 223,000 metric tons in July, compared with a typical July range of 37,000 to 80,000 metric tons in the years before 2024.15 The dramatic increase was driven by traders moving copper into the U.S. to capture elevated U.S. prices and acquire metal ahead of a potential tariff on refined copper. As those shipments accelerated, COMEX inventories rose 712% from February 2025 to August 2026, while inventories on the London Metal Exchange (LME) and Shanghai Futures Exchange (SHFE) fell (Figure 3), squeezing copper supply across the rest of the world.
Figure 3. U.S. Copper Inventory Flows Sequester Copper (2024-2026)
Source: Bloomberg. Data as of 08/31/2026.
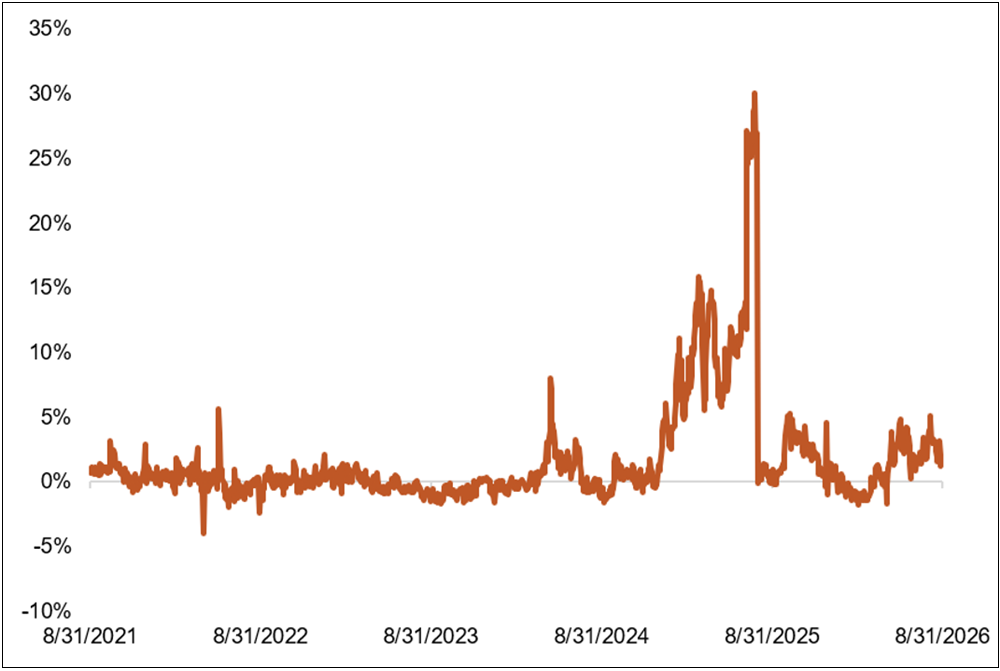
The tariff trade began in February 2025, when the Trump administration launched a national-security investigation into copper imports. Expectations that a proposed 50% tariff would include refined copper prompted traders to rush metal into the U.S., pushing COMEX copper to a premium of more than 30% over the LME (Figure 4). However, when finalized in July, the tariff covered only semi-finished copper products and certain copper-intensive manufactured goods. Refined copper was excluded, triggering a sharp COMEX sell-off and returning the premium toward its historical near-parity level. Commerce also recommended phased tariffs on refined copper of 15% from January 1, 2027, and 30% from January 1, 2028, subject to a presidential decision.16
Tariff headlines are reshaping copper flows and prices.
The trade regained momentum in 2026 as the proposed implementation date approached, with no final decision. The COMEX premium again widened, exceeding 5% in August (Figure 4). Tariff expectations, along with support from strong underlying fundamentals, added to price vulnerability to policy headlines. On September 10, after the reporting period, copper fell more than 4% following reports that the White House had delayed its decision. Mining equities also sold off sharply as some of the tariff premium unwound.
The reported delay was attributed to affordability concerns ahead of the November midterm elections, but it did not resolve the question of whether tariffs would ultimately be imposed. In our view, that uncertainty preserves an incentive to hold copper in the U.S., retaining the potential value of its location and avoiding the cost of moving it elsewhere.
An advance tariff announcement could intensify the squeeze as traders and industrial buyers accelerate shipments before duties take effect. A definitive decision against tariffs would likely unwind part of the trade, releasing some U.S.-held copper to international markets. Until then, tariff expectations are likely to remain an important influence on copper prices and global inventories.
Figure 4. COMEX-LME Copper Premium Volatility (2021-2026)
Source: Bloomberg. Data as of 08/31/2026.
Looking Ahead: Structural Tightness Supports the Copper Outlook
The copper market will likely remain sensitive to evidence that recent supply pressures are easing. Chile’s anticipated production recovery requires improved performance across several major operations following a prolonged period of missed expectations. At the same time, growth from the Democratic Republic of the Congo remains important to the global balance. Sulfuric acid availability warrants attention as existing inventories and procurement contracts are drawn down. U.S. tariff policy will provide another source of volatility, with continued uncertainty likely to influence the COMEX-LME premium, the location of global inventories and copper’s availability outside the U.S.
Strong demand and tight supply create powerful leverage for copper miners.
Demand is also becoming more closely tied to strategic priorities. Electricity grids, copper’s largest end-use market, are gaining urgency as governments place greater emphasis on energy security. The war in Iran and disruption through the Strait of Hormuz have demonstrated the vulnerability of systems dependent on internationally traded fossil fuels. Countries directly reliant on disrupted routes can face physical shortages, while others remain exposed to global price shocks. Investment in domestic generation, diversified energy systems and expanded electricity networks offers a way to reduce that exposure, with copper serving as a critical input throughout the grid.
AI data centers and defense programs add smaller but rapidly growing sources of consumption. Data center expansion requires significant investment in power generation, grid connections, electrical equipment, cabling and cooling infrastructure. Copper generally represents a small portion of the total cost of these systems, making procurement relatively insensitive to copper prices when the underlying investment is tied to national security, system reliability or computing capacity. This enables strategic consumers to continue securing metal even at elevated prices.
The contrast between strategic demand and a slow mine supply response is translating into exceptional producer economics. The copper price increased 47.08% over the 12 months through August, driving AISC margins to unprecedented levels. Copper concentrate scarcity has added to this strength, reversing the traditional relationship in which miners paid smelters' treatment and refining charges, and shifting greater value toward the miner. These margins do not require another immediate increase in copper prices to remain favorable, as sustained prices near current levels may allow producers to realize significantly stronger year-over-year earnings and free cash flow across a full reporting period.
A strong investment environment may encourage brownfield expansions, project partnerships and acquisition activity, but the physical supply response will remain gradual. Copper projects take an average of approximately 17.5 years to advance from discovery to production, and the volume of copper discovered since 2000 remains below the total discovered during the 1990s alone.17 Higher prices improve project economics, but they cannot compress every stage of development or quickly replenish the discovery pipeline.
We believe pure-play copper miners may offer the clearest exposure to this environment. Only three of the world’s 10 largest copper producers are publicly traded pure-play copper companies, leaving the benefits of higher copper prices diluted across the broader commodity portfolios of diversified miners (Figure 5). Pure-play producers provide more direct participation in copper’s operational leverage and margin expansion and, therefore, we believe they are best positioned in this environment.
Figure 5. Investing in Copper Miners
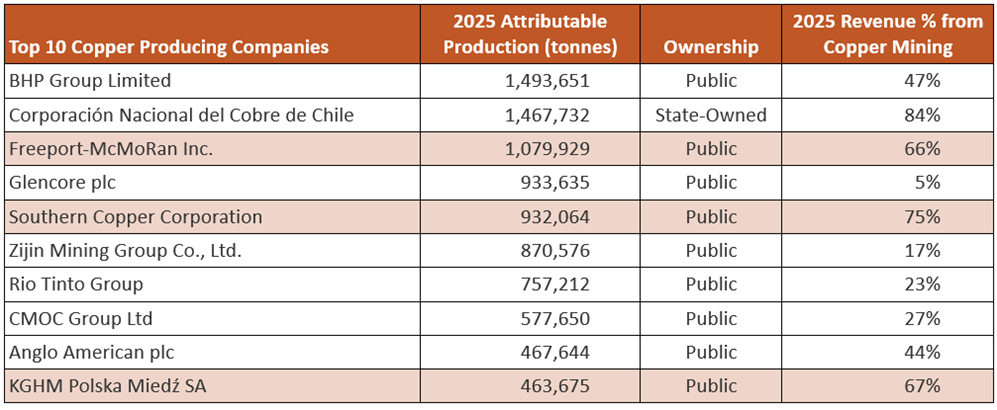
Source: S&P Capital IQ, Bloomberg and company financial statements. Data for 2025. The table above is included solely to illustrate the top copper-producing companies by raw copper production and/or percentage of copper-related revenue. There is no guarantee the companies were or will be profitable.
Footnotes
| 1 | The copper spot price is measured by the LME Copper Cash ($), Bloomberg ticker LMCADY. |
| 2 | The Nasdaq Sprott Copper Miners™ Index (NSCOPP™) is designed to track the performance of a selection of global securities in the copper industry; the Index was co-developed by Nasdaq® and Sprott Asset Management LP. |
| 3 | Nasdaq Sprott Junior Copper Miners™ Index (NSCOPJ™) is designed to track the performance of mid-, small- and micro-cap companies in copper-mining related businesses; the Index was co-developed by Nasdaq® and Sprott Asset Management LP. |
| 4 | The Bloomberg Commodity Index (BCOM) is a broadly diversified commodity price index that tracks prices of futures contracts on physical commodities and is designed to minimize concentration in any one commodity or sector. It currently has 23 commodity futures in six sectors. |
| 5 | The S&P 500 or Standard & Poor's 500 Index is a market-capitalization-weighted index of the 500 largest U.S. publicly traded companies. |
| 6 | Source: ICSG Press Release - August 2026 (International Copper Study Group Monthly Press Release). |
| 7 | Source: Reuters, LME gripped by 'flash squeeze' as copper tensions boil over, 8/19/2026. |
| 8 | Source: USGS: Mineral Commodity Summaries 2026, Copper. |
| 9 | Source: Mining.com, Copper output from Chile's Codelco dips in July, 9/10/2026. |
| 10 | Source: Mining.com, Copper output from Chile's Codelco dips in July, 9/10/2026. |
| 11 | Source: Bloomberg: Codelco Abandons Copper Growth Target as Mine Setbacks Mount, 8/12/2026. |
| 12 | Source: Reuters: Antofagasta first-half earnings rise as higher copper prices offset output decline, 8/13/2026. |
| 13 | Source: Mining.com: Lundin Mining cuts copper outlook as Chile storms strike again, 8/19/2026. |
| 14 | Source: BHP Operational Review for the Year Ended 30 June 2026. |
| 15 | Source: LinkedIn Pulse: U.S. Monthly Copper Cathode Imports Hit All-Time High, 9/4/2026. |
| 16 | Source: Presidential Actions, Adjusting Imports of Copper into the U.S., 7/30/2025. |
| 17 | S&P Global, “Copper discoveries 2026 – Expansion over addition as new discoveries lag”, 08/27/2026. |


Investment Risks and Important Disclosure
Relative to other sectors, precious metals and natural resources investments have higher headline risk and are more sensitive to changes in economic data, political or regulatory events, and underlying commodity price fluctuations. Risks related to extraction, storage and liquidity should also be considered.
Gold and precious metals are referred to with terms of art like "store of value," "safe haven" and "safe asset." These terms should not be construed to guarantee any form of investment safety. While “safe” assets like gold, Treasuries, money market funds and cash generally do not carry a high risk of loss relative to other asset classes, any asset may lose value, which may involve the complete loss of invested principal.
Past performance is no guarantee of future results. Investments, commentary and statements are unique and may not be reflective of investments and commentary in other strategies managed by any other Sprott entity or affiliate. Opinions expressed in this presentation are those of the presenters and may vary widely from opinions of other Sprott affiliates. Forward-looking language should not be construed as predictive. While third-party sources are believed to be reliable, Sprott makes no guarantee as to their accuracy or timeliness. This information does not constitute an offer or solicitation, nor an investment advice or recommendation, and may not be relied upon or considered to be the rendering of tax, legal, accounting or professional advice.