View the monthly commentary on Copper, Lithium and Nickel.
View Critical Materials March 2024 Performance Table
Key Takeaways
- The Nasdaq Sprott Energy Transition Materials Index rose in March, boosted by strength in copper and silver markets as global economic conditions continued to improve.
- Battery storage technology is central to the energy sector’s transformation as it integrates renewable energy sources into power grids worldwide.
- The energy storage sector is poised for expansion, with a 27% compound annual growth rate (CAGR) projected for storage deployments worldwide to 2030—a key factor in the expected 10x rise in global lithium demand over the next two decades.
- Propelling the battery storage revolution are advancements in battery chemistries, especially the shift toward lithium iron phosphate (LFP) batteries for stationary storage due to their cost-effectiveness and higher cycle life.
- Energy shifting is the dominant use case for battery storage, constituting 65% of total deployments in 2023 and is expected to rise to 69% by 2025. This application is critical to enhancing grid efficiency and reliability and enabling the smooth integration of renewable energy sources into power grids.
March in Review
The Nasdaq Sprott Energy Transition Materials (NSETM) Index rose by 54.93 points or 6.07% in March to close the month at 960.53. The NSETM Index was down 2.58% in the first quarter, but with a wide dispersion of component returns—copper and uranium miners soared while lithium and nickel miners remained under negative pressure.
There has been a recovery in commodities and cyclical sectors like mining and energy.
Global central banks—including the Swiss National Bank, the Bank of England, the U.S. Federal Reserve (Fed), the European Central Bank and the People's Bank of China—have recently taken a dovish stance, either reducing interest rates or indicating imminent cuts. This pivot marks the most significant wave of monetary easing since the COVID-19 crisis, as over 50 rate cuts were announced globally in the last three months. The shift signals a broader adoption of policies aimed at stimulating economic growth as concerns over inflation diminish, especially from the Fed, paving the way for more rate cuts and looser financial conditions.
As a result, there has been a recovery in commodities and cyclical sectors like mining and energy. We expect this expansion to support the entire energy transition sector, which in our view is now positioned more favorably than it has been for two years. Several contributing factors have set a promising macroeconomic backdrop for the energy transition group, including: 1) the resurgence of the global reflation trade, signaling a bullish outlook for commodities and cyclical sectors as central banks initiate an easing cycle; 2) uranium nearing the end of its initial correction phase and gearing up for its next expected rise; 3) an overall broadening of market breadth and risk-taking; 4) improved economic data from China; and 5) the NSETM Index approaching the conclusion of its two-year consolidation phase.
The broad market has been soaring as the Fed maintains its outlook for three rate cuts in 2024, the economic growth outlook improves, inflation (though bumpy) keeps tracking lower, and the U.S. Treasury continues to place more bond issuance into the short end of the yield curve. In equities, a phenomenal growth outlook for artificial intelligence has sparked higher earnings revisions, while financial conditions remain highly accommodative, allowing ample scope for expansion in price multiples. The prospect of a soft landing, moderating inflation, accommodative central banks, ample system liquidity, the secular AI growth engine and easy financial conditions have fueled this "everything rally."
Figure 1. Nasdaq Sprott Index Continues to Consolidate
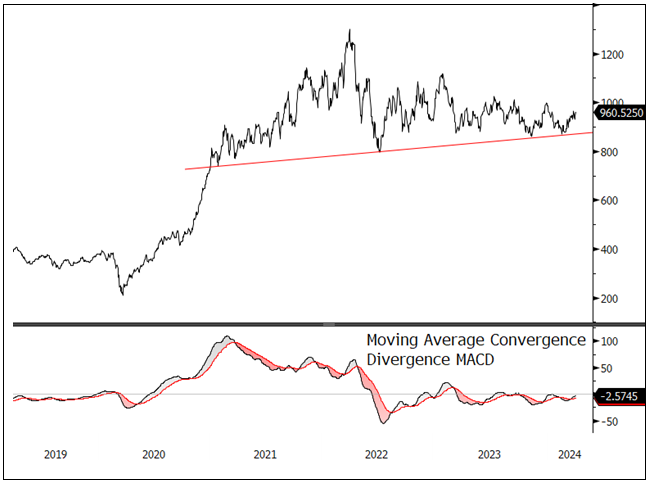
Source: Bloomberg. Nasdaq Sprott Energy Transition Materials Index. Data as of 3/31/2024. Moving average convergence/divergence is a trend-following momentum indicator that shows the relationship between two exponential moving averages (EMAs), calculated by subtracting the 26-period EMA from the 12-period EMA. Included for illustrative purposes only. Past performance is no guarantee of future results.
Battery Storage: The Road to Sustainability
In recent years, the energy sector has experienced a remarkable transformation, primarily driven by the rapid growth and integration of renewable energy sources. Central to this transition is the advancement of battery storage technology, a critical enabler that promises to reshape how we generate, distribute and consume electricity. As we examine this evolving landscape, it becomes evident that battery storage is a technological cornerstone for a sustainable energy future.
Storage Deployment Ramp-Up
We believe the energy storage sector is poised for a remarkable expansion, with deployments expected to rise to 42 gigawatts (GW) in 2023, a 155% increase from 2022 (see Figure 2). Globally, the sector is projected to have a 27% CAGR to 2030, when yearly additions are expected to reach 110 GW. China is leading the way, bolstered by substantial government investment and favorable policies.
Europe, the Middle East, Africa and the Americas are all setting targets and creating subsidies to hasten project development and help power markets integrate energy storage solutions, especially for shifting energy demands. Utility decarbonization strategies in the Americas rely on the deployment of energy storage systems. Some governments are making power market reforms to create more sustainable revenue streams for energy storage projects, signaling a shift toward more enduring solutions.
Figure 2. Rapid Expansion in Battery Storage (2015-2030E)
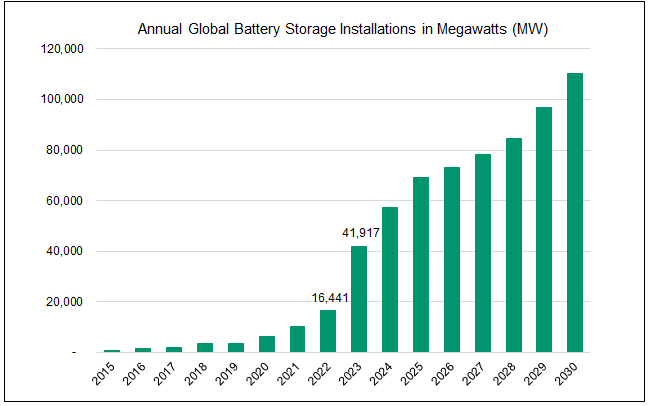
Source: BloombergNEF. Energy Storage Market Outlook, 2H 2023. Included for illustrative purposes only. Past performance is no guarantee of future results.
The progress of the energy storage industry is closely tied to trends in government policy and investment as countries around the world recognize the importance of energy storage. Governments are taking steps that range from direct subsidies to broader market reforms in efforts to address regulatory challenges and connectivity issues. Such measures are crucial for removing obstacles, promoting growth within the sector and paving the way for new energy technologies. An approach that combines policy support, financial incentives and strategic investment is clearly in play and would boost the uptake and expansion of energy storage technologies globally.
Chemistry Drives the Transformation
Advancements in battery chemistries are propelling the battery storage revolution. Notable among them is the shift of stationary storage toward lithium iron phosphate (LFP) batteries due to their cost-effectiveness and higher cycle life (the number of charge and discharge cycles a battery can undergo while maintaining optimal performance). This shift is reshaping the market’s dynamics, with LFP batteries increasingly preferred over nickel manganese cobalt (NMC) chemistries for stationary storage.
Battery storage has broad applications that span energy shifting, ancillary services and storage solutions for both commercial and residential sectors, showcasing its flexibility and its critical role in meeting the complex demands of the energy sector (see Figure 3).
An approach that combines policy support, financial incentives and strategic investment would boost the uptake and expansion of energy storage technologies globally.
Energy shifting, a tactic to manage the electric grid by getting customers to move their energy use away from peak times, is the dominant use. It consists of 65% of total deployments in 2023 and is expected to rise to 69% by 2025, primarily driven by mandates in China. The energy shifting category encompasses renewable integration, price arbitrage and capacity services.
Energy shifting has become a pivotal application in the energy sector. It is critical to enhancing grid efficiency and reliability by aligning energy supply with demand. It also plays a critical role in integrating renewable energy sources into the grid, diminishing dependence on fossil fuel-powered peaker plants (power stations that operate during high-demand periods), and steering the energy system toward greater sustainability. Energy storage systems are an important part of balancing the intermittent nature of renewable energy supply with demand, ensuring grid reliability and fostering the transition toward clean energy. The growing deployment of battery storage solutions, both in utility-scale and residential markets, highlights their vital contribution to establishing a grid powered predominantly by renewable sources.
Among other battery storage applications, ancillary services like frequency regulation, voltage support, reserve power and black start (the process of restoring power generating operation after an outage), all of which benefit from the rapid response features of batteries, represent a smaller segment. This segment had an 8% share in 2023 and is expected to stabilize around 5% by 2030, despite growing market opportunities.
Commercial storage (peak shaving, load shifting, backup, etc.) is expected to expand from 7% of deployments in 2023 to 11% by 2030 (source: BloombergNEF). Residential storage (using stored energy during peak rates, backup power, etc.) is forecast to increase from 14% to 17% in the same period, fueled by the surge in energy bills (source: BloombergNEF). Integrating smart grid technologies with advancements in battery storage, especially LFP batteries known for their high energy density and scalability, is vital for advancing toward more sustainable, reliable and economically viable energy systems.
Figure 3. Battery Storage’s Many Uses
Energy Shifting |
Description |
|
Enhancing Grid Stability |
Enables balanced supply and demand on the grid, which is crucial for maintaining a stable and reliable electricity supply as variable renewable energy sources increase. |
|
Increasing Renewable Energy Utilization |
Enables greater integration of renewable energy into the grid by storing excess energy during times of surplus rather than wasting it. |
|
Reducing Energy Costs |
Saves money for consumers and utilities by storing energy when prices are low (typically off-peak) and using or selling it back to the grid when prices are high. |
|
Decreasing Reliance on Peaker Plants |
Reduces the need for peaker plants, which often run on fossil fuels, to meet peak demand, lowering greenhouse gas emissions and pollution. |
|
Improving Energy Efficiency |
Reduces the need for excessive energy generation and infrastructure expansion by aligning energy supply more closely with demand, leading to a more efficient energy system. |
Other Uses & Types |
Key Applications |
|
Ancillary Services |
Frequency regulation, voltage support, operating reserves, black start capability. |
|
Commercial Storage |
Peak shaving, demand response, load shifting, renewable energy integration, backup power, energy efficiency improvements. |
|
Residential Storage |
Self-consumption, time-of-use optimization, backup power, energy independence, grid services. |
Sources: Sprott Asset Management and BloombergNEF.
Trends in Battery Technology
LFP is leading the way in battery technology due to its favorable economics and performance characteristics. However, the emergence of sodium-ion batteries and the ongoing development of other chemistries point to a diverse and evolving market that caters to various applications and regional preferences. Our December 2023 Critical Materials Commentary provides a more detailed discussion on current trends in battery technology, including:
- Lithium-Iron Phosphate Dominance: LFP has emerged as the leading lithium-ion battery chemistry in stationary storage, driven by its cost-effectiveness, longer cycle life and significant scale-up in manufacturing capacity.
- Global Expansion and Competition: Companies outside China are starting to manufacture energy storage systems (ESS) using LFP. This development indicates a shift away from higher-cost chemistries like NMC and NCA (nickel cobalt aluminum oxide), which are expected to drop to a mere 3% market share by 2030 from 70% in 2020. Note that NMC and NCA both use lithium in their chemistry.
- Sodium-Ion Batteries: Sodium-ion batteries are expected to begin volume manufacturing for ESS around 2025. China plays a significant role in their development and promotion by nationalizing standards and commercialization. Sodium batteries are challenged by having lower energy density and shorter life span than lithium-ion batteries while potentially having a lower cost and environmental impact.
- Cost Comparisons and Preferences: LFP is much more cost-effective than NMC, with nearly 25% lower raw material costs and a slower degradation rate, making it more suitable for energy shifting applications.16 While declining in market share, NMC batteries are still used due to their higher energy density and agreements with U.S. and European offtakers.
- Technology Trends and Selection: The choice between lithium-based and sodium-based batteries for ESS will likely depend on the specific performance requirements of each project and developers' preferences regarding upfront costs versus the levelized cost of electricity stored. Performance improvements in sodium-ion batteries, alongside the supply-chain scaling, are expected to accelerate.
Storage Holds the Key to Lithium Demand
While EV applications are expected to be the dominant demand driver for lithium, the fasting-growing source of lithium demand comes from grid storage batteries (see Figure 4). The International Energy Agency (IEA) forecasts total annual global lithium demand will rise to 1,382 Kt by 2045 compared to 130 Kt in 2022 (962% cumulative growth, or 11% per year compounded). Most of this demand (around 86% by 2035) is expected to come from the EV sector (1,582% cumulative growth to 2045, or 13% per year compounded). Grid battery storage is expected to grow even quicker (2,373% cumulative growth to 2045, or 15% per year compounded), rising from 2.6% of total lithium demand to 6.3% by 2040.
In our view, the staggering increase in electricity demand expected from AI-related data centers is expected to entail a higher growth rate in grid storage batteries.
Reshoring the United States' industrial and manufacturing base will likely continue under any future administration. In our view, the staggering increase in electricity demand expected from AI-related data centers is expected to entail a higher growth rate in grid storage batteries.
As these batteries are increasingly deployed, their overall costs are expected to decline. BloombergNEF estimates that the mid-case levelized cost of electricity (LCOE) for a four-hour utility-scale battery will decrease by 45% from 2023 to 2030 ($144 MWh to $79 MWh). By 2045, LCOE is estimated to reach $61 MWh, a decrease of 58% from 2023. This is similar to the trend in photovoltaics where growth in deployments triggered dramatic cost declines, in turn spurring further growth.
Figure 4. Expected Boom in Grid Storage Will Drive Demand for Lithium (2022-2050E)
Grid Storage Battery Growth Under IEA Net-Zero Scenario
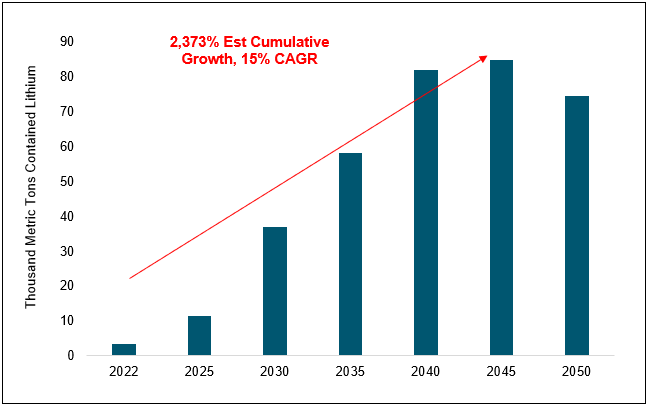
Source: IEA Critical Minerals Market Review 2023. Included for illustrative purposes only. Past performance is no guarantee of future results.
Solving the Grid
Battery storage technology is experiencing a pattern of ongoing innovation. Lithium-ion technology is leading due to its high energy densities and prolonged lifespans, making it ideal for widespread applications. On the horizon, emerging technologies like solid-state and flow batteries may address some limitations faced by current battery solutions, potentially improving safety, capacity and efficiency. However, lithium-ion batteries have a commanding lead and entrenched position due to their well-established infrastructure, proven reliability, energy density and capacity.
Expanding battery storage capacity offers a pragmatic solution to transmission grid problems, reducing the need for upgrades by easing thermal overload, safeguarding infrastructure, balancing demand and generation discrepancies, and enhancing system reliability. It can also be a vital part of the process of integrating renewable energy sources into grids and reducing grid infrastructure investment costs. At the same time, demand management and grid modernization also play vital roles in the drive to ensure the sustainability and reliability of power systems. This integrated approach underscores the importance of technological evolution in tandem with strategic infrastructure development to meet future energy demands efficiently.
Updates on Critical Materials
Copper: Setting Up for Success
The copper spot price rose 4.34% to $3.98 per pound in March (see Figure 7), breaking through the twin barriers of $4 per pound and $9,000 per metric ton during the month. Copper miner stocks provided additional leverage by rising 17.99%, while shares of copper juniors went up by 18.22%.
In previous months, copper had been holding steady due to a tug-of-war between strong fundamentals and mixed economic data. In March, the stars aligned for the copper market, as continued positive supply-demand developments coincided with strong economic data. In the U.S., moderating inflation expectations boosted market sentiment when the Fed indicated it was still forecasting three interest rate cuts by the end of the year. Central banks have largely been synchronized in this supportive monetary policy, as indicated by the 50-plus rate cuts announced globally in the last three months.
Copper has benefited from this easing cycle since easier conditions for economic growth correlate with greater demand for copper. “Dr. Copper” is an economic bellwether used in numerous areas of the economy such as construction, electronics and transport. The growth impetus could be seen, for example, in the Global Purchasing Managers’ Index (PMI) which reached 52.3 in March, a nine-month high.17 (Readings higher than 50 indicate economic expansion.)
With the improvement in business cycle conditions, copper may be set up for continued success for several reasons. For one, it has historically performed well in expansionary economic phases. Further, interest rate cuts in a non-recessionary environment have typically led to higher commodity prices (see Figure 5). Copper is predisposed to these conditions and is currently the stongest-performing commodity featured in the analysis below. Notably, copper mining stocks have also provided further leverage to increases in the copper spot price. Historically, there is a very strong correlation of 0.88 between copper mining stocks and the copper spot price, and mining stocks have typically almost doubled moves in the spot price as measured by a beta of 1.8.18
Figure 5. Rate Cuts Drive Commodity Prices
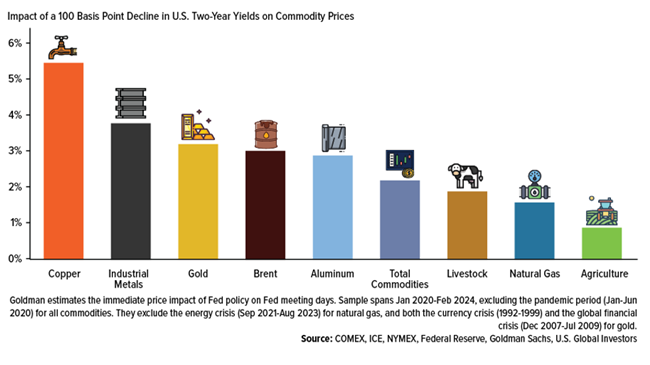
Source: COMEX, ICE, NYMEX, U.S. Federal Reserve, Goldman Sachs, U.S. Global Investors. Included for illustrative purposes only. Past performance is no guarantee of future results.
Elsewhere, treatment charges to turn copper concentrate into refined metal have plummeted in 2024. Treatment charges are the fees smelters charge miners, and a lower fee means a smaller margin for the smelter and a tighter mine supply. They have now fallen below $10 per metric ton, far below the previous $80 to $100 level.19
As these fees have collapsed, smelters' profitability has fallen to such an extent that the Chinese smelters held a crisis meeting in March in which they agreed to curtail production. Though no aggregate limits were specifically set, they pledged to rearrange maintenance work, reduce utilization rates and delay the start of new projects. Further, smelters are also buying more copper scrap instead of concentrate, causing the copper scrap discount to shrink. Following the meeting, Bloomberg reported that Chinese smelters were proposing a 5% to 10% production cut.20
Treatment charges are at the lowest levels in a decade, but they have been this low before. The last three times treatment charges fell below $30, copper prices rose 20%, 11% and 24% in the following three months (see Figure 6).
Figure 6. Copper: Bucking the Trend of Price Changes After Falling Treatment Charges (1999-2021)
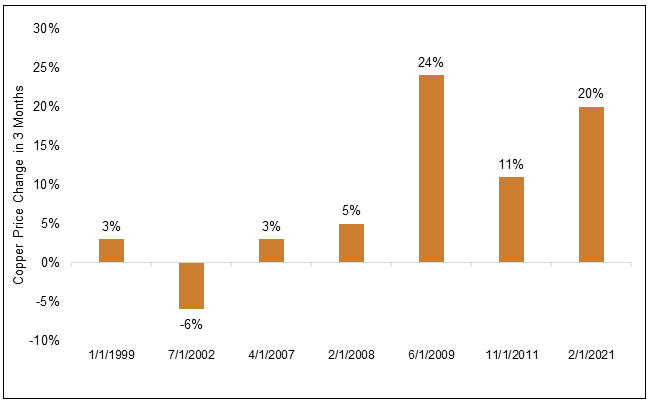
Source: Copper prices from LME; TC/RCs from Wood Mackenzie. Analysis covers periods in time during which copper TC/RCs fell below $30/tonne since 1999. Included for illustrative purposes only. Past performance is no guarantee of future results.
Notably, China produces half of the world’s refined copper, and any reduction in refined copper supply can potentially lead to a supply squeeze. Going forward, we believe China’s continued investment in the midstream will drive growth in copper smelter production to outpace increases in global copper mine supply.
Chinese copper smelters are not the only ones struggling. Smelters in Zambia are also being disrupted as the country is in the midst of an El Niño-induced power crisis and has been rationing electricity.21 These disruptions come at a time when the copper market has already been pushed into a supply-demand deficit. Recent months have seen the closure of the Cobre Panama mine (which represented around 1.5% of global copper production) and copper production cuts from Anglo American. Meanwhile Codelco, the largest copper miner in the world, is producing at its lowest level in 25 years and further having to suspend mine operations in March at its Radomiro Tomic mine, the world’s twelfth-largest copper mine.
We believe that the copper market is entering a period of escalating deficits as constrained supply meets rising demand from increased electricity usage among developing countries and developed countries’ immense electricity needs for new technologies like AI. Further, we believe this will benefit the copper spot price and, ultimately, copper miners.
Figure 7. A Healthy Global Economy Boosts “Dr. Copper” (2019-2024)
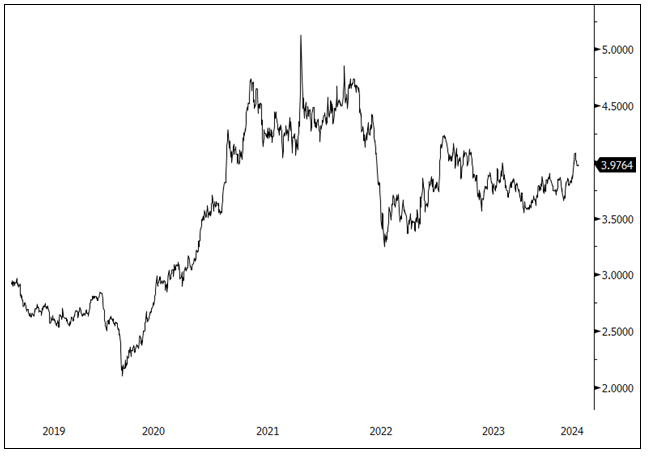
Source: Bloomberg. Copper spot price, $/lb. Data as of 3/31/2024. Included for illustrative purposes only. Past performance is no guarantee of future results.
Lithium: Is the Worst Over?
The lithium carbonate spot price rose by almost 15% in the first half of March before retreating, ending the month up 5.35%, making its overall year-to-date rally 9.46%. Lithium has begun recovering as its precipitous decline from previous highs appears to have ended (see Figure 8).
We believe the lithium price will need to rise to incentivize supply in the longer term.
However, even with lithium’s recent increase, we believe the current price remains below a sustainable level and will need to rise to incentivize supply in the longer term. In the meantime, the lithium supply is shrinking, with project curtailments and cuts to lithium growth plans likely to exacerbate significant supply deficits anticipated later this decade. Chinese supply has become susceptible to disruption. Much of China’s lower-grade and higher-cost source of lithium, lepidolite, is no longer economical. Further, China’s recent environmental probe in a top production hub may spur further disruptions.22
Bloomberg reports that as a result of these factors, “UBS Group AG and Goldman Sachs Group Inc. have trimmed their 2024 supply estimates by 33% and 26%, respectively, while Morgan Stanley warned about the growing risk of lower inventories in China.”23 Given the thinning market, investors with short positions may need to consider unwinding positions due to a potential market bottoming. There are significant short positions in several top lithium producers that due to these supply cuts, may be under threat. Short positions in Albemarle Corp. and Pilbara Minerals Ltd., for example, account for more than 20% of their outstanding shares.
Demand for electric vehicles (EVs) continues to increase, additionally bolstered by a stringent new rule in the U.S. that further limits auto emissions, thus compelling automakers to rapidly boost EV sales.24 In our view, there is no real alternative for lithium in EVs. Despite a perceived slowdown, global EV sales increased from 10.5 million in 2022 to 14 million in 2023, and are forecast to increase to 16.7 million in 2024. Ultimately, we believe EV penetration rates will continue to rise, potentially increasing demand for lithium and benefitting lithium miners.
National interests in the lithium market continue to develop. The industry is being transformed by the growing importance of reshoring and friendshoring, as well as new industrial policies and fresh investment. Lithium Americas received a record $2.26 billion loan from the U.S. Department of Energy to develop a Nevada lithium deposit.25 It came in the wake of General Motors’ $650 million equity investment in Lithium Americas, the largest investment by an automaker in a raw materials producer disclosed to date. The loan and investment together give Lithium Americas most of the capital it needs to fund an initial 40,000 tonnes per year of battery-grade lithium carbonate production (Phase 1) at its Thacker Pass mine in Nevada. The investment gives GM exclusive rights to 100% of Lithium Americas’ lithium production from Phase 1 for up to 15 years, and a right of first offer on Phase 2 production.
Similarly, in March, Australian producer Liontown Resources secured a A$550 million loan from Australian banks and government agencies as it aims to begin production this year.26
These loans represent a substantial step in strengthening various countries’ critical materials supply chains, and we expect the trend to continue to bolster critical mineral miners.
Figure 8. Lithium: Optimism Drives a Year-to-Date Rally (2019-2024)
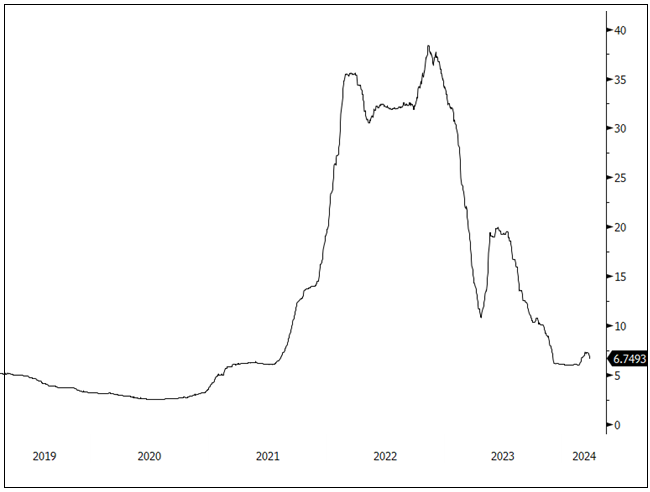
Source: Bloomberg. Lithium carbonate spot price, $/lb. Data as of 3/31/2024. Included for illustrative purposes only. Past performance is no guarantee of future results.
Nickel: Indonesia Undermines the Market
The nickel spot price fell 6.23% in March to end the month at $7.52 per pound (see Figure 9). Nickel miner stocks fared better over the same period, gaining 3.07%. Nickel fell after Indonesia, the world’s largest nickel producer, announced that it is expediting approvals of production quotas known as RKABs (work plan and budget approvals). Nickel supply has increased rapidly in recent years, with Indonesia producing 1.8 million metric tons in 2023 compared to 760,000 in 2020. Indonesia now accounts for half of global supply, and some estimates predict that the country will produce more than 75% of global supply during the 2022–2029 period.27 The winner of the recent Indonesia election, Prabowo Subianto, has publicly stated that he will continue the resource nationalism policies of his predecessor, Joko Widodo. These policies aim to turn Indonesia into a global nickel powerhouse to meet the growing demand from the EV battery and stainless steel industries.28
Several European car makers are in the process of establishing EV plants in Indonesia, including Citroen, Renault and Volkswagen, following in the footsteps of Chinese automakers. Both China and Europe view Indonesia as a production base for EVs, particularly entry-level cars. China continues to dominate investment in Indonesia’s EV industry, led by companies like BYD, Wuling, Chery and Great Wall Motors.29
Like lithium, closures of higher-cost mines, most recently in New Caledonia, are reducing the current nickel surplus that resulted from increased low-cost Indonesian production. In a move to bail out its nickel industry, the French government approved a $152 million bridge loan to nickel miner Prony Resources in New Caledonia, which has suffered because of the fall in nickel prices and the boom in Indonesian nickel production. New Caledonia continues to struggle with low-cost output from Indonesia but has long been a major source of nickel production.
Despite the current supply glut, we believe nickel’s long-term fundamentals are strong. Significant amounts of nickel will likely be needed in future years for companies and governments to reach net-zero emissions targets. Many big economies, including Australia, have listed nickel as a critical mineral. Stricter emission mandates are also helping to boost the nickel industry, particularly in the U.S., where the Environmental Protection Agency is imposing mandates that could require nearly two-thirds of new cars and light trucks sold to be EVs by 2032.30 As with copper and other commodities, we believe moves by global central banks to reduce interest rates will also support the nickel market, given that lower rates generally lessen the cost of carrying inventories, and thus provide support for nickel prices.
Figure 9. Nickel: Supply Up, Prices Down (2019-2024)
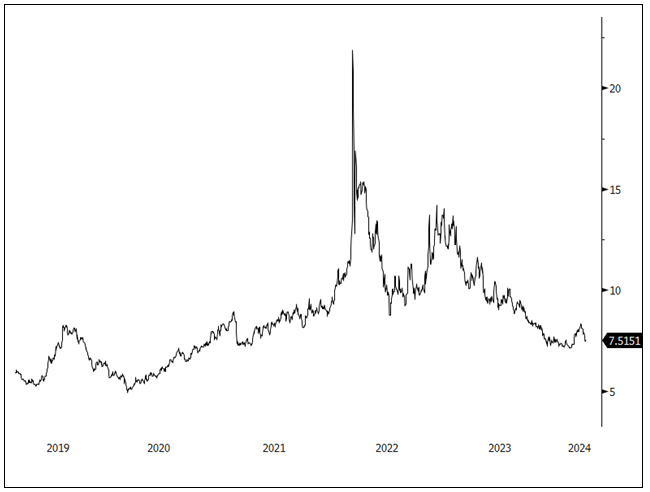
Source: Bloomberg. Nickel spot price, $/lb. Data as of 3/31/2024. Included for illustrative purposes only. Past performance is no guarantee of future results
Critical Materials: March 31, 2024 Performance
| Metric | 3/31/24 | 2/29/24 | Change | % Chg | YTD Chg | Monthly Comment |
| Miners | ||||||
| Nasdaq Sprott Energy Transition Materials™ Index1 | 960.53 | 905.60 | 54.93 | 6.07% | (2.58%) |
With the Fed reaffirming 3 rate cuts for 2024, and the global central bank rate easing cycle beginning, the reflation trade has taken hold. Commodity-cyclicals (e.g., copper and copper miners) are the high beta version of this reflation trade, as reflected by March's stroking returns. |
| Nasdaq Sprott Lithium Miners™ Index2 | 573.01 | 600.76 | (27.75) | (4.62)% | (22.20%) | |
| North Shore Global Uranium Mining Index3 | 3,944.87 | 3,877.09 | 67.78 | 1.75% | 2.56% | |
| Nasdaq Copper Miners Index4 | 1,217.09 | 1,031.56 | 185.54 | 17.99% | 16.33% | |
| Nasdaq Sprott Nickel Miners™ Index5 | 597.13 | 579.36 | 17.78 | 3.07% | (9.66%) | |
| Nasdaq Sprott Junior Copper Miners™ Index6 | 1,089.77 | 921.82 | 167.96 | 18.22% | 12.65% | |
| Nasdaq Sprott Junior Uranium Miners™ Index7 | 1,569.99 | 1,531.34 | 38.65 | 2.52% | 7.92% | |
| Physical Materials | ||||||
| Lithium Carbonate Spot Price $/lb8 | 6.75 | 6.40 | 0.34 | 5.35% | 9.46% |
Recovering from unsustainable lows. |
| U3O8 Uranium Spot Price $/lb9 | 88.00 | 95.00 | (7.00) | (7.37%) | (3.30%) |
Nearing the end of a short-term correction. |
| LME Copper Spot Price $/lb10 | 3.98 | 3.81 | 0.17 | 4.34% | 3.58% |
Breaks out on strong economic data and fundamentals. |
| LME Nickel Spot Price $/lb11 | 7.52 | 8.01 | (0.50) | (6.23%) | 1.18% |
A pullback on Indonesian supply. |
| Benchmarks | ||||||
| S&P 500 Index12 | 5,254.35 | 5,096.27 | 158.08 | 3.10% | 10.16% |
The broad market closed at new all-time highs as the economic outlook improved, inflation came under control, and the Fed and other central banks began rate-cutting cycles while maintaining very market-friendly financial conditions. |
| DXY US Dollar Index13 | 104.55 | 104.16 | 0.39 | 0.37% | 3.17% | |
| BBG Commodity Index14 | 99.49 | 96.70 | 2.79 | 2.89% | 0.85% | |
| S&P Metals & Mining Index15 | 3,085.70 | 2,892.04 | 193.66 | 6.70% | 0.72% | |
*Mo % Chg and YTD % Chg for this index are calculated as the difference between the month end's yield and the previous period end's yield, instead of the percentage change. BPS stands for basis points.
| 1 | The Nasdaq Sprott Energy Transition Materials™ Index (NSETM™) is designed to track the performance of a selection of global securities in the energy transition materials industry, and was co-developed by Nasdaq® and Sprott Asset Management LP. |
| 2 | The Nasdaq Sprott Lithium Miners™ Index (NSLITP™) is designed to track the performance of a selection of global securities in the lithium industry, including lithium producers, developers and explorers; the Index was co-developed by Nasdaq® and Sprott Asset Management LP. |
| 3 | The North Shore Global Uranium Mining Index (URNMX) is designed to track the performance of companies that devote at least 50% of their assets to the uranium mining industry, which may include mining, exploration, development and production of uranium, or holding physical uranium, owning uranium royalties or engaging in other non-mining activities that support the uranium mining industry. |
| 4 | The Solactive Global Copper Miners Index includes international companies active in exploration, mining and/or refining of copper. The index includes a minimum of 20 and a maximum of 40 members. The calculation is done in USD as a total return index. Index adjustments are carried out semi-annually. |
| 5 | Nasdaq Sprott Nickel Miners™ Index (NSNIKL™) is designed to track the performance of a selection of global securities in the nickel industry. |
| 6 | Nasdaq Sprott Junior Copper Miners™ Index (NSCOPJ™) is designed to track the performance of mid-, small- and micro-cap companies in copper-mining related businesses. |
| 7 | Nasdaq Sprott Junior Uranium Miners™ Index (NSURNJ™) is designed to track the performance of mid-, small- and micro-cap companies in uranium-mining related businesses. |
| 8 | The lithium carbonate spot price is measured by the China Lithium Carbonate 99.5% DEL. Source Bloomberg and Asian Metal Inc. Ticker L4CNMJGO AMTL Index. Data converted to pounds and to USD with Bloomberg FX Rates. |
| 9 | The U3O8 uranium spot price is measured by a proprietary composite of U3O8 spot prices from UxC, S&P Platts and Numerco. |
| 10 | The copper spot price is measured by the LME Copper Cash ($). Source Bloomberg ticker LMCADY. Data converted to pounds. |
| 11 | The nickel spot price is measured by the LME Nickel Cash ($). Source Bloomberg ticker LMNIDY. Data converted to pounds. |
| 12 | The S&P 500 or Standard & Poor's 500 Total Return Index is a market-capitalization-weighted index of the 500 largest U.S. publicly traded companies. |
| 13 | The U.S. Dollar Index (USDX, DXY) is an index of the value of the U.S. dollar relative to a basket of foreign currencies. |
| 14 | The Bloomberg Commodity Index (BCOM) is a broadly diversified commodity price index that tracks prices of futures contracts on physical commodities, and is designed to minimize concentration in any one commodity or sector. It currently has 23 commodity futures in six sectors. |
| 15 | The S&P Metals & Mining Select Industry Index comprises stocks in the S&P Total Market Index that are classified in the GICS metals & mining sub-industry. |
| 16 | BloombergNEF, Battery Cathode Prices and Costs, March 27, 2024. Based on February 2024 spot prices for battery cathode material NMC (811) vs LFP |
| 17 | S&P Global, “Global economic expansion gains momentum in March as PMI climbs to nine-month high”, April 4, 2024. |
| 18 | Bloomberg. Copper miners are measured by the NSCOPPT Index and the copper spot price is measured by the LMCADY Index. Beta and correlation are for the longest available time period using monthly data from March 2024 to December 2018. |
| 19 | Reuters, “China's top copper smelters agree on rare joint production cuts, sources say”, March 14, 2024. |
| 20 | Bloomberg News, “China Copper Smelters Move Closer to Possible 10% Production Cut”, March 27, 2024. |
| 21 | Creamer Media Mining Weekly, “Copper surges past $9 000 with supply threats stacking up”, March 15, 2024. |
| 22 | TIME, “An Environmental Probe Into China’s Top Lithium Hub Threatens Global Supply”, February 27, 2023 https://time.com/6258519/china-lithium-mining-environmental-investigation/ |
| 23 | BNN Bloomberg, “The Big Lithium Short Gets ‘Dangerous’ on Lower Supply Outlook”, March 13, 2024. |
| 24 | BNN Bloomberg, “Biden’s Newest Rule on Auto Emissions Set to Boost Electric Car Sales”, March 20, 2024. |
| 25 | BNN Bloomberg, “US to Offer Record Loan for Lithium Americas Project in Nevada”, March 13, 2024. |
| 26 | Financial Review, “Lithium hopeful Liontown in $550m loan from banks, taxpayers”, March 13, 2024. |
| 27 | Sources: USGS, Nickel Statistics and Information. NikkeiAsia, “Nickel surplus seen widening in 2023 as Indonesian output soars”, June 16, 2023. |
| 28 | France24, “Indonesia's Prabowo Subianto confirmed as president after first-round win”, March 20, 2024. |
| 29 | Daily Insights, “European Carmakers Racing to Build EV Industry in Indonesia”, April 4, 2024. |
| 30 | BloombergNEF, “Biden’s Tailpipe Rules a Political Target: Washington Edition”. |
Investment Risks and Important Disclosure
Relative to other sectors, precious metals and natural resources investments have higher headline risk and are more sensitive to changes in economic data, political or regulatory events, and underlying commodity price fluctuations. Risks related to extraction, storage and liquidity should also be considered.
Gold and precious metals are referred to with terms of art like "store of value," "safe haven" and "safe asset." These terms should not be construed to guarantee any form of investment safety. While “safe” assets like gold, Treasuries, money market funds and cash generally do not carry a high risk of loss relative to other asset classes, any asset may lose value, which may involve the complete loss of invested principal.
Past performance is no guarantee of future results. You cannot invest directly in an index. Investments, commentary and opinions are unique and may not be reflective of any other Sprott entity or affiliate. Forward-looking language should not be construed as predictive. While third-party sources are believed to be reliable, Sprott makes no guarantee as to their accuracy or timeliness. This information does not constitute an offer or solicitation and may not be relied upon or considered to be the rendering of tax, legal, accounting or professional advice.


