Gold rose 12.79% in the first half, while GDX,1 the largest gold miner ETF, rose 9.42%. Although these gains might seem modest against 15.29% for the S&P 500 Index, gold bullion’s advance is significant. Gold has decoupled decisively from a 4-year trading range (2020-2023) to reach all-time highs. Although the metal is in the midst of a powerful advance, most fear only the downside. The paucity of commentary or analysis from mainstream financial media suggests that the breakout was a non-event.
Gold mining equities continue to trade well below the peak of four years ago, a sign of deeply negative sentiment about the outlook for precious metals. In Western capital markets, gold ownership remains at rock-bottom levels. Disinterest is astonishing in light of the fact that gold has outperformed equities and bonds since 2000, the beginning of central bank radical monetary experimentation (see Figure 1).
Figure 1. Gold vs. Stocks, Bonds and USD (1999-2024)
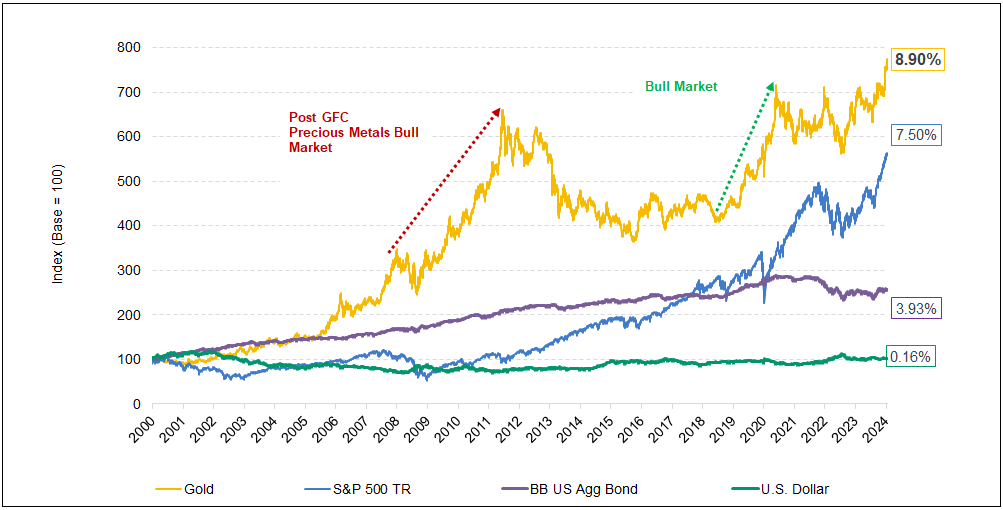
Source: Bloomberg. Period from 12/31/1999-06/30/2024. Gold is measured by GOLDS Comdty Spot Price; S&P 500 TR is measured by the SPX; US Agg Bond Index is measured by the Bloomberg Barclays US Agg Total Return Value Unhedged USD (LBUSTRUU Index); and the U.S. Dollar is measured by DXY Curncy. Past performance is no guarantee of future results.
Gold Remains Underpriced
Gold’s breakout in U.S. dollar terms may signify more than one might infer from the continuing lack of interest. The economic soft-landing mantra, role of U.S. Treasuries as safe assets2 and acceptance of the U.S. dollar as the go-to international reserve currency could be in play.
Gold remains underpriced, in our opinion. On an inflation-adjusted basis, the metal trails the previous peaks of 1980 and 2011 (see Figure 2). The macroeconomic tables have tilted significantly from those days, and much more in gold’s favor. The ratio of existing gold to existing dollars has widened more than financial markets have priced in since 1980 or 2011. We conjecture that a gold price greater than today’s $2,400 is a probable bet.
Figure 2. Inflation Adjusted Gold Price, Adjusted to Today’s U.S. Dollar
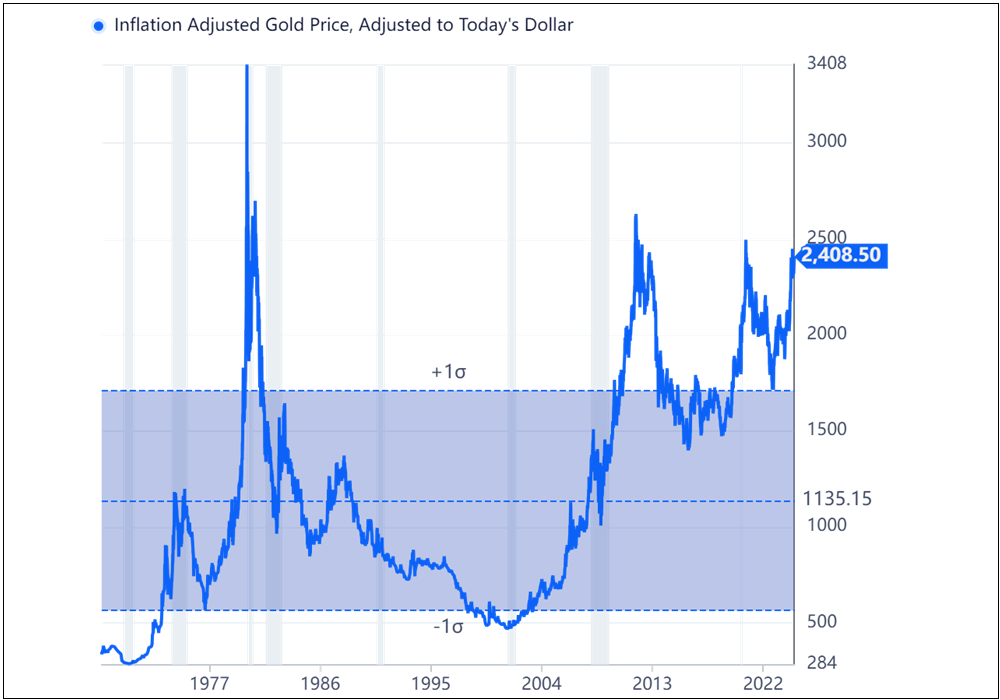
Source. GuruFocus.com.
In our view, gold mining equities remain deeply undervalued and offer attractive leverage to further upside in bullion. Since 2009, the gold price has increased by 150% while valuations of gold mining stocks declined by more than 40%. Nobody invests in a gold mining equity unless they expect a higher gold price. Low equity valuations in the mining space should be a bell ringer for contrarians.
Figure 3. Senior Gold Mining Equities Historical P/NAV vs. Spot Gold (2009-2024)
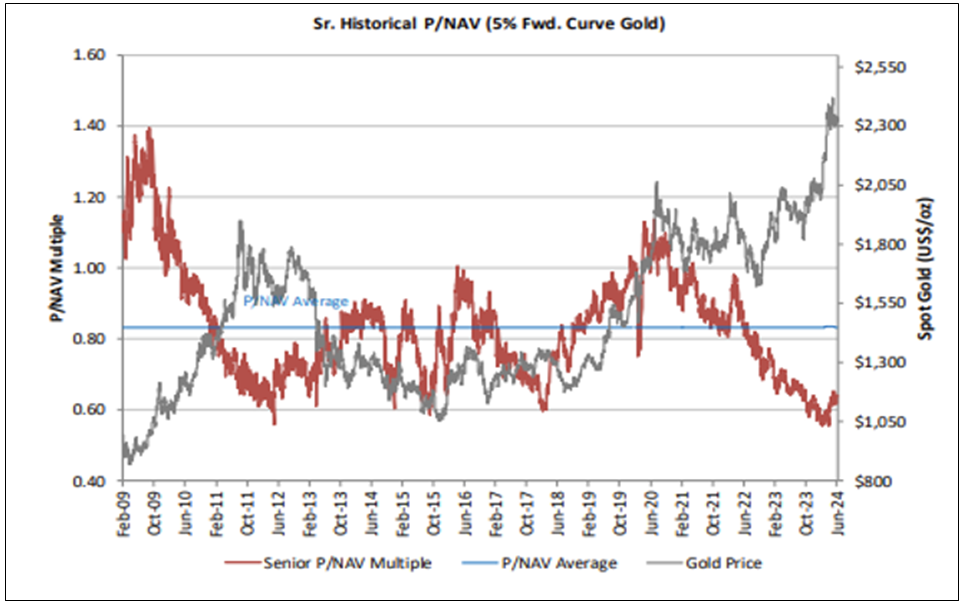
Source: FactSet, Bloomberg, Canaccord Genuity Estimates.
Western Capital Market Gold Exposure is Minimal
Underpositioning by investors in Western capital markets remains extreme. Popular interest in artificial intelligence (AI) and similar investment crazes is the likely reason for investor disinterest. Gold’s strong performance following the breakout in early 2024 was driven mainly by central bank and Asian demand. Participation by investors in Western capital markets, using SPDR Gold Shares (GLD) assets as a proxy, has been negative (see Figure 4).
We believe a return of interest from Western investors has the potential to add significantly to the gold price. From 2005-2011, flows into GLD (the largest gold-backed ETF) added approximately 38.1 million ounces, helping to drive the metal price from $535 to more than $1,800, or more than 300%. Since the 2011 peak, outflows have reduced GLD assets by 38% yet the nominal gold price has gained 30%. The gap between the enormous growth in U.S. dollars versus the very modest increment in the quantity of physical gold has widened considerably from previous gold price peaks in 2011 and 1980.
Figure 4. Gold ETF Holdings vs. Spot Gold (2019-2024)
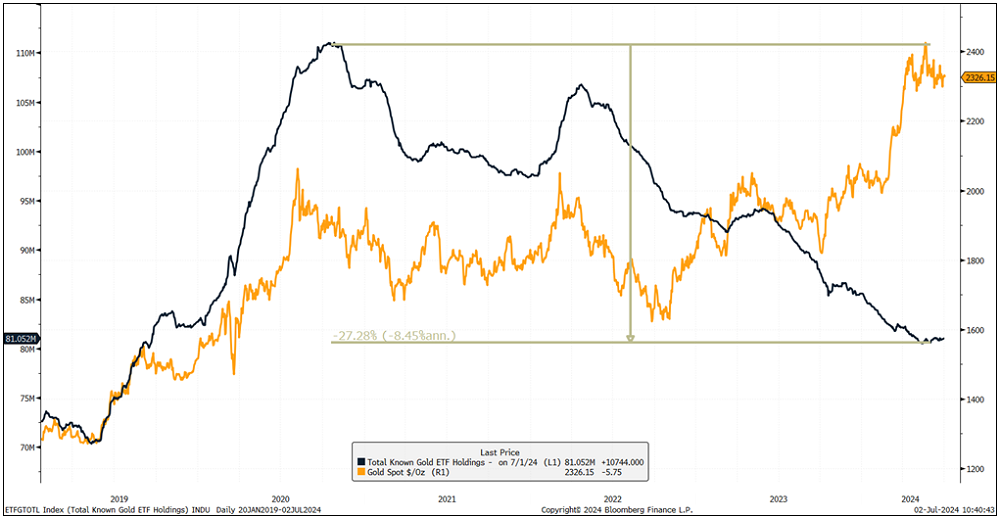
Source: Bloomberg. Data as of 7/2/2024. Past performance Is no guarantee of future results.
Are U.S. Treasuries Safe Assets?
Government bonds are losing status as the unquestioned “go-to” safe asset. Bonds may have commenced a secular bear market. Concerns over sovereign creditworthiness and the embryonic “de-dollarization” movement initiated by the BRIC (Brazil, Russia, India, China) trading bloc could be important causes. Gold’s breakout against the iShares 20+ Year Treasury Bond ETF (TLT) depicts pronounced slippage in favor of gold since 2020 (see Figure 5). While government bonds should rally as the prospect of recession grows more palpable, the longer-term outlook seems problematic. If designers of the typical mainstream portfolio 60% equity/40% fixed income configuration decide to add a few percentage points of unallocated gold to introduce a measure of uncorrelated risk to either asset class, demand for bullion could rise by millions of ounces. As noted in Grant’s Interest Rate Observer (July 2024):
“Which exogenous force, bearing on bond prices (but not customarily deemed significant to bond prices), might we be overlooking? We nominate the deteriorating United States public credit.”
Figure 5. Gold vs. 20-YR U.S. Treasury Bonds (2005-2024)
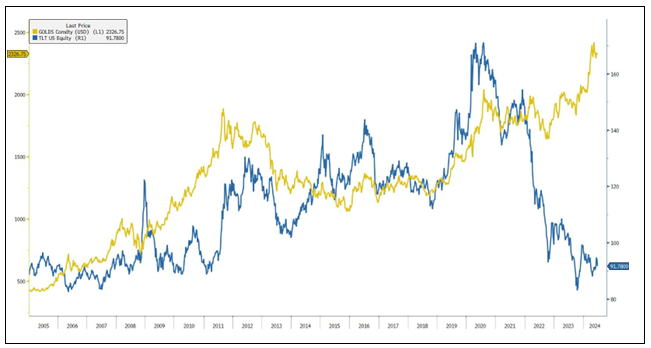
Source: Bloomberg. Data as of 6/30/2024.
An Economic Downturn?
A recession would lead to new bouts of money creation by central bankers, fiscal excess, and overtly bipartisan monetary debasement. A recession, an event for which financial markets are incorrectly positioned, would cause demand for gold to surge.
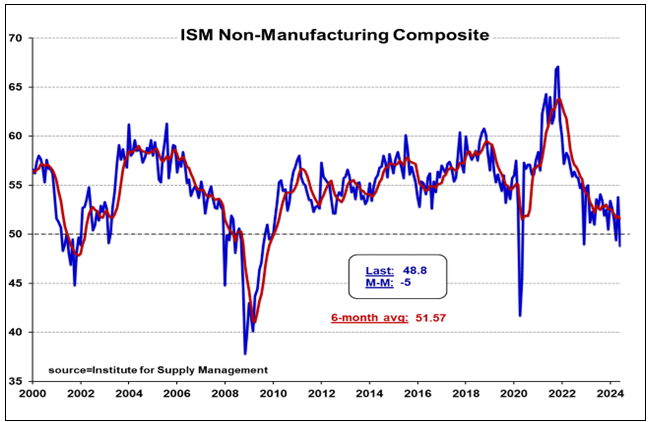
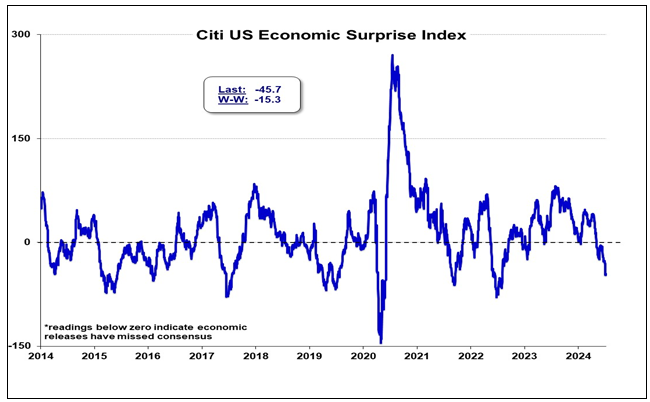
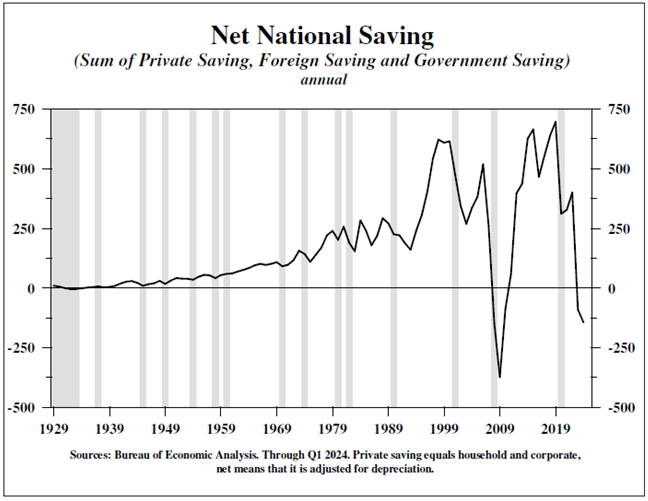
Evidence supporting a weaker economy is extensive yet ignored by the investment consensus as inconvenient to support manic equity valuations. The charts in Appendix A. provide a short but compelling list of signs pointing to gathering economic contraction.
Government spending appears to be the only reason recessionary forces dragging down the private sector have taken so long to prevail, keeping alive the fallacious soft-landing myth. Year-over-year growth in government spending has exceeded 20% in recent months. That spending will be financed by increased government debt issuance, which in turn will deepen concerns as to sovereign credit risk in the absence of real economic growth. In its June update to the economic outlook, the CBO increased its 2024 budget deficit by a shocking 27% midway through the fiscal year.
De-Dollarization
The movement by BRIC nations to circumvent US treasury bonds “de-dollarization”) as a neutral reserve asset to recycle trade surpluses is beginning to gain traction. Weaponization of the U.S. dollar in response to the Russian invasion of Ukraine in February 2022 was the catalyst. Undermining the apolitical aspect of U.S. currency as reserve assets set off a chain reaction that has extended beyond the list of U.S. adversaries. Dollar avoidance shrinks the pool of non-US capital willing or able to invest in Treasuries while the supply (issuance) remains high or, in the event of a recession, becomes even larger. In a free market, the worsening mismatch between supply and demand would normally cause one to expect long-term interest rates to rise, potentially destabilizing private sector economic activity as well as lofty equity market valuations. Should market pressure favor rising long-term rates, and public policy respond with overt or covert yield curve control, trust in the safety of the U.S. dollar would be severely tested.
Gold Mining Shares are Undervalued
According to Bloomberg (data as of 6/30/2024), the consensus projection for long-term gold prices is for them to trend lower compared to the current spot price of approximately $2,400 per ounce.
Figure 6. Gold Price Forecasts

Source: Bloomberg.
In our view, the absurdity of consensus thinking can only be explained by financial market and media complacency. Signs of recession, equity market overvaluation and concentration, adverse geopolitical developments and worsening U.S. credit belong in an alternate universe.
In that complacency lies the compelling investment opportunity represented by mining equities. The invisibility to most of the generationally promising prospects for precious metals miner earnings is stupefying. How else might one explain the over 50% discount to S&P 500 valuations?
Figure 7. Gold Mining Equities vs. S&P 500 Index: EV/EBITDA (2012-2024)
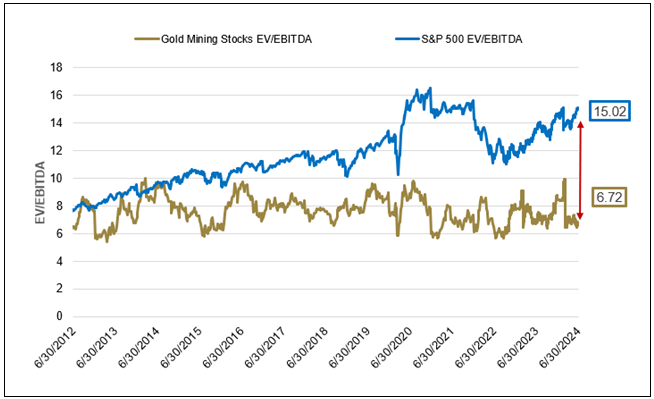
*Enterprise value to earnings before interest, taxes, depreciation and amortization. The EV/EBITDA ratio is a popular metric used as a valuation tool to compare the value of a company, debt included, to the company's cash earnings less non-cash expenses.
Source: Bloomberg. Data as of 06/30/2024. S&P 500 Index is measured by the SPX Index using Bloomberg’s Enterprise Value/Best EBITDA field and Gold Mining Equities are measured by the GDM Index using Bloomberg’s Enterprise Value/Best EBITDA field. Past performance is no guarantee of future results.
Gold Is in the Midst of a Multi-Year Advance
Sentiment is negative, investors are under-positioned and macroeconomic risks are unrecognized. Multiple catalysts stand ready to activate a renewal of interest in gold and related mining stocks. Aside from the few that we have mentioned, (1) a secular bear market in bonds, (2) an unexpected recession and (3) the potentially adverse consequences of de-dollarization, the list could also include all things geopolitical, equity market concentration and overvaluation, and the fractious U.S. political scene. With respect to POTUS risks, consider the stance on the “strong U.S. dollar” of the Republican nominee for Vice President (J.D. Vance) in posing questions to Chairman Powell at the most recent Senate hearings:
“I'm struck by the idea that you could make a similar argument about the reserve currency status of the United States dollar. Americans have enjoyed one of the greatest privileges of the international economy for the last nearly eight decades, a strong dollar that acts, of course, as the world's reserve currency. You know that better than I do now. This has obviously been great for American purchasing power. We enjoy cheaper imports. Americans, when they travel abroad, benefit from lower costs, but it does come at a cost to American producers. I think in some ways you can argue that the reserve currency status is a massive subsidy to American consumers, but a massive tax on American producers. Now, I know the strong dollar is sort of a sacred cow of the Washington consensus, but when I survey the American economy and I see our mass consumption of mostly useless imports on the one hand and our hollowed-out industrial base, on the other hand, I wonder if the reserve currency status also has some downsides and not just some upsides as well.”
Our friend Simon Mikhailovich assesses the potential implications for gold and hard assets from a Republican win in November:
“….this election pits neoliberal, globalist financial and high tech interests vs. populist and domestic real economy interests. The former have sought to subsidize consumption and pump-up asset prices whereas the latter will likely seek to subsidize domestic production by tolerating high inflation and devaluing the dollar. This will also help the balance sheet by devaluing legacy debts. Awesome for real assets and gold.” 7/16/24
Inflows into the precious metals mining space have the potential to generate compelling outcomes. Investors will soon get a wake-up call from second-quarter earnings reports. Those reports seem likely to provide a glimpse of the mining company earnings power undreamed of for a decade. In our view, it will not be long before sell-side analysts and strategists begin to scramble to raise earnings estimates for both the companies and price targets for precious metals. We believe the window of opportunity to position this sector on attractive investment terms is beginning to narrow quickly.
Appendix A. Macroeconomic Data
Footnotes
| 1 | VanEck Vectors Gold Miners ETF (GDX) tracks the overall performance of companies involved in the gold mining industry. |
| 2 | Safe assets (e.g., gold, Treasuries, money market funds, and cash) typically do not carry a high risk of loss across all types of market cycles. Nonetheless, there is no guaranteed safety in any investment class, and even "safe assets" may lose value, including possible loss of invested principal. |
Investment Risks and Important Disclosure
Relative to other sectors, precious metals and natural resources investments have higher headline risk and are more sensitive to changes in economic data, political or regulatory events, and underlying commodity price fluctuations. Risks related to extraction, storage and liquidity should also be considered.
Gold and precious metals are referred to with terms of art like "store of value," "safe haven" and "safe asset." These terms should not be construed to guarantee any form of investment safety. While “safe” assets like gold, Treasuries, money market funds and cash generally do not carry a high risk of loss relative to other asset classes, any asset may lose value, which may involve the complete loss of invested principal.
Past performance is no guarantee of future results. You cannot invest directly in an index. Investments, commentary and opinions are unique and may not be reflective of any other Sprott entity or affiliate. Forward-looking language should not be construed as predictive. While third-party sources are believed to be reliable, Sprott makes no guarantee as to their accuracy or timeliness. This information does not constitute an offer or solicitation and may not be relied upon or considered to be the rendering of tax, legal, accounting or professional advice.


