

Key Takeaways
- Weakness Hides Strength: Short-term volatility obscures the rise in long-term uranium prices and improving market fundamentals.
- Contracting Still Lags Needs: Long-term contracting accelerated late in the year, yet volumes remain well below replacement levels.
- Uranium Supply Is Tightening: Producer discipline, geopolitical and jurisdictional risks, slow restarts, long lead times, and shrinking secondary supply are tightening uranium availability.
- Policy Is Driving Demand: Large-scale nuclear commitments, restarts and SMRs are turning policy into real demand, driven by AI power demand in North America and allied nations.
- Upstream Poised to Catch Up: Capital inflows, M&A and firm pricing favor upstream exposure, which involves finding and producing uranium, before it is processed or used in reactors.
Performance as of November 30, 2025
| Asset | 1 MO* | 3 MO* | YTD* | 1 YR | 3 YR | 5 YR |
|
U3O8 Uranium Spot Price 1 |
-7.90% | -0.35% | 3.62% | -1.63% | 15.33% | 20.43% |
|
Uranium Mining Equities |
-14.39% | 7.19% | 37.98% | 19.74% | 21.82% | 35.33% |
| Uranium Junior Mining Equities (Nasdaq Sprott Junior Uranium Miners Index TR) 3 |
-18.14% | 7.69% | 40.14% | 16.24% | 15.03% | 33.66% |
|
Broad Commodities (BCOM Index) 4 |
2.90% | 7.42% | 11.80% | 12.50% | -1.65% | 8.23% |
|
U.S. Equities (S&P 500 TR Index) 5 |
0.25% | 6.34% | 17.81% | 15.00% | 20.59% | 15.29% |
*Performance for periods under one year is not annualized.
Sources: Bloomberg and Sprott Asset Management LP. Data as of 11/30/2025. You cannot invest directly in an index. Past performance is no guarantee of future results.
Performance Overview: Volatility Amid Strong Setup
The November weakness in the uranium market was notable, despite positive signs that utilities are starting to sign new long-term contracts, visible policy progress on new nuclear capacity, and ongoing challenges in bringing uranium supply to market. Despite the selloff in November, year‑to‑date performance remained positive: spot uranium has gained 3.62%, uranium miners have climbed 37.98% and junior uranium miners are up 40.14%. Long‑term pricing climbed to $86 per pound, up 8.86% YTD, after being stuck for months in the $79-$82 range, signaling that utilities are accepting higher prices in long‑term contracts.
Despite the pullback, the uranium market is setting up for higher prices.
Contracting behavior showed a clear breakout. By the end of October, cumulative long-term volumes had reached 48 million lbs (Mlbs). November added 27 Mlbs across 14 new deals, lifting the total to 75 Mlbs. As of December 8, year-to-date contracting reached 82 Mlbs, still materially below the theoretical replacement rate of ~150 Mlbs per year. The soft contracting volume reflects a year in which utilities were distracted by the threat of tariffs, geopolitical maneuvering, and changes to energy policy. Utilities can delay and defer, but they can’t avoid replacing consumed fuel.
A sellers’ market dynamic is also becoming more visible. Offer bands have shifted toward $86-$90 per lb for new deals, and producers, such as Kazatomprom, the world’s largest and lowest-cost producer of uranium, have specifically stated that higher prices are required to increase production.
Several developments amplified this backdrop. Policy execution advanced in North America, with financial support for new build programs and restarts that are likely to lead to higher future demand. Supplier strategies signaled tighter control over primary supply, highlighted by Kazakhstan’s legislative steps to consolidate ownership in joint ventures and a customer base that is increasingly tilted toward Russia and China. Furthermore, Niger continues to emphasize the challenge of relying on uranium supplies from unstable jurisdictions. Uranium miners capitalized on higher prices by keeping the capital cycle active, with issuance and mergers positioning developers and producers to advance their projects. These factors align to raise the premium on reliable supply, encourage earlier contracting and support disciplined upstream investment.
The gains this year have also pushed the downstream segment upward significantly, as the nuclear thesis strengthened and capital flowed. That attention, while warranted, we believe presents an opportunity in the overlooked upstream sector to catch up. With upstream fundamentals continuing to strengthen alongside firmer long-term pricing and advancing procurement, the setup favors exposure to the upstream sector.
Looking at longer-term performance, uranium and uranium miners have meaningfully outpaced equities and broader commodity benchmarks over the past five years (see Figure 1).
Figure 1. Physical Uranium and Uranium Stocks Have Outperformed Other Asset Classes Over the Past Five Years (11/30/2020-11/30/2025)
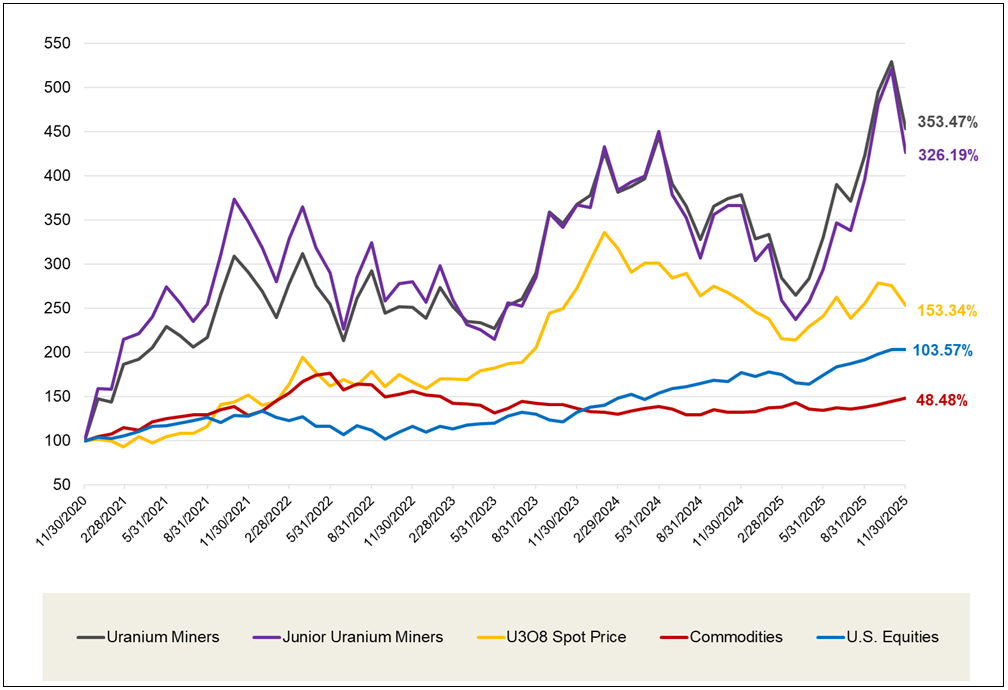
Source: Bloomberg and Sprott Asset Management. Data as of 11/30/2025. Uranium Miners are measured by the Northshore Global Uranium Mining Index (URNMX index); Junior Uranium Miners are measured by the Nasdaq Sprott Junior Uranium Miners™ Index (NSURNJT™ Index); U.S. Equities are measured by the S&P 500 TR Index; the U308 Spot Price is from TradeTech; and Commodities are measured by the Bloomberg Commodity Index (BCOM). Definitions of the indices are provided in the footnotes. You cannot invest directly in an index. Past performance is no guarantee of future results.
Market Drivers: Kick-Starting a Nuclear Renaissance
Billions Committed to North American Nuclear
North American policy commitments are being translated into growing demand, procurement frameworks and permitting pathways that strengthen the case for upstream investment. One headline development was an $80 billion deal for Cameco’s Westinghouse to build new nuclear reactors in the United States, designed not only to provide financing but also to streamline the approval process.6 The Trump administration has ordered the U.S. Nuclear Regulatory Commission to reduce regulatory hurdles, expedite the approval of new reactor licenses and have 10 new large reactors under construction by 2030. The structure includes participation features for the government once thresholds are met, reinforcing the commitment to expand reliable and carbon-free capacity and rebuild nuclear supply chains. The initiative aims to mitigate execution risk for long-lead components and provides a template for mobilizing capital and regulatory support at scale.
Policy is turning into projects and nuclear demand is following.
The allied context strengthened in parallel, primarily driven by the policies of Western nations to secure domestic nuclear fuel supplies and reduce reliance on Russian imports. The United States and Japan announced a framework totaling $550 billion, with up to $332 billion directed to U.S. energy and AI-linked infrastructure, including new nuclear capacity, such as AP1000 and BWRX 300 deployments (designs for advanced nuclear reactors, including large-scale and small modular reactors, SMRs), as well as grid modernization.7 The framework prioritizes supply chain cooperation and manufacturing scale for critical equipment to address bottlenecks, standardize designs and establish repeatable processes that shorten build schedules and reduce uncertainty. These commitments signal a clear policy preference for nuclear capacity additions and an alignment of policy with energy security, which is likely to support earlier procurement and durable uranium demand.
The month also featured an AI-linked restart signal in the United States. NextEra Energy and Google will restart the 615-MW Duane Arnold Energy Center under a 25‑year Purchase Power Agreement that supplies most of the plant’s output to Google’s Iowa data centers, with Central Iowa Power Cooperative (CIPCO) purchasing the balance on matching terms. The Duane Arnold restart, targeted for early 2029 pending NRC approvals, follows the Palisades and Three Mile Island restarts, marking the third U.S. nuclear reactivation tied to rising AI‑driven demand. This restart adds to a growing queue of U.S. nuclear capacity commitments, indicating an increase in domestic nuclear demand.
In Canada, the first wave of SMR deployment advanced with a combined funding of C$3 billion for the country’s first SMRs.8 Construction has begun on the first unit, with a target completion date of 2030. The project brings together provincial and federal support, utility experience and vendor partnerships in an effort to move from demonstration to scaled rollout. These steps provide practical evidence that permitting and project delivery can be accelerated. SMRs are also poised to increase uranium demand globally. Recent World Nuclear Association (WNA) projections have revised total SMR capacity by 2040 to 42% higher than the prior forecast, with SMRs now expected to supply ~7% of nuclear power generation.9
Canada’s cross-border fuel strategy also moved forward. A bilateral $2.8 billion 10-year arrangement involving Canada, via Cameco, and India is set to close, supporting reliable imports as India scales up from 7.9 GW of installed nuclear capacity toward more ambitious fleet targets.10 These bilateral frameworks are likely to help support multiyear uranium demand.
Several countries now view the nuclear fuel cycle as a strategic supply chain, supporting policies that prioritize reliable domestic and allied capacity. This strengthens the case for contracting earlier in the cycle, reinforces the value of assured access and supports firm pricing structures that reflect the cost of certainty. However, in the United States, policy actions aimed at energy security and supply‑chain reshoring have yet to translate into commensurate uranium purchasing behavior. U.S. utilities lag behind in purchased coverage compared to the EU and China, and their inventory levels are lower. As the country refocuses on nuclear, it is likely a matter of time before procurement must align with ambitious capacity targets, including Trump’s executive order to quadruple nuclear energy by 2050 (which would represent doubling global uranium production, just for the U.S.).
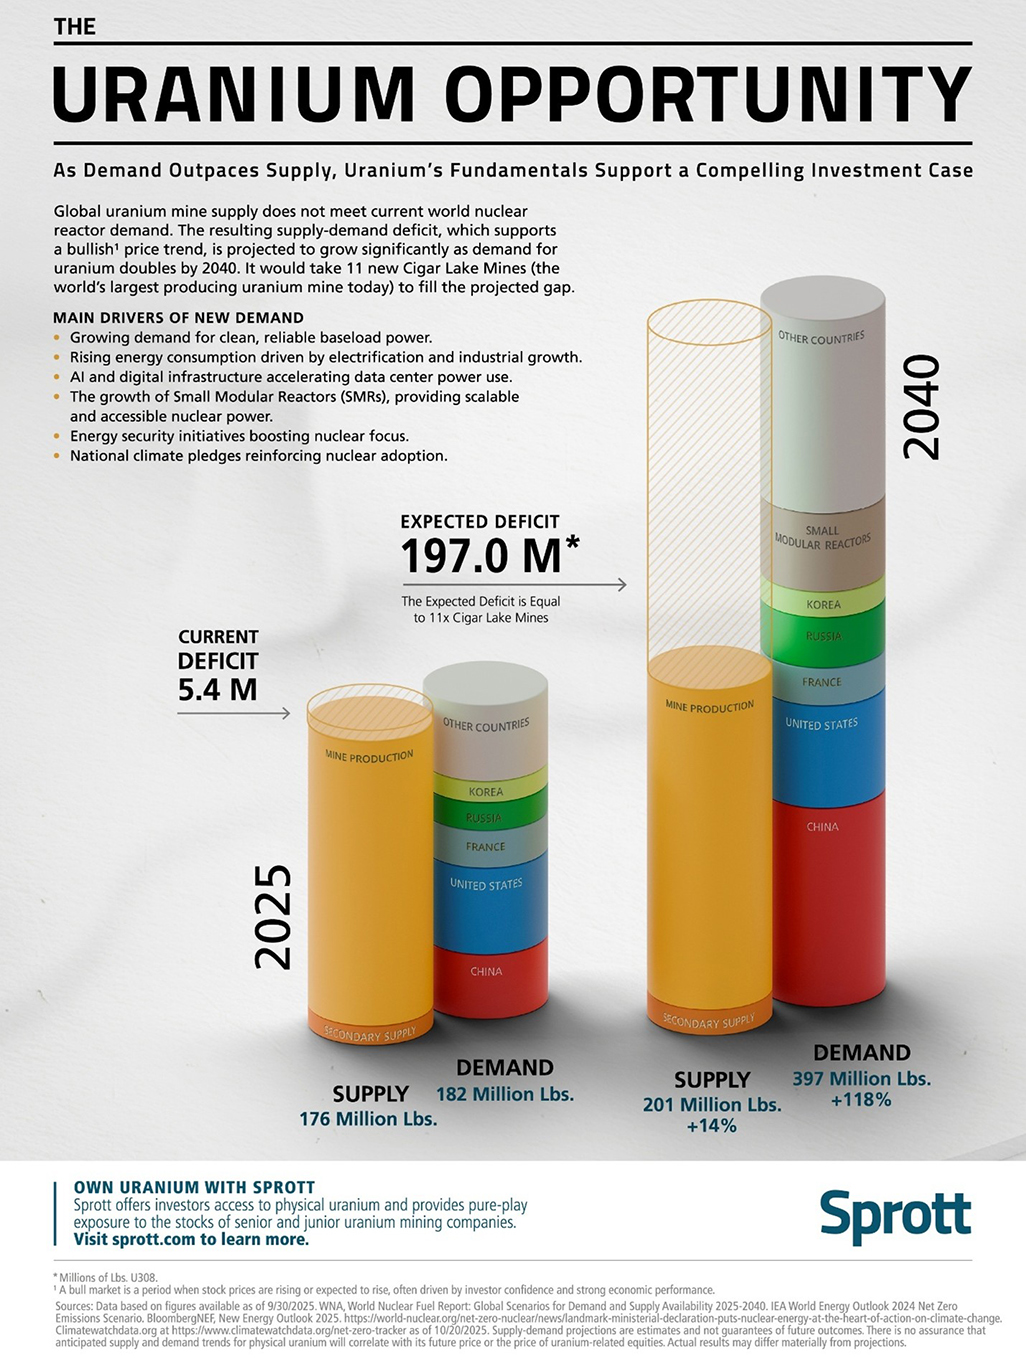
Figure 2. A 197 Mlb Supply Deficit Is Forecast for 2040
Uranium Supply Remains Precarious
Supplier actions and jurisdictional changes are reshaping reliability and access to the primary uranium supply. Kazakhstan is tightening access while clearly favoring value over volume to support uranium prices. Access is largely mediated through joint venture (JV) companies led by Kazatomprom (KAP), which utilizes partner agreements with entities in Canada (Cameco), Russia, China, France and Japan. Legislative changes announced in December now reweight ownership in favor of Kazatomprom at key decision points: at JV contract extension, KAP may move to 90% ownership, and when subsoil rights are transferred in priority uranium districts, up to 75% can be assigned to KAP or its subsidiaries.11 Practically, this tightens JV partners’ access.
Primary uranium supply is tightening as access and geopolitics impact the market.
In parallel, collaboration with Eastern counterparties has deepened, specifically with China and Russia, with a growing share of revenue tied to these countries. As Kazakhstan develops its own nuclear pathway, a portion of the material is expected to be allocated domestically.
Previous actions align with this strategy. Kazakhstan legislated changes to the mineral extraction tax (MET), with increases taking effect in 2025, reinforcing the intent to monetize its dominant market position. Together, Kazakhstan’s MET changes and production resets communicate a clear preference for value over volume and greater control over its domestic uranium reserves.
Recent political actions in Niger have materially increased governance risk for uranium supply. The July 2023 military junta that overthrew Niger’s elected government seized control of SOMAÏR (a uranium mine previously operated by Orano) and has since signaled its intent to sell stockpiled uranium in defiance of an international order prohibiting such sales. Operationally, no production from SOMAÏR has been recorded in 2025. Historically, Niger was a long-standing and strategically important uranium supplier to Europe, with exports heavily concentrated in France and representing a significant share of the EU's supply. That reliability has eroded rapidly. Permits have been revoked or challenged, operations have been disrupted and legal disputes remain unresolved, transforming a once-dependable source into one that is legally constrained and politically unstable. For utilities, this episode highlights the importance of diversified sourcing and securing long-term coverage well in advance of delivery requirements.
Operationally, several legacy and restart uranium mining assets have faced transitional challenges that affect near-term supply. Canada’s McArthur River uranium mine lowered its 2025 output due to development delays, with expectations to restore volumes thereafter. Kazatomprom signaled a reduction in its nominal 2026 production level, reinforcing a cautious approach to ramping capacity. At SOMAÏR, there was no production in 2025 under junta control. In the U.S., several in-situ recovery (ISR) uranium mine restarts have ramped up more slowly than initially planned.
The net effect of these changes is a tighter global market for reliable primary supply. Sanctions, export bans and the Russia-Ukraine war are constraining the nuclear fuel cycle, and the concentration of upstream supply in non-Western jurisdictions materially increases security-of-supply risk for Western buyers. With utilities prioritizing coverage, stockpiles at strategic lows and secondary sources diminishing, the market is shifting from an inventory-driven to a production-driven model; prices remain below prior cycle peaks, leaving room for expansion as high-quality jurisdictions slowly reenter the pipeline and long-term contracting accelerates.
Figure 3. Largest Uranium Producing Countries
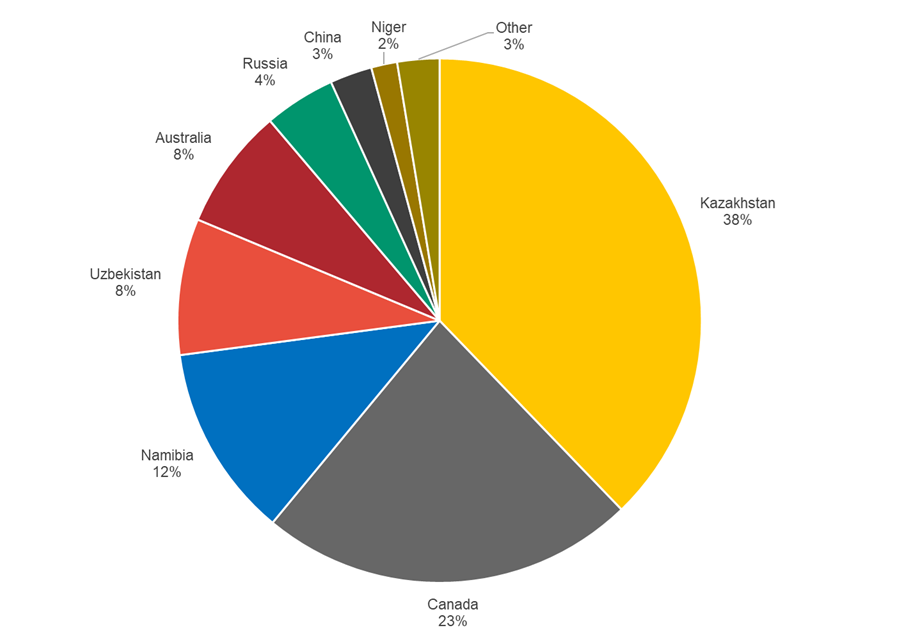
Source: UxC, LLC. Data as of 12/31/2024.
Uranium Miners Are Capitalizing on Rising Funding
IsoEnergy agreed to acquire Toro Energy for $49 million, representing a 92% premium to Toro’s 20-day volume-weighted average price (VWAP).12 IsoEnergy’s portfolio will add Toro’s 100%‑owned Wiluna Uranium Project in Western Australia. This expands near-term development optionality in a tier-one jurisdiction and enhances scale for follow-on mergers and acquisitions (M&A). By combining portfolios across various stages of development, IsoEnergy’s management can prioritize assets with favorable economics and timelines, thereby strengthening its foundation for future growth. IsoEnergy’s M&A strategy is ongoing; following the 2023 merger with Consolidated Uranium (CUR), the Toro acquisition further builds a multi‑jurisdiction pipeline of uranium mines and development projects.
Capital inflows into the sector remained robust, providing funding support for developers and producers as they capitalized on improving pricing conditions and supportive policy signals. Strong investor demand drove several upsized transactions during the period (see Figure 4). NexGen expanded its Australian equity offering in October 2025, alongside a separate North American bought deal, to advance the Rook I project. Global Atomic increased the size of its October 2025 bought deal to progress Dasa, while Paladin’s October 2025 financing was heavily oversubscribed. UEC reported the full exercise of its over-allotment option in October 2025, and Energy Fuels announced and subsequently closed an upsized convertible senior notes offering during the same month. Earlier, Lotus upsized its October 2024 placement to fund the restart of Kayelekera. Proceeds from these financings are being directed toward mine restarts, development drilling, strategic inventory build-outs and services expansion, to improve supply visibility later this decade.
Investor participation in the uranium market has broadened, and generalist investors have shown rising interest. Industry voices emphasize cost curve economics rather than explicit price forecasts. We believe that triple-digit long-term pricing is often the minimum threshold to reliably incentivize new capacity, with some discussions extending higher to account for capital intensity, schedule risk and supply chain constraints.
Figure 4. Capital Raised in the Uranium Mining Sector Since September 2025
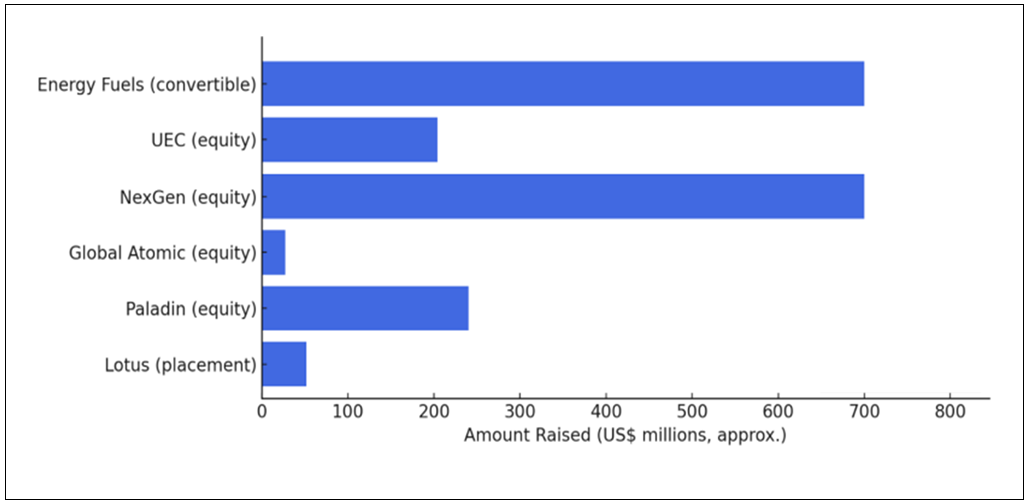
Source: Ocean Wall.
Looking Ahead: Shaking Off a Tough Year
2025 was a tough year for the uranium spot price, with range-bound trading masking improving fundamentals. Term pricing has finally moved higher on light contracting volumes, reflecting a market environment where key producers are already sold forward multiple years of production. With policy uncertainty fading for utilities, we believe an improvement in long-term contracting volumes will drive 2026. The uranium spot price appears well-supported at current levels, with potential for a catch-up trade in 2026. Uranium miners fared better in 2025 as bullish equity investors looked beyond the lackluster contracting activity and focused on the compelling industry fundamentals.
Policy alignment and supply shortages point to higher uranium prices ahead.
Policy and investment signals are aligning for a stronger 2026. Uranium was reinstated to the United States Geological Survey (USGS) Final 2025 List of Critical Minerals, reinforcing its strategic status and enabling supportive domestic supply‑chain tools. The IEA’s World Energy Outlook 2025 forecasts that annual nuclear investment will rise from more than $70 billion today to approximately $210 billion around 2035, contingent upon robust supply chains and long-term policy support. Together, we believe that these developments, along with those discussed above, provide strong support for the industry.
With global uranium mine production falling short of the world’s uranium reactor requirements, a supply deficit is expected to build over the next decade, and near-term supply is hindered by long lead times and high capital intensity. We believe that restarts and new mines in development are critical. The uranium price target as an incentive level for further restarts and greenfield development is a moving target, and we believe that we will need higher uranium prices to incentivize enough production to meet forecasted deficits. Over the long term, increased demand in the face of an uncertain uranium supply may likely continue supporting a sustained bull market (Figure 5).
Figure 5. Uranium Bull Market Continues (1968-2025)
Click here to enlarge this chart.
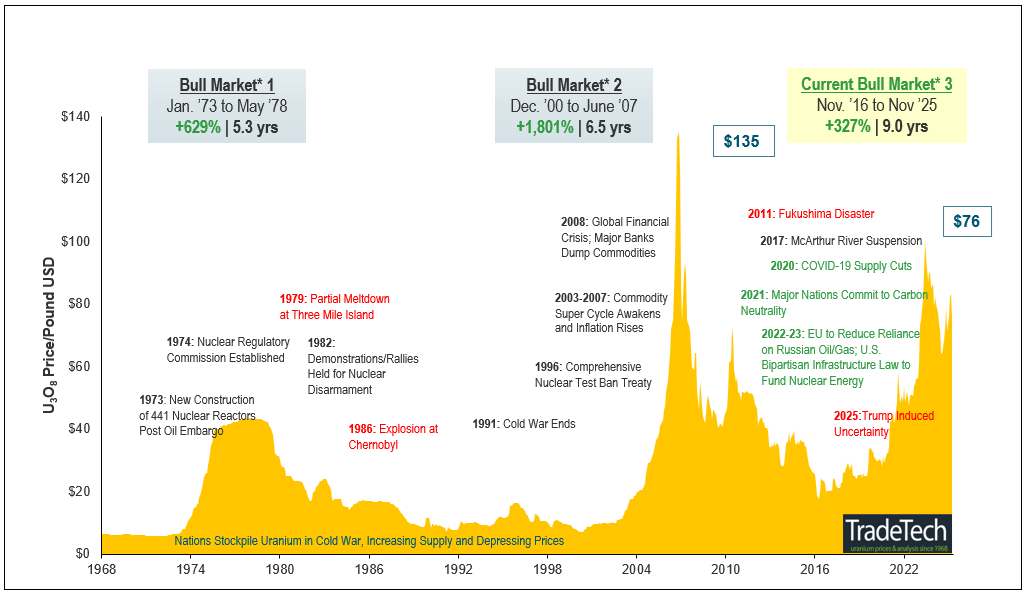
Note: A “bull market” refers to a condition of financial markets in which prices are generally rising. A “bear market” refers to a condition of financial markets in which prices are generally falling.
Source: TradeTech Data as of 11/30/2025. TradeTech is the leading independent provider of uranium prices and nuclear fuel market information. The uranium prices in this chart, dating back to 1968, are sourced exclusively from TradeTech; visit https://www.uranium.info/.
Footnotes
| 1 | The U3O8 uranium spot price is measured by a proprietary composite of U3O8 spot prices from TradeTech, UxC, S&P Platts and Numerco. |
| 2 | The North Shore Global Uranium Mining Index (URNMX) was created by North Shore Indices, Inc. (the “Index Provider”). The Index Provider developed the methodology for determining the securities to be included in the Index and is responsible for the ongoing maintenance of the Index. The Index is calculated by Indxx, LLC, which is not affiliated with the North Shore Global Uranium Miners Fund (“Existing Fund”), ALPS Advisors, Inc. (the “Sub-Adviser”) or Sprott Asset Management LP (the “Sponsor”). |
| 3 | The Nasdaq Sprott Junior Uranium Miners™ Index (NSURNJ™) was co-developed by Nasdaq® (the “Index Provider”) and Sprott Asset Management LP (the “Sponsor”). The Index Provider and Adviser co-developed the methodology for determining the securities to be included in the Index and the Index Provider is responsible for the ongoing maintenance of the Index. |
| 4 | The Bloomberg Commodity Index (BCOM) is a broadly diversified commodity price index that tracks prices of futures contracts on physical commodities, and is designed to minimize concentration in any one commodity or sector. It currently has 23 commodity futures in six sectors. |
| 5 | The S&P 500 or Standard & Poor's 500 Index is a market-capitalization-weighted index of the 500 largest U.S. publicly traded companies. |
| 6 | Source: Reuters, US strikes $80 billion deal for new nuclear power plants, 10/28/2025. |
| 7 | Source: The White House. Fact Sheet: President Donald J. Trump Drives Forward Billions in Investments from Japan, 10/28/2025. |
| 8 | Source: CBC. Feds, province to spend $3B on mini nuclear power plant in Bowmanville, Ont., 10/23/2025. |
| 9 | WNA, World Nuclear Fuel Report: Global Scenarios for Demand and Supply Availability 2025-2040. |
| 10 | Source: Reuters. Ottawa close to uranium deal with India worth $2.8 billion, Globe and Mail reports, 11/24/2025. |
| 11 | Source: Siteline. Kazakhstan moves to reclaim majority stakes in uranium projects, 12/5/2025. |
| 12 | Source: IsoEnergy, IsoEnergy to Acquire Toro Energy, Strengthening a Top-Tier Uranium Portfolio in a Rising Market, 10/13/2025. |

Investment Risks and Important Disclosure
Relative to other sectors, precious metals and natural resources investments have higher headline risk and are more sensitive to changes in economic data, political or regulatory events, and underlying commodity price fluctuations. Risks related to extraction, storage and liquidity should also be considered.
Gold and precious metals are referred to with terms of art like "store of value," "safe haven" and "safe asset." These terms should not be construed to guarantee any form of investment safety. While “safe” assets like gold, Treasuries, money market funds and cash generally do not carry a high risk of loss relative to other asset classes, any asset may lose value, which may involve the complete loss of invested principal.
Past performance is no guarantee of future results. You cannot invest directly in an index. Investments, commentary and opinions are unique and may not be reflective of any other Sprott entity or affiliate. Forward-looking language should not be construed as predictive. While third-party sources are believed to be reliable, Sprott makes no guarantee as to their accuracy or timeliness. This information does not constitute an offer or solicitation and may not be relied upon or considered to be the rendering of tax, legal, accounting or professional advice.