


View Performance Table as of December 31, 2025
What forces will shape the markets in critical materials and other metals in 2026 and beyond? We identify 10 critical macro and market themes investors should watch in the coming year.
Top 10 Themes for 2026
#1. Deglobalization: The Structural Shift Reshaping Markets
#2. Fiscal Dominance and the Debasement Trade: Outlook for 2026
#3. Fragmentation of Global Metal Inventory Systems
#4. The Long Hard Asset Trade Joins the Debasement Trade
#5. The Run-It-Hot Fiscal and Monetary Policy Playbook
#6. Gold’s Role as a Core Store of Value Strengthens
#7. Silver’s Dynamic Bull Case
#8. Uranium’s Bull Market Setup Strengthens Into 2026
#9. Copper’s Momentum Builds as Supply Shocks Meet Trade Dislocation
#10. Rare Earths’ Strategic Supply Chain Rebuild
#1. Deglobalization: The Structural Shift Reshaping Markets
Deglobalization has accelerated into a defining force reshaping global markets. In 2026, this theme is expected to deepen and broaden across economic, geopolitical and investment landscapes. The old global order is dissolving, marked by aggressive geopolitical maneuvers and rising tensions that are destabilizing the international system.
From a commodities perspective, nations are increasingly prioritizing sovereignty and resilience over efficiency, which is driving structural inflationary pressures and altering global commodity flows. Hard assets, critical minerals and energy security are emerging as strategic levers in a multi-polar world, while nations and corporations are pivoting toward nearshoring and automation to mitigate supply chain risks. These changes are not cyclical or isolated but reflect a systemic reordering of global trade, finance and resource allocation.
Gold is reclaiming its role as a truly neutral reserve asset.
Trade fragmentation is accelerating as tariffs, export controls and capital restrictions dismantle the decades-long process of global integration. Governments are incentivizing the domestic production of semiconductors, critical minerals and energy, prioritizing sovereignty over cost optimization. This shift is creating persistent inflationary pressures and reinforcing the need for strategic resource control.
Gold, as a strategic neutral reserve asset, and critical minerals such as rare earths elements, uranium, copper and silver have become geopolitical tools. Resource-rich nations are leveraging these assets to strengthen bargaining power and attract investment. Mining equities and commodity ETFs are well-positioned to benefit from these structural tailwinds, as demand for these metals and minerals increases in the defense, technology and energy sectors.
Figure 1. Gold and Silver Outperform Asset Classes in 2025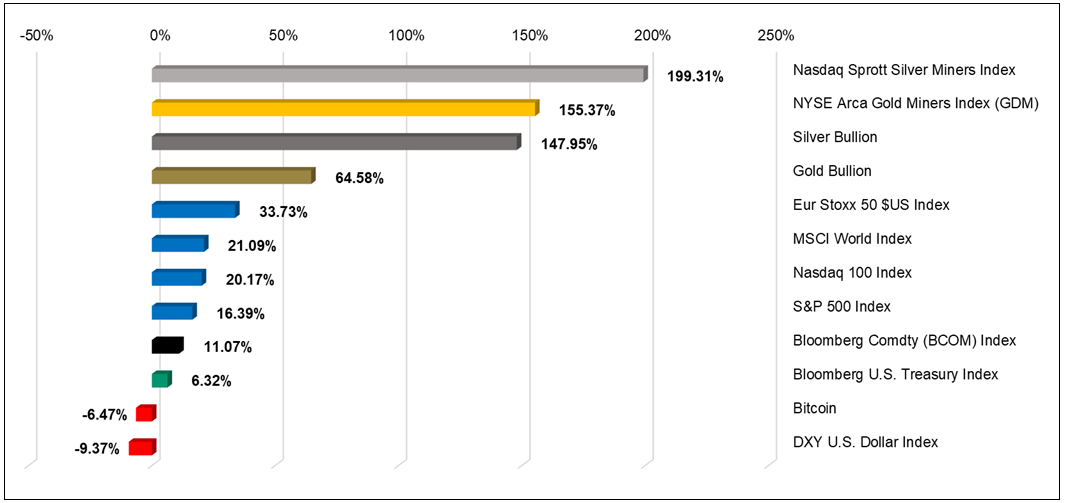
Source: Data as of 12/31/2025. See footnote 1 for definitions.* Past performance is no guarantee of future results.
Energy security is another cornerstone of deglobalization. Nuclear and renewable energy sources are gaining momentum as nations seek secure and sustainable energy supplies. Fossil fuels remain relevant but face declining trade flows, introducing “peak trade” risk and reinforcing1 the need for diversified energy strategies.
Defense spending and the development of AI infrastructure are driving up demand for industrial metals. Modern military equipment consumes vast quantities of critical minerals, while the AI-driven capital expenditure boom is fueling a surge in copper, silver and other metals. AI infrastructure is now considered a matter of national security, further elevating the strategic importance of physical natural resources.
Deglobalization also accelerates de-dollarization, as countries diversify reserves away from the U.S. dollar. Gold is gaining prominence as the globally accepted neutral reserve asset, reinforcing its role as a hedge against systemic risk and geopolitical uncertainty. The global debasement further amplifies the demand for gold.
Nations and corporations are responding by investing heavily in nearshoring and friend-shoring strategies. These efforts involve significant capital expenditure in industrial automation, logistics and energy infrastructure to localize production. However, this shift raises domestic costs and erodes comparative advantage, embedding an inflationary bias across economies. As a result, inflation hedges such as precious metals, commodities, real estate and inflation-linked bonds are being allocated to portfolios.
Deglobalization has become a structural transformation and reversal of the market trends of the past several decades, which will define market behavior for years to come. We anticipate persistent inflation, elevated geopolitical risk premiums, and a reevaluation of assets such as precious metals and critical minerals, which are tied to sovereignty, security and control of resources.
#2. Fiscal Dominance and the Debasement Trade: Outlook for 2026
The pandemic-era policy mix of greater debt, deficits and stimulus has entrenched fiscal dominance as a structural regime. In this environment, government spending dictates monetary policy, and central banks increasingly prioritize debt sustainability over inflation control. This dynamic underpins the debasement trade, a secular shift toward hard assets as fiat currencies rapidly lose purchasing power.
In theory, central banks should act independently to maintain price stability. In practice, ballooning deficits and soaring interest expenses have tied policymakers’ hands. Every rate hike amplifies the government’s debt-servicing burden, creating a feedback loop that incentivizes lower rates and liquidity injections, even when inflation remains above target.
By late 2025, this regime was evident across developed markets. The U.S. Treasury’s issuance strategy tilted heavily toward short-duration bills, while the Federal Reserve (the Fed) ended quantitative tightening and resumed balance-sheet expansion. These actions reflect a soft form of yield-curve control designed to suppress term premiums and keep borrowing costs manageable. This shift to short end funding has also moved funding risk to the overnight funding markets, resulting in the Fed resuming quantitative easing (QE) or Reserve Management Purchases (RMPs).
As deficits constrain monetary independence, the case for real assets continues to strengthen.
The debasement trade refers to investor rotation out of fiat-denominated assets and into stores of value such as gold, other precious metals and select commodities. A year ago, the debasement trade was outside of the mainstream, but it has evolved into a structural allocation theme. Persistent deficits, expansionary fiscal policy and liquidity recycling (i.e., reverse repo market funding)2 have entrenched this trend. Chronic deficits have become a defining feature, with U.S. public debt surpassing $38 trillion in 2025, double the level of a decade ago. Few major economies have posted a fiscal surplus since the early 2000s. At the same time, financial repression persists in many jurisdictions, eroding the appeal of sovereign bonds.
Figure 2. U.S. Federal Debt and U.S. Debt to GDP Ratio (1995-2025)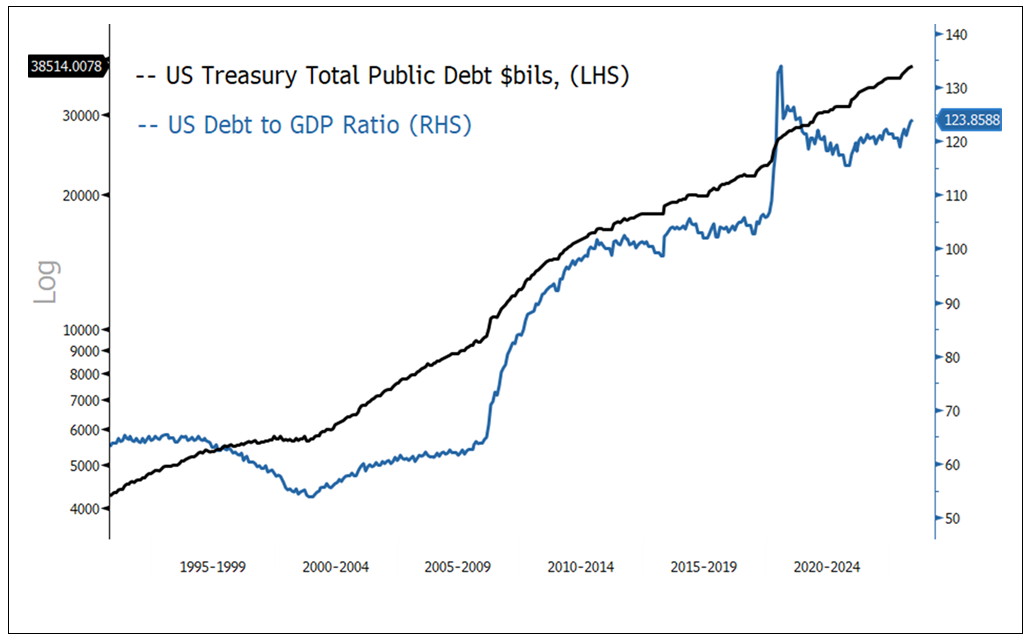
Source: Bloomberg. Data as of 12/31/2025. Past performance is no guarantee of future results.
The outlook for 2026 suggests fiscal dominance appears set to deepen rather than recede. Fed rate cuts are expected to resume mid-year as a new Fed Chair replaces Jerome Powell. The “One Big Beautiful Bill” Act (OBBBA) adds another layer of fiscal stimulus, while tariff uncertainty sustains an inflationary bias. Against this backdrop, the debasement trade is likely to accelerate, reinforcing the strategic case for hard assets in institutional portfolios.
#3. Fragmentation of Global Metal Inventory Systems
The traditional global metal inventory system, built on open trade, efficient arbitrage and centralized warehousing, is breaking down. Historically, metals flowed freely to regions of highest demand, balancing global inventories through transparent exchanges such as the London Metal Exchange (LME) and the Chicago Mercantile Exchange (CME). Today, this mechanism is fracturing as geopolitical tensions, resource nationalism and tariff walls disrupt the free movement of metals.
Resource nationalism has elevated critical minerals to the status of national security assets.
Trade is increasingly weaponized, with tariffs and export controls undermining normal flows. Resource nationalism has elevated critical minerals to the status of national security assets, prompting nations to stockpile rare earths minerals, copper, platinum-group metals (PGMs) and aluminum to insulate themselves against supply shocks. Deglobalization compounds these pressures as Section 232 tariffs3 and similar measures create regional silos, preventing metals from moving efficiently between jurisdictions. These developments have dismantled the arbitrage mechanisms that once ensured global price convergence.
The consequences of this fragmentation are significant. Inventories may appear adequate on a global scale; however, regional constraints can create localized shortages and severe price dislocations. Arbitrage breakdowns are evident in the widening CME-LME copper spread, which reached 30% in 2025, signaling deep frictions in transport and delivery eligibility.
Figure 3. CME–LME Copper Spread (2021-2025)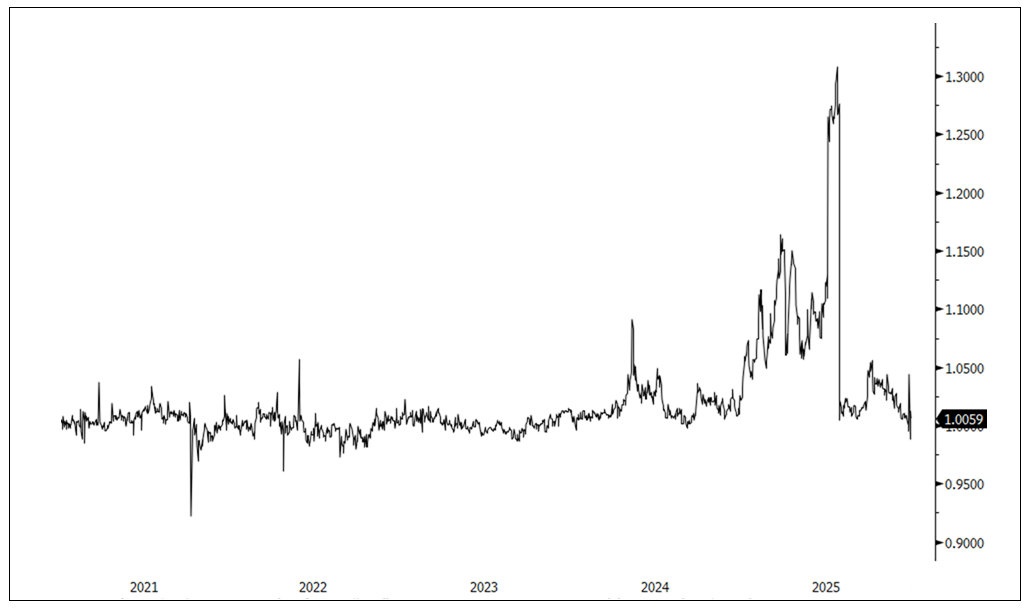
Source: Bloomberg. Data as of 1/13/2026. Past performance is no guarantee of future results.
Prices now embed geopolitical risk alongside traditional supply-demand fundamentals, with metals such as platinum, palladium, nickel and cobalt carrying risk premia. Stockpiling incentives further drain global pools, while Section 232 investigations targeting PGMs, cobalt, tin and zinc could further tighten inventories. Silver, now classified as critical, faces liquidity challenges as ETF flows drain the LBMA free float. This cycle of scarcity persists even without demand shocks, as logistical frictions prevent inventory replenishment, resulting in elevated prices, wider variable spreads and volatility spikes across various metal complexes.
The fragmentation of global metal inventory systems represents a structural shift driven by geopolitics, resource nationalism and security imperatives. This trend aids and underpins the bull market4 in critical metals, where political risk, rather than pure fundamentals, increasingly drives price action. We anticipate persistent volatility, regional price divergence and a bullish bias for metals tied to national security strategies. In this new paradigm, tariff shocks, liquidity squeezes and the breakdown of traditional hedging mechanisms will have a profound impact on metal prices, extending beyond the familiar supply-demand fundamentals.
#4. The Long Hard Asset Trade Joins the Debasement Trade
The long hard asset trade is gaining momentum as an investment theme, converging with the broader debasement narrative that has taken hold in global markets. Structural macro drivers reinforce this shift, beginning with fiscal dominance and the erosion of fiat purchasing power. Persistent fiscal deficits, monetization and liquidity injections continue to undermine currency purchasing power stability. Even with pauses in quantitative tightening, Treasury operations and Federal Reserve facilities continue to sustain liquidity, creating a favorable backdrop for scarce, tangible assets such as gold, silver and critical minerals, over traditional holdings like bonds and cash. Financial repression policies, such as Fed Funds rates near the neutral rate and falling, reinforce this trend, as governments tilt toward short-duration issuance and soft yield-curve control, making inflation hedges, such as hard assets, increasingly attractive.
Fiscal stimulus and the AI-driven capital expenditure boom are reshaping resource demand.
The policy backdrop amplifies these dynamics. Central banks remain accommodative, with the Federal Reserve expected to cut rates by 50 to 75 basis points in 2026 amid sticky inflation. At the same time, fiscal stimulus and the AI-driven capital expenditure boom are reshaping resource demand. Massive investments in data centers, electrification and infrastructure are resource-intensive, driving multi-year structural demand for copper, aluminum, silver, platinum-group metals and energy. This resource-intensive spending is a secular trend tied to the AI technological transformation, as well as national security imperatives.
Supply-side constraints add another layer of support for hard assets. Critical minerals, including copper and silver, as well as other metals, face multi-year structural deficits due to chronic underinvestment in mining, geopolitical bottlenecks and volatile tariff policies. The energy transition and decarbonization push further elevate demand for uranium, battery metals and PGMs, assets that increasingly carry strategic and national security value. In extreme scenarios, these resources risk becoming unobtainable, reinforcing scarcity premiums across commodity markets.
Portfolio construction is undergoing a profound shift as traditional models lose relevance. The 60/40 framework has broken down, with bonds no longer providing reliable hedging power as inflation becomes the secular driving force. Volatility and the growing awareness of the debasement trade have prompted investors to allocate toward commodities. Hard assets now serve as essential hedges against fiscal and monetary credibility shocks, geopolitical fragmentation and supply disruptions. These are portfolio risks that equities and bonds cannot fully mitigate in a rapidly deglobalizing world.
Gold remains well supported by central bank buying, escalating concerns over Federal Reserve independence and persistent global currency debasement. Silver remains in structural deficit, buoyed by industrial demand from solar, AI infrastructure and electric vehicles alongside renewed monetary interest following the 2025 squeeze. Copper consumption is expected to outpace mining capacity as AI infrastructure and grid upgrades accelerate.
Figure 4. Central Bank Purchases of Gold Have Accelerated (2010-2025E)
The last four years have marked a significant increase in central bank demand for gold as they seek to diversify their assets.
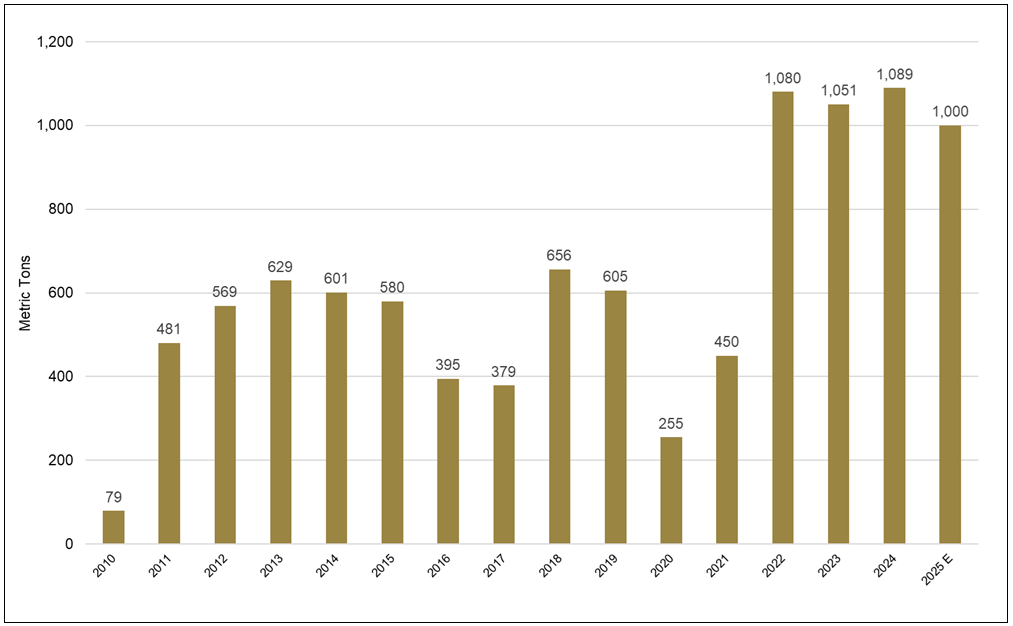
Source: World Gold Council as of 12/31/2025. 2025 estimate derived from Metals Focus.
Geopolitical factors amplify these structural forces. Deglobalization and resource nationalism have weaponized trade, with tariffs, Section 232 investigations and stockpiling policies tightening global commodity pools. Critical materials have become instruments of national security, reinforcing scarcity premiums and volatility. Meanwhile, central banks continue to diversify reserves away from the U.S. dollar, accumulating gold and supporting long-term price floors. Structural liquidity and fiscal dominance, AI-driven capital expenditure, supply deficits and geopolitical fragmentation converge to create a compelling investment case for select commodities.
#5. The Run-It-Hot Fiscal and Monetary Policy Playbook
An alignment of fiscal and monetary stimulus across major economies defines the macro backdrop for 2026. The United States, the European Union and Japan appear committed to running their economies hot, prioritizing rapid economic growth over traditional discipline and inflation control. This policy shift represents a deliberate embrace of aggressive fiscal expansion and accommodative monetary settings, designed to boost nominal GDP (gross domestic product) and alleviate debt and deficit burdens through higher nominal growth.
The U.S. is starting with the One Big Beautiful Bill Act, which delivers sweeping tax cuts, deregulation and pro-growth incentives. These measures aim to turbocharge private investment and consumption, even as the fiscal deficit remains structurally high. Japan, under its new Prime Minister Takaichi, is reviving an Abenomics-style framework, blending aggressive fiscal outlays with ultra-loose monetary policy to push the economy out of stagnation. While the EU’s approach is less defined, early signals suggest a pivot toward industrial policy, increased military spending and green investment, supported by relaxed fiscal rules under the Stability and Growth Pact.5
On the monetary side, the Federal Reserve has lowered the Fed Funds rate to levels at or below its estimated neutral rate, creating a highly stimulative environment. Under a new Fed Chair, policy is expected to go beyond easing in an attempt to drive growth hotter than the trend growth rate. The effect is to erode the real value of debt through inflation and liquidity, a dynamic that underpins the debasement trade. The NY Fed’s DSGE model6 indicates that policy rates are highly accommodative relative to equilibrium, reinforcing the liquidity backdrop. Other major central banks are following suit, signaling a global convergence toward growth-first strategies.
Compounding this shift is the introduction of QE-lite, or Reserve Management Purchases (RMP), by the Fed. Starting with $40 billion of monthly short-term Treasury buying, this program is designed to maintain ample reserves and suppress term premiums without the optics of full-scale quantitative easing. While modest compared to pandemic-era QE, RMP represents a commitment to liquidity support. These purchases are an attempt to cap spreads and volatility in the short-term funding markets, ensuring financial conditions remain loose even as Treasury issuance accelerates. The implications are that yield curves steepen, real financing costs remain suppressed and holding hard assets becomes attractive.
The combination of fiscal dominance and monetary accommodation sets the stage for a reflationary impulse in 2026. Traditional hedges lose efficacy as policy deliberately undermines real returns. In this environment, precious metals, real assets, commodities and inflation-linked instruments become favorable allocations in a world where policy-driven liquidity becomes a primary driver of asset prices.
#6. Gold’s Role as a Core Store of Value Strengthens
Gold’s current bull cycle began in 2022 when Western powers froze Russia’s foreign exchange (FX) reserves. That event shattered the assumption of reserve neutrality and triggered a reassessment of what constitutes “safe” assets. Gold, as a non-sovereign, non-liability asset, regained strategic importance for central banks seeking to insulate themselves from geopolitical risk.
In 2023 and 2024, China emerged as the dominant buyer. Faced with severe stress in its property sector and mounting debt burdens, Beijing adopted a dual strategy: accumulate gold and allow the yuan to weaken against it. This approach effectively inflated away domestic liabilities while reinforcing gold’s role as a hedge against currency debasement. The scale of Chinese purchases during this period was unprecedented, signaling a structural shift in reserve management priorities.
Gold may look overbought, yet it remains underheld in investors’ portfolios.
The year 2025 marked another turning point. Global trade and tariff wars intensified, deepening deglobalization and eroding trust among central banks. The fragmentation of financial systems elevated gold’s status as the ultimate neutral reserve asset. By mid-year, the narrative broadened beyond official-sector buying. Investors began to recognize the depth of fiscal dominance and the resulting systemic debasement of fiat currencies and bonds. Over the last four months of 2025, gold surged as the debasement trade gained momentum, driven by liquidity injections, monetary inflation, and a decline in confidence in traditional hedges.
The leading gold-buying causes of the past few years not only remain in place, but are also compounding. Looking ahead to 2026, fiscal dominance is entrenched, with governments prioritizing debt sustainability over price stability, thereby ensuring that monetary inflation continues to grow. Central bank diversification away from the U.S. dollar is expected to continue, with emerging markets likely to accelerate their gold accumulation as geopolitical fragmentation persists. Investor flows into gold ETFs and physical holdings are likely to remain strong, supported by portfolio rebalancing away from long-duration bonds and into real assets.
In a world of competing currency blocs, persistent deficits and policy co-dependence, gold stands as a globally accepted store of value. While gold's 2026 price action may not match its remarkable 2025 rally, the risk skew remains to the upside, particularly under renewed liquidity waves or geopolitical shocks. While price charts may indicate overbought conditions, gold remains underowned among most investors.
Figure 5. Gold and Silver Have Posted Strong Results Over the Long-Term
Returns for Period from 12/31/1999-12/31/2025
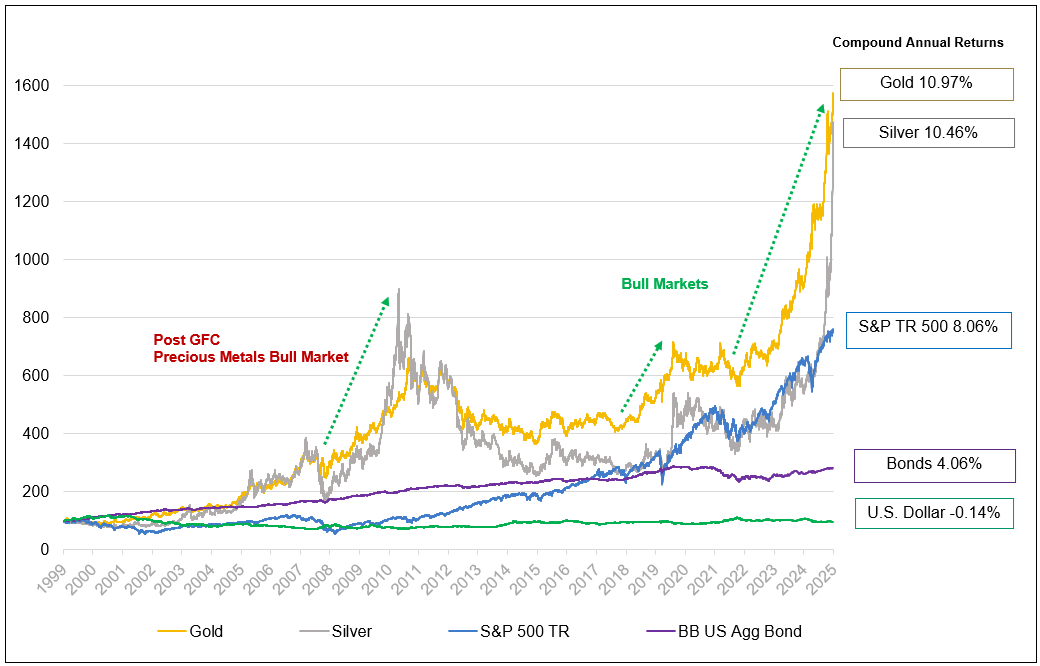
Source: Bloomberg. Period from 12/31/1999-12/31/2025. Gold is measured by GOLDS Comdty Spot Price; Silver is measured by the SILV Comdty Spot Price; S&P 500 TR is measured by the SPX; US Agg Bond Index is measured by the Bloomberg Barclays US Agg Total Return Value Unhedged USD (LBUSTRUU Index); and the U.S. Dollar is measured by DXY Curncy. You cannot invest directly in an index. Past performance is no guarantee of future results.
#7. Silver’s Dynamic Bull Case
Silver’s evolution over the past four years underscores its unique dual role as both a monetary hedge and an industrial metal. The current bull cycle began in 2022 when silver started breaking out of a prolonged consolidation phase. Retail flows and technical setups suggested upside potential, while the gold-silver ratio hovered near historical highs, indicating undervaluation of silver relative to gold. ETF exposure remained light, but low positioning suggested latent demand.
Momentum built in 2023 as ETF inflows and retail positioning recovered from prior oversold risk-off liquidations. At the same time, industrial demand surged, driven by photovoltaics, a new enormous growth driver, reinforcing silver’s strategic importance beyond its monetary characteristics. This period marked the early stages of a structural bull case powered by macroeconomic shifts and technological adoption.
The breakout year came in 2024. Silver decisively pierced key resistance levels, testing the $30 range and triggering price squeezes. These moves were structural rather than headline-driven, fueled by positioning imbalances and convex technical setups. Industrial demand from the solar and electric vehicle sectors tightened physical supply, creating short-term delivery premiums. ETF holdings and futures positioning amplified volatility, cementing silver’s bullish trajectory.
Silver stands out as a strategic asset where monetary and technological trends converge.
The year 2025 was transformative. Silver soared from roughly $30 at the start of the year to close at $71.66, a staggering 148% gain that outpaced gold’s percentage move. Three forces converged to power this rally. First, monetary dynamics shifted as fiscal dominance and rate cuts signaled further monetary inflation. Second, industrial demand exploded, with solar installations and EV adoption driving structural consumption. Third, supply constraints deepened as persistent deficits triggered a global scramble for physical delivery. By late 2025, silver began closing its wide ratio gap to gold, as markets revalued silver’s dual role as a strategic industrial commodity and a monetary hedge in an era of currency debasement and geopolitical fragmentation.
Looking ahead to 2026, silver enters the year with extraordinary momentum and a fundamentally altered narrative. Silver is now positioned as both a monetary hedge and a critical mineral for the massive buildout of AI infrastructure, making it one of the most dynamic assets in global markets. Fiscal dominance and the abandonment of strict inflation targets will likely sustain the debasement trade, reinforcing investor appetite for hard assets as confidence in fiat currencies erodes. A weaker U.S. dollar, driven by accommodative policy and structural deficits, could add another tailwind.
What sets this rally apart from previous surges is the depletion of free-floating silver inventory and its continued high correlation to gold, even as gold is being revalued as a neutral reserve asset by central banks, sovereigns and institutional investors. Supply inelasticity remains a critical constraint. Over 80% of global silver output is a byproduct of base metal mining, limiting the industry’s ability to respond to price signals. New projects face permitting delays and declining ore grades, while recycling volumes remain insufficient to bridge the gap. Structural supply and inventory deficits are expected to persist into 2026 and beyond, particularly if investment demand continues to grow. This imbalance between surging demand and constrained supply likely creates a powerful backdrop for silver, though price appreciation may be volatile.
While consolidation after silver's impressive 2025 rally is possible, we believe the longer-term risk skew remains to the upside. Renewed liquidity waves, geopolitical shocks and depleted inventories could drive higher prices. Silver’s unique combination of monetary attributes and critical industrial applications positions it as both an inflation hedge and a direct beneficiary of growth in AI-related themes. In short, silver stands at the junction of macroeconomic policy, technological transformation and resource scarcity.
#8. Uranium’s Bull Market Setup Strengthens Into 2026
We believe uranium is well-positioned for 2026 to build on its longer-term bull market as tightening fundamentals, improving policy clarity and a re-accelerating contracting cycle begin to align. Momentum is already visible. Spot uranium gained 11.43% in 2025, while uranium miners climbed 41.95% and junior uranium miners rose 47.49%. The term price is breaking out after months of stagnation, rising to $86 per pound, which signals utilities are beginning to accept higher long‑term prices even while contracting volumes remain below replacement-rate levels.
Tight supply and rising reactor demand are powering uranium’s bullish momentum.
Several late-2025 developments are setting a stronger foundation for 2026. Policy uncertainty that sidelined utilities earlier in the year has lifted, and the market is accelerating buying behavior as policy clarity improves. The U.S. has made its intentions clear by providing up to $80 billion of funding support to build new reactors, for the first time in many years, among multiple other positive policy actions. Big Tech is reinforcing the demand side as well. Microsoft, Amazon, Google and Meta are making multi-year, multi-billion-dollar commitments to secure nuclear power for the growth of AI and data centers, elevating nuclear from a decarbonization tool to a reliable solution to the ever-increasing demand for electricity. This is occurring alongside continued progress on reactor restarts and life extensions, reinforcing that nuclear is increasingly treated as essential, reliable baseload capacity while electricity demand rises and grid constraints become more visible.
Supply remains a ballast of the bullish case. The uranium market remains tight as supply growth fails to keep pace with the increasing demand from reactors. Production is concentrated and slow-moving; new projects face long lead times, and geopolitical and jurisdictional risks persist as a significant part of the price formation process. In a deglobalizing world, supply concentration increasingly carries a security premium, especially as much of the current supply is outside the West. Producer discipline reinforces this dynamic. Large producers have shown no willingness to expand output without higher prices, and the market continues to face the practical reality that meaningful greenfield supply is difficult to deliver quickly and efficiently.
As utilities procure fuel years in advance, term contracting today is what determines coverage for the early 2030s and beyond. The replacement rate for contracting is around 150 million pounds per year, yet contracting in 2025 remained well below that level, for a 13th consecutive year. This matters because deferred procurement does not disappear; it accumulates over time. Utilities can delay contracting for a time, but uncovered requirements do not go away. As contracting normalizes toward replacement levels, we believe the uranium market may gain pace in 2026.
Taken together, uranium’s outlook is strengthening for reasons that are observable and structural: improving policy clarity, expanding AI-linked and utility-led demand visibility, a constrained supply response and a contracting cycle that has room to re-accelerate. In a commodity where procurement is ultimately non-discretionary, and supply is slow to adjust, these conditions support a bullish bias for uranium prices and uranium equities as 2026 unfolds.
Figure 6. Uranium Price Moves Higher in 2025 (2021-2025)
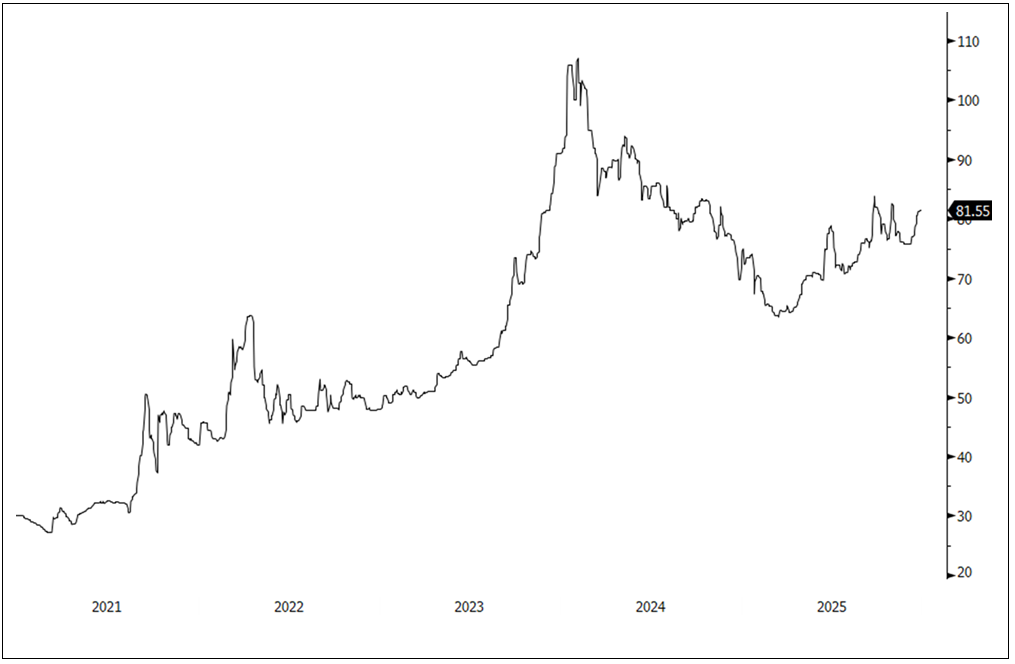
Source: Bloomberg. Data as of 1/13/2026. Past performance is no guarantee of future results.
#9. Copper’s Momentum Builds as Supply Shocks Meet Trade Dislocation
Copper is poised to surge into 2026 after a breakout year in 2025. Copper spot gained 43.93% in 2025, while copper miners rose 74.59% and junior copper miners climbed 132.42%. That strength has carried straight into January, with the copper prices already pushing above $13,000 per metric ton and continuing to set fresh all-time highs. Copper has become a strategic bottleneck, where repeated supply disruptions and tariff-driven trade distortions are tightening availability outside the U.S., leaving the global system with a reduced ability to rebalance smoothly.
Copper has become a strategic bottleneck and the market is feeling the squeeze.
Supply has been the spark, and two events in particular reset the market’s trajectory, the shutdowns at the Grasberg and Kamoa-Kakula copper mines. This matters because copper was already operating with limited inventories after years of underinvestment, declining ore grades and long development timelines. An additional stress signal is copper treatment charges, which have been pushed to extreme lows, reflecting tight conditions across the supply chain.
At the same time, copper’s demand profile is transforming, moving beyond traditional sectors like construction and consumer goods toward areas that are strategically vital for global progress and fast-growing, including energy infrastructure, advanced technology and defense. As grids are expanded and modernized, the demand for copper increases. As computing and connectivity scale, copper remains a core input that is difficult to substitute in many high-performance applications. As defense and security priorities increase, governments and industry are placing a higher value on reliable access to critical inputs, such as copper.
Copper’s supply deficit backdrop reinforces why this is not a story that resolves quickly. Bringing a new mine from discovery to production now averages about 17 years, which means deficits can persist even when prices are strong. In this environment, copper miners may be well positioned to benefit, with healthy margins supported by strong demand and constrained supply elasticity. Investors are already responding by allocating to physical metal and mining equities, anticipating multi-year cycles of scarcity that amplify price momentum and reinforce confidence in long-term fundamentals. In a world where critical materials are increasingly shaped by policy, security of supply, and less efficient global rebalancing, we believe copper merits investor consideration for the years ahead.
Figure 7. Copper Reaches All-Time High in 2025 (2021-2025)
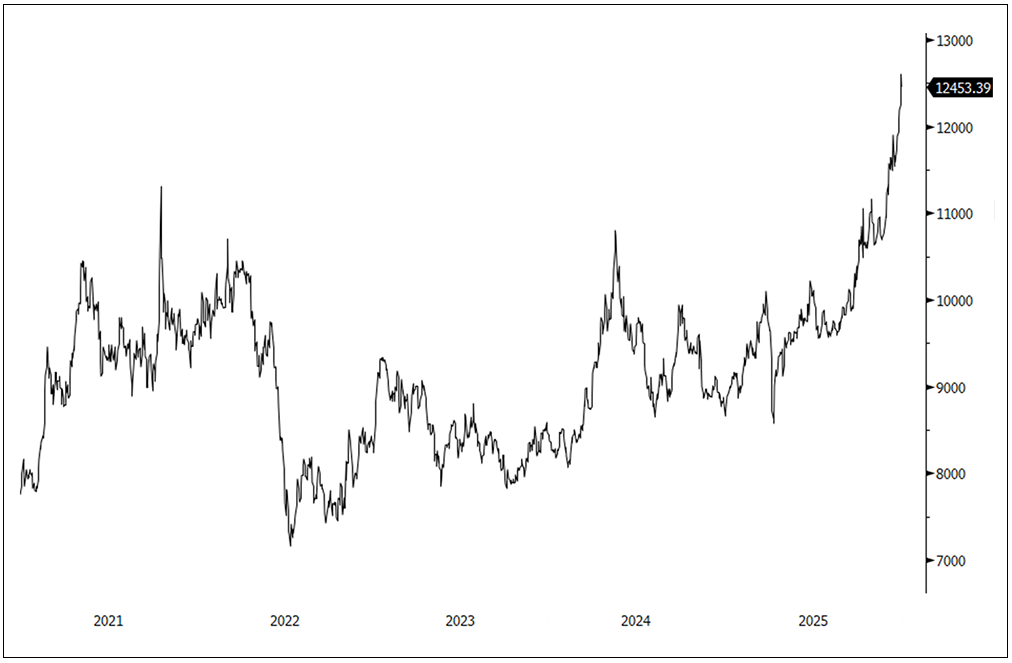
Source: Bloomberg. Data as of 1/13/2026. Past performance is no guarantee of future results.
#10. Rare Earths’ Strategic Supply Chain Rebuild
Rare earths enter 2026 with powerful tailwinds that complement the broader strength we see across critical materials. Rare earths represent a distinct, highly strategic bottleneck where supply security can matter as much as price, which is why they remain central to specialized applications. They support some of the most critical sectors of the world’s economy, including AI and data centers, advanced manufacturing, defense and the buildout of energy and technology infrastructure.
The core vulnerability is concentration. China remains the dominant producer of rare earths and controls the vast majority of downstream refining and permanent magnet manufacturing capacity. That imbalance is why 2026 is likely to be defined by faster development of supply chains outside China. The shift that accelerated in 2025 is that governments moved from signaling concern to actively shaping outcomes. In the U.S., rare earths independence has been elevated within industrial policy, and the toolkit now includes faster permitting pathways, expanded financing channels, direct public investment, and protective measures intended to help domestic capacity reach commercial scale.
Rare earths are becoming a national priority—and supply security now matters as much as price.
The most consequential proof point came in 2025. The Department of Defense took an equity stake in a leading U.S. producer and paired that with a minimum price floor for NdPr (Neodymium-Praseodymium is a rare earth metal alloy/oxide) set well above prevailing market levels. In parallel, the support was designed to accelerate new U.S. magnet manufacturing capacity, with a commitment that 100% of its output from the new facility would be purchased once it was operational. The practical implication is that the sector is no longer dependent solely on risk capital. Public sector participation is enhancing revenue visibility, mitigating project risk and increasing the likelihood that new capacity is actually implemented.
Into 2026, the tailwinds are strengthening as supply security becomes a more explicit driver of policy and capital allocation. U.S. foreign policy actions have become less predictable, and that unpredictability can reinforce the urgency to secure critical inputs outside concentrated supply chains. Any further deterioration in the relationship between Washington and Beijing, or additional tightening of trade and export policy, can quickly refocus markets on the reality that rare earths remain a critical dependency for strategically important applications. In that environment, capital and policy support tend to flow toward non‑Chinese rare earths companies. We view this as a backdrop where rare earths miners outside of China are well-positioned to benefit from nations prioritizing the development of resilient supply chains.
Figure 8. Rare Earths Enter 2026 with Tailwinds (2021-2025)
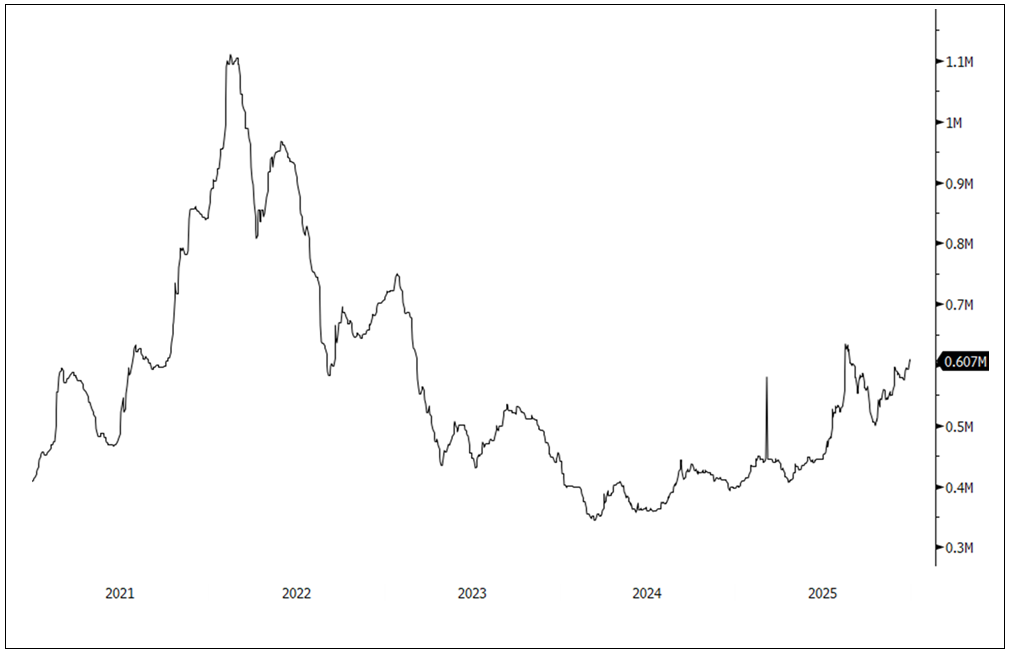
Source: Bloomberg. Data as of 1/13/2026. Past performance is no guarantee of future results.
Performance as of December 31, 2025
| Metric | 12/31/2025 | 12/31/2024 | Year Change | Year % Change | Analysis |
| Physical Materials | |||||
| Gold Bullion Spot Price $/oz7 | 4,319.37 | 2,624.50 | 1,694.87 | 64.58% |
Gold and silver made new all-time highs. Best annual returns since 1979. |
| Silver Bullion Spot Price $/oz8 | 71.66 | 28.90 | 42.76 | 147.95% | |
| U3O8 Uranium Spot Price $/lb9 | 81.55 | 73.00 | 8.55 | 11.71% |
Copper continues to hit all-time highs. Uranium's volatile year ends with positive momentum. Lithium and nickel rebound after a negative 2024. |
| LME Copper Spot Price $/lb10 | 5.65 | 3.92 | 1.72 | 43.93% | |
| Lithium Carbonate Spot Price $/lb11 | 7.72 | 4.69 | 3.03 | 64.64% | |
| LME Nickel Spot Price $/lb12 | 7.48 | 6.85 | 0.63 | 9.20% | |
| Miners | |||||
| Solactive Gold Miners Custom Factors Index13 | 342.89 | 134.65 | 208.24 | 154.65% |
Precious metals miners made new all-time highs. |
| Nasdaq Sprott Silver Miners Index™ 14 | 2,866.92 | 957.84 | 1,909.09 | 199.31% | |
| Nasdaq Sprott Critical Materials™ Index15 | 1,645.04 | 849.53 | 795.51 | 93.64% |
Critical materials complex and copper hitting all-time highs. Uranium miners rallied. Lithium and nickel miners have regained momentum after an extended downturn. Junior miners outperformed with increased leverage. |
| Nasdaq Sprott Lithium Miners™ Index16 | 780.95 | 408.60 | 372.36 | 91.13% | |
| North Shore Global Uranium Mining Index17 | 4,744.50 | 3,342.43 | 1,402.07 | 41.95% | |
| Nasdaq Sprott Copper Miners™ Index18 | 1,901.75 | 1,101.10 | 800.65 | 72.71% | |
| Nasdaq Sprott Nickel Miners™ Index19 | 766.73 | 513.55 | 253.18 | 49.30% | |
| Nasdaq Sprott Junior Copper Miners™ Index20 | 2,446.58 | 1,067.70 | 1,378.89 | 129.15% | |
| Nasdaq Sprott Junior Uranium Miners™ Index21 | 1,789.88 | 1,213.77 | 576.12 | 47.47% | |
| Benchmarks | |||||
| S&P 500 Index22 | 6,845.50 | 5,881.63 | 963.87 | 16.39% |
S&P 500 made new all-time highs. DXY's worst down year since 2017. Commodities breaking out from base. |
| DXY US Dollar Index23 | 98.32 | 108.49 | -10.17 | -9.37% | |
| BBG Commodity Index24 | 109.69 | 98.76 | 10.93 | 11.07% | |
*Source: Data as of 12/31/2025. The Nasdaq Sprott Silver Miners™ Index (NSLVR™) is designed to track the performance of a selection of securities in the silver industry, including silver producers, developers and explorers, and physical silver. The NYSE Arca Gold Miners Index (GDM) is a rules-based index designed to measure the performance of highly capitalized companies in the gold mining industry. Silver bullion is measured by the Bloomberg Silver (XAG Curncy) U.S. dollar spot rate. Gold bullion is measured by the Bloomberg GOLDS Comdty Index. The EURO STOXX 50 Index represents 50 leading blue-chip stocks from the Eurozone. The MSCI World Index represents large and mid-cap companies across Developed Market countries. The S&P 500 or Standard & Poor's 500 Index is a market-capitalization-weighted index of the 500 largest U.S. publicly traded companies. The Bloomberg Commodity Index (BCOM) is a broadly diversified commodity price index distributed by Bloomberg Indices. The Bloomberg US Treasury Index measures U.S. dollar-denominated, fixed-rate, nominal debt issued by the US Treasury. Bitcoin is digital money that isn't controlled by any bank or government. The U.S. Dollar Index (USDX, DXY, DX) is an index (or measure) of the value of the United States dollar relative to a basket of foreign currencies, often referred to as a basket of U.S. trade partners' currencies. You cannot invest directly in an index.
- For the latest standardized performance of the Sprott ETFs, please visit the individual website pages: SETM, URNM, URNJ, COPP, COPJ, LITP, NIKL, GBUG, SGDM, SGDJ, SLVR and METL. Past performance is no guarantee of future results.
Footnotes
| 1 | Peak trade risk refers to the economic and supply‑chain vulnerabilities that arise when global trade volumes stop growing and begin to stagnate or decline, often due to geopolitical tensions, protectionist policies or the unwinding of global supply chains. |
| 2 | Reverse repo (or repurchase agreement) market funding is when investors or institutions lend cash to the Fed or another party in exchange for securities, helping manage short‑term interest rates and keep markets stable. |
| 3 | Section 232 tariffs are import taxes the U.S. government can impose on certain foreign goods, like steel or aluminum, when it believes those imports threaten national security. |
| 4 | Prices are rising in a bull market. Bullish investors expect prices to continue rising. |
| 5 | The Stability and Growth Pact is a set of rules used by the European Union to help keep member countries’ government spending and debt at sustainable levels so the euro remains stable. |
| 6 | The NY Fed’s stochastic general equilibrium (DSGE) model generates forecasts for key macroeconomic variables and serves as a tool for policy analysis. |
| 7 | Gold bullion is measured by the Bloomberg GOLDS Comdty Index. |
| 8 | Silver bullion is measured by Bloomberg Silver (XAG Curncy) U.S. dollar spot rate. |
| 9 | The U3O8 uranium spot price is measured by a proprietary composite of U3O8 spot prices from UxC, S&P Platts and Numerco. |
| 10 | The copper spot price is measured by the LME Copper Cash ($). Source: Bloomberg ticker LMCADY. Data converted to pounds. |
| 11 | The lithium carbonate spot price is measured by the China Lithium Carbonate 99.5% DEL. Source: Bloomberg and Asian Metal Inc. Ticker L4CNMJGO AMTL Index. Data converted to pounds and to USD with Bloomberg FX Rates. |
| 12 | The nickel spot price is measured by the LME Nickel Cash ($). Source: Bloomberg ticker LMNIDY. Data converted to pounds. |
| 13 | The Gold Miners Index refers to the Solactive Gold Miners Custom Factors Index (SOLGMCFT), which was created by Solactive AG to provide a means of generally tracking the performance of gold mining companies whose stocks are traded on Canadian and major U.S. exchanges. |
| 14 | The Nasdaq Sprott Silver Miners™ Index (NSLVR™) is designed to track the performance of a selection of securities in the silver industry, including silver producers, developers and explorers, and physical silver. |
| 15 | The Nasdaq Sprott Critical Materials™ Index (NSETM™) is designed to track the performance of a selection of global securities in the critical materials industry, and was co-developed by Nasdaq® and Sprott Asset Management LP. |
| 16 | The Nasdaq Sprott Lithium Miners™ Index (NSLITP™) is designed to track the performance of a selection of global securities in the lithium industry, including lithium producers, developers and explorers; the index was co-developed by Nasdaq® and Sprott Asset Management LP. |
| 17 | The North Shore Global Uranium Mining Index (URNMX) is designed to track the performance of companies that devote at least 50% of their assets to the uranium mining industry, which may include mining, exploration, development and production of uranium, or holding physical uranium, owning uranium royalties or engaging in other non-mining activities that support the uranium mining industry. |
| 18 | Nasdaq Sprott Copper Miners™ Index (NSCOPP™) is designed to track the performance of a selection of global securities in the copper industry, including copper producers, developers and explorers, and physical copper. |
| 19 | Nasdaq Sprott Nickel Miners™ Index (NSNIKL™) is designed to track the performance of a selection of global securities in the nickel industry. |
| 20 | Nasdaq Sprott Junior Copper Miners™ Index (NSCOPJ™) is designed to track the performance of mid-, small- and micro-cap companies in copper-mining related businesses. |
| 21 | Nasdaq Sprott Junior Uranium Miners™ Index (NSURNJ™) is designed to track the performance of mid-, small- and micro-cap companies in uranium-mining related businesses. |
| 22 | The S&P 500 or Standard & Poor's 500 Index is a market-capitalization-weighted index of the 500 largest U.S. publicly traded companies. |
| 23 | The U.S. Dollar Index (USDX, DXY) is an index of the value of the U.S. dollar relative to a basket of foreign currencies. |
| 24 | The Bloomberg Commodity Index (BCOM) is a broadly diversified commodity price index that tracks prices of futures contracts on physical commodities, and is designed to minimize concentration in any one commodity or sector. It currently has 23 commodity futures in six sectors. |


Investment Risks and Important Disclosure
Relative to other sectors, precious metals and natural resources investments have higher headline risk and are more sensitive to changes in economic data, political or regulatory events, and underlying commodity price fluctuations. Risks related to extraction, storage and liquidity should also be considered.
Gold and precious metals are referred to with terms of art like "store of value," "safe haven" and "safe asset." These terms should not be construed to guarantee any form of investment safety. While “safe” assets like gold, Treasuries, money market funds and cash generally do not carry a high risk of loss relative to other asset classes, any asset may lose value, which may involve the complete loss of invested principal.
Past performance is no guarantee of future results. You cannot invest directly in an index. Investments, commentary and opinions are unique and may not be reflective of any other Sprott entity or affiliate. Forward-looking language should not be construed as predictive. While third-party sources are believed to be reliable, Sprott makes no guarantee as to their accuracy or timeliness. This information does not constitute an offer or solicitation and may not be relied upon or considered to be the rendering of tax, legal, accounting or professional advice.