It’s been a summer of doldrums for many asset classes, including precious metals. In our universe, however, uranium and other energy transition metals were a welcome exception to the market carnage; for example, our spot uranium oxide proprietary composite7 was up 8.73% in August and 25.45% YTD. Precious metals, by contrast, lost ground in August as a liquidity crunch took hold. Gold declined 3.11% in August and is off 6.46% YTD through August 31, 2022. Silver bullion2 had a difficult month, falling 11.62% and bringing its YTD return to -22.81%. Gold mining equities3 magnified gold bullion's loss by declining 10.00% in August and are down 24.16% YTD. The broader equities markets have been trounced as well, with the S&P 500 Index6 off 4.08% for August and its YTD return now -16.14% YTD, and the U.S. Treasury Index with a YTD decline of 9.98%.
Month of August 2022
| Indicator | 8/31/2022 | 7/31/2022 | Change | Mo % Chg | YTD % Chg | Analysis |
| Gold Bullion1 | $1,711.04 | $1,765.94 | ($54.90) | (3.11)% | (6.46)% | Back to the $1,700 lower trade range |
| Silver Bullion2 | $17.99 | $20.36 | ($2.37) | (11.62)% | (22.81)% | New 52-week low, back to prior long-term range |
| Gold Senior Equities (SOLGMCFT Index)3 | 94.71 | 105.10 | (10.39) | (9.89)% | (23.22)% | New 52-week low, back to prior long-term range |
| Gold Equities (GDX)4 | $23.80 | $26.27 | ($2.47) | (9.40)% | (25.69)% | (Same as above) |
| DXY US Dollar Index5 | 108.70 | 105.90 | 2.80 | 2.64% | 13.62% | Highest level since June 2002 |
| S&P 500 Index6 | 3,955.00 | 4,130.29 | (175.29) | (4.24)% | (17.02)% | Retraced half of summer rally |
| U.S. Treasury Index | $2,250.42 | $2,307.67 | ($57.25) | (2.48)% | (9.98)% | Jackson Hole Fed Meeting reaffirms hawkish Fed |
| U.S. Treasury 10 YR Yield* | 3.19% | 2.65% | 0.54% | 54 BPS | 168 BPS | Yields resume climb on further rate hikes |
| U.S. Treasury 10 YR Real Yield* | 0.71% | 0.09% | 0.61% | 61 BPS | 181 BPS | Real yields back to near recent highs |
| Silver ETFs (Total Known Holdings ETSITOTL Index Bloomberg) | 773.37 | 790.02 | (16.65) | (2.11)% | (12.72)% | Back to June 2020 levels |
| Gold ETFs (Total Known Holdings ETFGTOTL Index Bloomberg) | 99.86 | 101.33 | (1.47) | (1.45)% | 2.06% | Surrendered ~80% of 2022 gains |
Source: Bloomberg and Sprott Asset Management LP. Data as of August 31, 2022.
*Mo % Chg and YTD % Chg for this Index are calculated as the difference between the month end's yield and the previous period end's yield, instead of the percentage change. BPS stands for basis points.
Gold Bullion Recap
Gold finished August priced at $1,710 per ounce, a 3.3% decline for the month. Early in August, gold recovered to $1,800 per ounce after July's sell-off, as markets continued to bet that the U.S. Federal Reserve (“Fed”) would be less aggressive with interest rate hikes given the slowing U.S. economy. However, by mid-month, hawkish Fed comments pushed gold lower along with a stronger U.S. dollar (DXY) and as U.S. 10-year Treasury yields edged back up above 3.00%. Toward the end of August, the market mood began to shift as inflation data came in under expectations as oil prices eased.
Greater concern developed over the impact of declining economic activity on corporate profits in response to Fed Chair Jerome Powell's comments at the Fed's 2022 Economic Policy Symposium, "Reassessing Constraints on the Economy and Policy," held on August 25-27 in Jackson Hole, Wyoming. Powell commented that the degree of any interest rate increases and policy response "will depend on the totality of the incoming data and evolving outlook," and that a restrictive policy stance is likely to stay in place for some time and while history "cautions strongly against prematurely loosening policy". August saw continued outflows from gold ETFs, which had been underway since mid-June when the Fed raised interest rates by 75 basis points. Gold equities followed gold prices and disappointed, failing to gain additional ground after its late July bounce.
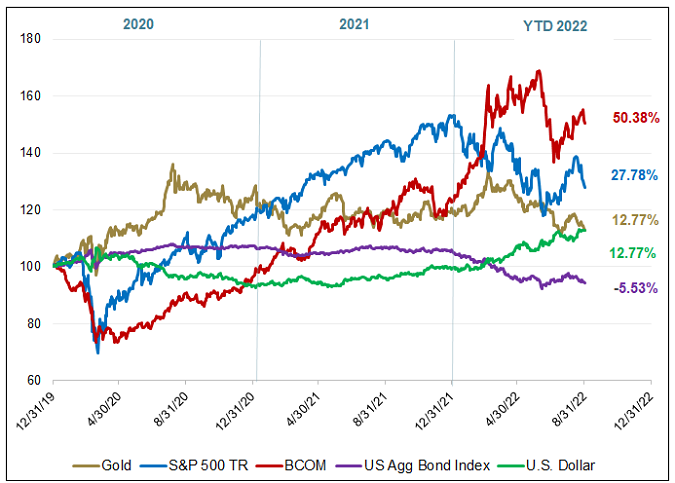
Figure 1. Gold vs. Stocks, Bonds, USD and Commodities (2020-2022)

Source: Bloomberg and Sprott Asset Management. Data as of 8/31/2022. Gold is measured by GOLDS Comdty Spot Price; S&P 500 TR is measured by the SPX; BCOM is the Bloomberg Commodity Index; US Agg Bond Index is measured by the Bloomberg Barclays US Agg Total Return Value Unhedged USD (LBUSTRUU Index); and the U.S. Dollar is measured by DXY Curncy. Included for illustrative purposes only. Past performance is no guarantee of future results.
Gold Miners Outlook
In reporting Q2 2022 operating activity, several gold miners acknowledged the inflationary pressure on profit margins, with operating costs rising around 10%. However, at the same time, several miners noted that costs were beginning to ease as oil prices pulled back. Many gold producers continued to be plagued by COVID's impact but have indicated that the second half of the year should see higher production as mining plans have adjusted to labor and input cost pressures.
With additional Fed interest rate hikes in store, gold price support at around $1,600 per ounce is important, given this is the approximate level that gold prices were trading at the beginning of the COVID pandemic and before the extraordinary fiscal and monetary stimulus of the past several years. Should interest rates weaken the economy further or take it into a protracted downturn, we believe that gold prices will likely benefit as the value of other financial assets diminish.
| 1 | Gold bullion is measured by the Bloomberg GOLDS Comdty Spot Price. |
| 2 | Silver bullion is measured by Bloomberg Silver (XAG Curncy) U.S. dollar spot rate. |
| 3 | The Solactive Gold Miners Custom Factors Index (Index Ticker: SOLGMCFT) aims to track the performance of larger-sized gold mining companies whose stocks are listed on Canadian and major U.S. exchanges. |
| 4 | VanEck Vectors® Gold Miners ETF (GDX®) seeks to replicate as closely as possible, before fees and expenses, the price and yield performance of the NYSE Arca Gold Miners Index (GDMNTR), which is intended to track the overall performance of companies involved in the gold mining industry. The SPDR Gold Shares ETF (GLD) is one of the largest gold ETFs. |
| 5 | The U.S. Dollar Index (USDX, DXY, DX) is an index (or measure) of the value of the United States dollar relative to a basket of foreign currencies, often referred to as a basket of U.S. trade partners' currencies. |
| 6 | The S&P 500 or Standard & Poor's 500 Index is a market-capitalization-weighted index of the 500 largest U.S. publicly traded companies. |
| 7 | The uranium spot price is measured by a proprietary composite of U3O8 spot prices from UxC, S&P Platts and Numerco, used as a benchmark for Sprott Physical Uranium Trust. |
Important Disclosure
Past performance is no guarantee of future results. You cannot invest directly in an index. Investments, commentary and statements are that of the author and may not be reflective of investments and commentary in other strategies managed by Sprott Asset Management USA, Inc., Sprott Asset Management LP, Sprott Inc., or any other Sprott entity or affiliate. Opinions expressed in this commentary are those of the author and may vary widely from opinions of other Sprott affiliated Portfolio Managers or investment professionals.
This content may not be reproduced in any form, or referred to in any other publication, without acknowledgment that it was produced by Sprott Asset Management LP and a reference to sprott.com. The opinions, estimates and projections (“information”) contained within this content are solely those of Sprott Asset Management LP (“SAM LP”) and are subject to change without notice. SAM LP makes every effort to ensure that the information has been derived from sources believed to be reliable and accurate. However, SAM LP assumes no responsibility for any losses or damages, whether direct or indirect, which arise out of the use of this information. SAM LP is not under any obligation to update or keep current the information contained herein. The information should not be regarded by recipients as a substitute for the exercise of their own judgment. Please contact your own personal advisor on your particular circumstances. Views expressed regarding a particular company, security, industry or market sector should not be considered an indication of trading intent of any investment funds managed by Sprott Asset Management LP. These views are not to be considered as investment advice nor should they be considered a recommendation to buy or sell. SAM LP and/or its affiliates may collectively beneficially own/control 1% or more of any class of the equity securities of the issuers mentioned in this report. SAM LP and/or its affiliates may hold a short position in any class of the equity securities of the issuers mentioned in this report. During the preceding 12 months, SAM LP and/or its affiliates may have received remuneration other than normal course investment advisory or trade execution services from the issuers mentioned in this report.
The information contained herein does not constitute an offer or solicitation to anyone in the United States or in any other jurisdiction in which such an offer or solicitation is not authorized or to any person to whom it is unlawful to make such an offer or solicitation. Prospective investors who are not residents of Canada or the United States should contact their financial advisor to determine whether securities of the Funds may be lawfully sold in their jurisdiction.
The information provided is general in nature and is provided with the understanding that it may not be relied upon as, or considered to be, the rendering of tax, legal, accounting or professional advice. Readers should consult with their own accountants and/or lawyers for advice on their specific circumstances before taking any action.
© 2024 Sprott Inc. All rights reserved.

