Sprott Gold Report
Is My Money Safe?
In a word, no. Safety first. What to do with my money is the first question that comes to mind in the midst of the banking crisis. Consider two aspects: First, could access to cash and other liquid assets be jeopardized by the spread of adverse economic conditions? Second, could the future purchasing power of money be damaged by government policies that are inflationary? The answer to both questions is "yes".
Are Bank Deposits Safe?
The phrase "like money in the bank" used to connote something positive. That nuance may no longer pertain. As loans to banking institutions, deposits are ultimately subject to risks directly related to the investment decisions of bank management. The business model of banking is to borrow short (deposits of bank customers) and lend those funds out long term. In normal times, the traditional banking business model worked just fine. However, when short-term interest rates rise rapidly and unexpectedly, that business model can bring nothing but bad news.
Let it be said here, since the financial media at best pays only lip service to the thought: there is likely no safer asset than physical gold.
Loss of confidence in depository (banking) institutions can become self-feeding and alone sufficient to undermine the safety of deposits. The failures of Silicon Valley Bank (SVB), Signature Bank and the shotgun marriage of systemically important Credit Suisse to UBS have given rise to questions over the solvency of the global banking system. In our opinion, those failures were not isolated events but endemic to the "borrow short/lend long" business model. The problem is that for a business strategy of financial leverage to be successful, the cost of borrowing must "behave" which means that the cost must remain below the return on investments in the bank portfolio. A "misbehaving" cost of borrowing (or cost of carry) can turn what were once good investments into money-losing propositions.
The charts below (Figures 1-3) depict a banking system that is illiquid and possibly insolvent. Rising interest rates have turned much of the asset side of the banking system balance sheet into bad loans. The experience of loan losses will turn lenders cautious. That caution will reduce credit availability and likely cause a recession, which in turn will undermine the ability of borrowers to repay their loans.
Figure 1. Banks Held $17.5 Trillion in Loans and Securities at Yearend 2022
Equity in the banking system was $2.2 trillion, while estimated unrealized losses on total bank credit reached $1.7 trillion at yearend.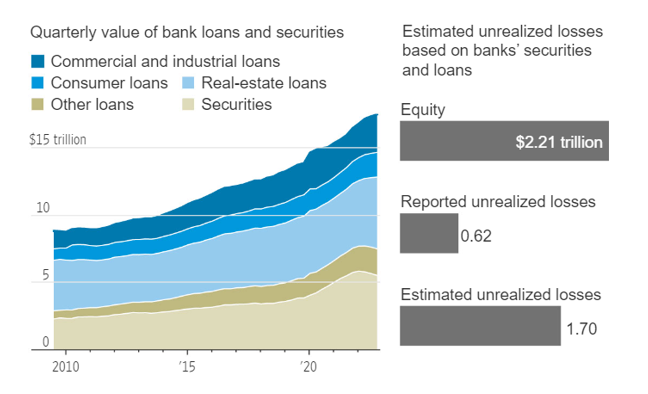
Sources: The Wall Street Journal, Where Financial Risk Lies, in 12 Charts. Included for illustrative purposes only. Past performance is no guarantee of future results
Figure 2. The Impact of a Rising Federal Funds Effective Rate
Over the past year and a half, rising interest rates have caused bank losses to grow. For SVB, higher rates decreased the value of its long-term bond portfolio from $91 billion to $76 billion at the end of 2022, which squeezed its profit margins and put its balance sheet on shaky ground, and led to the second-biggest bank failure in U.S. history.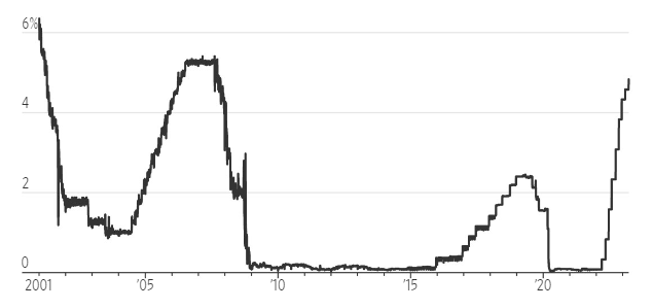
Figure 3. Banks are Losing Money on Securities Sensitive to Interest Rates, Including Treasuries and Mortgages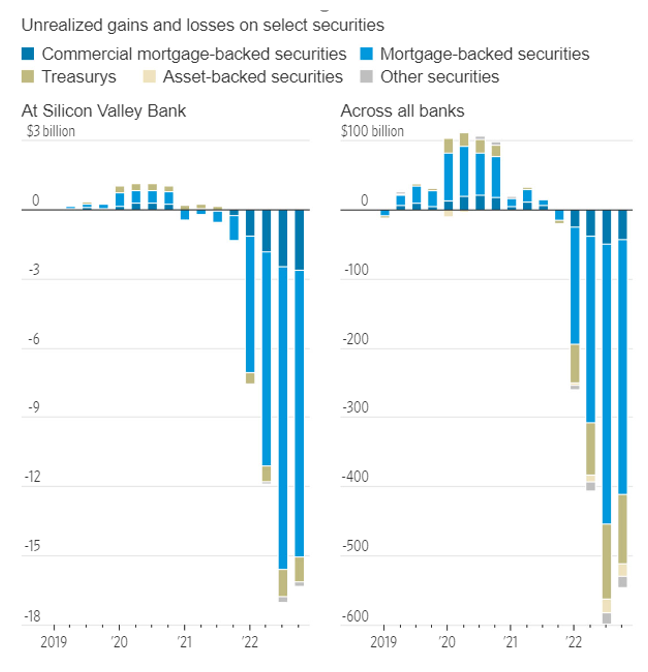
Sources: The Wall Street Journal, Where Financial Risk Lies, in 12 Charts. Included for illustrative purposes only. Past performance is no guarantee of future results.
Government Policy: The Unsteady Hand at the Tiller
The Federal Reserve ("Fed") has suspended and potentially abandoned its resolve to reduce inflation. Consumer price index (CPI) inflation is still tracking at 6.0%, well above the Fed's stated goal of bringing the rate down to 2%. Since the failure of SVB, the Federal Reserve balance sheet has grown by $400 billion (red circle in the chart below), almost fully reversing the "quantitative tightening" promised by the Fed along with other tough measures to combat inflation. In light of the flip-flop that the Fed has been forced into, it is reasonable to declare that inflation remains "alive and well."
Figure 4. The Fed Balance Sheet Grew $400B Since the Collapse of SVB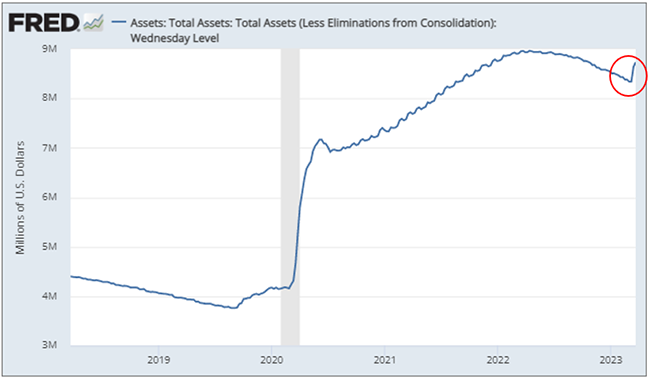
Source: Board of Governors of the Federal Reserve System (U.S.). Five-year data as of 3/22/2023. Included for illustrative purposes only. Past performance is no guarantee of future results.
Banking Crises: 2008 vs. 2023
There are important differences, but what they have in common is that they were both caused by ultra-low interest rates engineered by the Federal Reserve. In both cases (highly simplified version), Fed policies led to investment bubbles that ended up in "busts" — housing in 2008 and "everything" in 2023. The Global Financial Crisis (GFC) struck at the heart of the banking system which was loaded with housing-related bad debt.
In the current crisis, bad debt is everywhere, including housing, consumer, corporate, real estate and government. The resolution of the GFC was a decade of money printing by the Fed. Now that the "everything bubble" has broken, government policies will likely revert to the inflationary playbook — interest rate suppression, money printing and out-of-control fiscal deficits. Despite the usual assurances from government officials and status quo cheerleaders "that all is well," the episodes of Silicon Valley Bank (SVB), Republic and Credit Suisse are canaries in the coal mine of systemic risk. Similar bromides from the usual suspects followed the demise of Bear Stearns in March 2008, months before the full extent of the systemic crisis was fully appreciated.
Are Bonds a Safe Haven?
A resurgence or continuation of inflation would be an obvious negative for bonds, aside from short-term Treasuries. Bonds performed extremely poorly in 2022, as shown in Figure 5. While an economic slowdown could cause bonds of all maturities to rally. But aside from a potential trade, ongoing inflation would erode investment returns over the longer term.
Figure 5. Bond Returns: 2022 was a Disaster
Since 1900 the average annualized real return for bonds across the 21 countries with continuous data was just 0.6%. ("Real" returns represent inflation-adjusted returns.)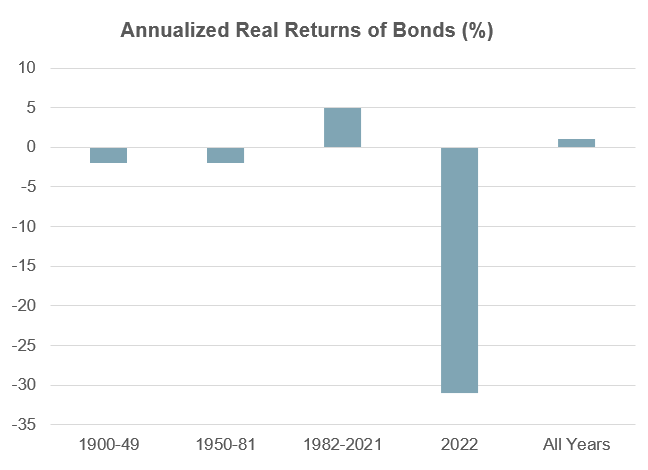
Sources: Credit Suisse, Elroy Dimson, Paul Marsh and Mike Staunton; The Financial Times, 2/25/2023. Included for illustrative purposes only. Past performance is no guarantee of future results.
Equities as a Safe Haven
Over the long term, equities have delivered superior returns after taking inflation into account. On the other hand, equities are vulnerable to a potential recession which would cause corporate earnings to plummet. Veteran and highly respected investor Jeremy Grantham (Grantham, Mayer, & van Oterloo, $118 billion assets under management) expects stocks to decline (the S&P 500 Index)1 up to 50% due to a "harsh recession." 2
Figure 6. S&P 500 Index Returns Adjusted for Inflation (1992-2023)
For the 30-year period ended 3/29/2023, equities returned 9.68% annually, which adjusted for inflation equals 6.99%.
Source: Bloomberg. Data as of 3/29/2023. Included for illustrative purposes only. Past performance is no guarantee of future results.
Bitcoin (???)
Cryptocurrencies were considered to be safe because they are not vulnerable to debasement from government money printing. However, they entail many other risks including potential government regulation. In addition, cryptocurrencies are native to the internet and subject to internet-related abuses. Cryptocurrency valuations benefitted from the speculative juices that led to a bubble in financial assets and are subject to further deflation of the same. Since the market peak on January 4, 2022, through the end of the first quarter, cryptos (as measured by Bitcoin) have performed poorly:
Figure 7. Q1 2023 Returns: Gold is up 8.52% vs. Bitcoin -38.57%
|
Asset |
January 4, 2022 |
3/31/2023 |
Change |
% Chg |
|
Gold Bullion3 |
$1,814.60 |
$1,969.28 |
$154.68 |
8.52% |
|
GDX4 |
31.38 |
32.35 |
0.97 |
3.09% |
|
S&P 500 Index1 |
4,793.54 |
4,109.31 |
-684.23 |
-14.27% |
|
Bitcoin |
46,220.42 |
28,395.30 |
-17,825.12 |
-38.57% |
Source: Bloomberg. Data as of 3/31/2023. Included for illustrative purposes only. Past performance is no guarantee of future results.
Why Not Gold?
Gold has a history of protecting capital during economic turmoil, especially during times of economic crisis; see Figure 8. It is interesting that a recent Wall Street Journal article (Where to Put Your Money During a Banking Crisis5) declares that the best place to "put your money" is, believe it or not, into a bank. People who worry about the safety of their money should invest in "high yield savings accounts, money market funds (which invest in bank liabilities), certificates of deposit and short-term Treasuries." Bad advice and economic ignorance aside, the Wall Street Journal article does not even consider alternate safe havens including the potential benefits of gold ownership.
Let it be said here, since the financial media at best pays only lip service to the thought: there is likely no safer asset than physical gold. The metal has no counterparty risk (unlike all other financial instruments including bank deposits and government bonds), is highly liquid and has an unbroken record of retaining value in absolute terms and relative to financial assets.
During the seven crisis periods since 2007, gold has demonstrated its value as a safe haven asset. On average, for the seven periods, gold bullion has returned 10.93% compared to -14.75% for the S&P 500 Total Return Index and 4.06% for U.S. Treasuries (as of 12/31/2022), as shown in Figure 8.
Figure 8. Gold Can Provide Protection During Times of Crisis 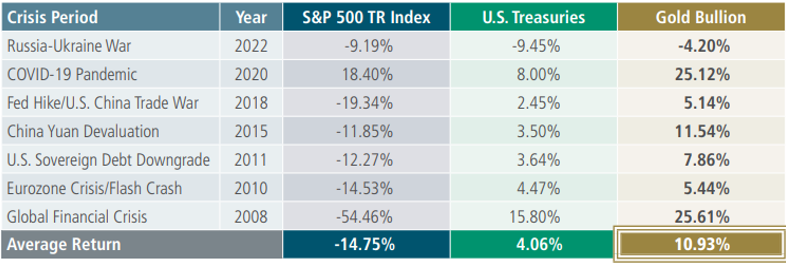
Data as of 12/31/2022. Source: Sprott Asset Management.6 Included for illustrative purposes only. Past performance is no guarantee of future results.
Ways to Own Gold
The many alternatives to owning physical metal include bars and/or coins (not efficient), COMEX futures (entails counterparty risk) or gold-backed Exchange Traded Funds (ETFs). Among these, we suggest taking a look at the Sprott Physical Gold Trust (NYSE: PHYS). Other gold-backed ETFs may track the gold price but are difficult if not impossible to redeem in kind and are taxed as “collectibles” which means that long-term gains do not receive preferential tax treatment. PHYS lets you own physical gold in a convenient and secure way that has potentially favorable tax advantages for U.S. non-corporate investors, versus owning gold through ETFs or directly through coins or bullion.
Learn More about PHYS, SESG and Owning Physical Gold
If you are interested in learning more about PHYS, or have questions about owning physical gold please contact a Sprott Client Services Representation at 888.622.1813.
| 1 | The S&P 500 or Standard & Poor's 500 Index is a market-capitalization-weighted index of the 500 largest U.S. publicly traded companies. |
| 2 | Jeremy Grantham warns the everything bubble is bursting |
| 3 | Gold bullion is measured by the Bloomberg GOLDS Comdty Spot Price. |
| 4 | VanEck Vectors Gold Miners ETF (GDX) tracks the overall performance of companies involved in the gold mining industry. |
| 5 | Source: WSJ, Where to Put Your Money During a Banking Crisis. |
| 6 | Dates used: Russia-Ukraine War: 2/24/2022-12/31/2022; COVID-19 Pandemic: 12/31/2019-12/31/2020; Fed Rate Hike & China Trade War: 9/20/2018-12/24/2018; China Worries: 8/18/2015-2/11/2016; U.S. Sovereign Debt Downgrade: 7/25/2011-8/9/2011; Eurozone Crisis: 4/20/2010-7/1/2010; Global Financial Crisis: 10/11/2007-3/6/2009. S&P 500 TR Index is measured by the SPXTR; Treasuries are measured by Bloomberg Barclays U.S. Treasury Total Return Unhedged USD (LUATTRUU); and Gold Bullion is measured by the Bloomberg GOLDS Comdty Spot Price. You cannot invest directly in an index. Past performance is not indicative of future results. This table contains hypothetical performance results and certain inherent limitations. Unlike an actual performance record, hypothetical results do not represent actual trading. Since the trades have not been executed, the published results may have under or over compensated for the impact of certain market factors such as lack of liquidity and other market factors. |
Important Disclosure
Sprott Physical Gold Trust (the “Trust”) is a closed-end fund established under the laws of the Province of Ontario in Canada. The Trust is available to U.S. investors by way of a listing on the NYSE Arca pursuant to the U.S. Securities Exchange Act of 1934. The Trust is not registered as an investment company under the U.S. Investment Company Act of 1940.
The Trust is generally exposed to the multiple risks that have been identified and described in the prospectus. Please refer to the prospectus for a description of these risks. Relative to other sectors, precious metals and natural resources investments have higher headline risk and are more sensitive to changes in economic data, political or regulatory events, and underlying commodity price fluctuations. Risks related to extraction, storage and liquidity should also be considered.
Gold and precious metals are referred to with terms of art like store of value, safe haven and safe asset. These terms should not be construed to guarantee any form of investment safety. While “safe” assets like gold, Treasuries, money market funds and cash generally do not carry a high risk of loss relative to other asset classes, any asset may lose value, which may involve the complete loss of invested principal.
All data is in U.S. dollars unless otherwise noted.
Past performance is not an indication of future results. The information provided is general in nature and is provided with the understanding that it may not be relied upon as, nor considered to be tax, legal, accounting or professional advice. Readers should consult with their own accountants and/or lawyers for advice on their specific circumstances before taking any action. Sprott Asset Management LP is the investment manager to the Trust. Important information about the Trust, including the investment objectives and strategies, applicable management fees, and expenses, is contained in the prospectus. Please read the prospectus carefully before investing. The indicated rates of return are the historical annual compounded total returns including changes in unit value and reinvestment of all distributions and do not take into account sales, redemption, distribution or operational charges or income taxes payable by any unitholder that would have reduced returns. You will usually pay brokerage fees to your dealer if you purchase or sell units of the Trust on the Toronto Stock Exchange (“TSX”) or the New York Stock Exchange (“NYSE”). If the units are purchased or sold on the TSX or the NYSE, investors may pay more than the current net asset value when buying units of the Trust and may receive less than the current net asset value when selling them. Investment funds are not guaranteed, their values change frequently and past performance may not be repeated. The information contained herein does not constitute an offer or solicitation to anyone in the United States or in any other jurisdiction in which such an offer or solicitation is not authorized.


