

Key Takeaways
- Precious Metals Volatility: Gold and silver markets experienced significant volatility, including a sharp one-day sell-off in late January, followed by a record monthly close for gold above $5,000 in February.
- Emerging Monetary Regime: Rather than undermining gold’s outlook, these price swings reflect markets adjusting to an emerging monetary regime shaped by persistent liquidity support from central banks and growing geopolitical fragmentation.
- Constraints on the Fed: Structural constraints on the Federal Reserve—including funding-market stability and Treasury financing needs—make a sustained reduction in balance-sheet liquidity increasingly unlikely.
- China Buying Supports Gold: China continues to expand its gold reserves while managing a gradual real depreciation of the renminbi, reinforcing gold’s role as a strategic reserve asset.
- Gold Fundamentals Remain Strong: In a world defined by fiscal dominance, rising sovereign debt burdens and limited real returns on traditional safe assets, gold’s long-term fundamental drivers remain firmly intact.
Performance as of February 28, 2026
| Indicator | 2/28/26 | 1/31/26 | Change | Mo % Chg | YTD % Chg | Analysis |
| Gold Bullion1 | $5,278.93 | $4,894.23 | $384.70 | 7.86% | 22.22% | Highest ever closing month-end price. |
| Silver Bullion2 | $93.79 | $85.20 | $8.59 | 10.08% | 30.87% | Highest ever closing month-end price. |
| NYSE Arca Gold Miners (GDM)3 | 3,299.41 | 2,743.86 | 555.55 | 20.25% | 35.06% | Gold miners closed at all-time highs. |
| Bloomberg Comdty (BCOM Index)4 | 121.68 | 120.7 | 0.98 | 0.81% | 10.93% | Highest monthly close since May 2022. |
| DXY U.S. Dollar Index5 | 97.61 | 96.99 | 0.62 | 0.64% | -0.73% | Remains weak, lower highs, lower lows. |
| S&P 500 Index6 | 6,878.88 | 6,939.03 | (60.15) | -0.87% | 0.49% | Remains in very narrow trade range. |
| U.S. Treasury 10-YR Yield* | 3.94 | 4.24 | (0.30) | -30 BPS | -23 BPS | Sharp drop on safety/growth concerns. |
| Silver ETFs** (Total Known Holdings ETSITOTL Index Bloomberg) | 834.04 | 823.76 | 10.27 | 1.25% | -3.43% | Buying on pullbacks. |
| Gold ETFs** (Total Known Holdings ETFGTOTL Index Bloomberg) | 100.92 | 100.54 | 0.38 | 0.38% | 1.99% | ETF buying remains steady. |
Source: Bloomberg and Sprott Asset Management LP. Data as of February 28, 2026.
* BPS stands for basis points. **Bloomberg Indices measure ETF holdings; the ETFGTOTL is the Bloomberg Total Known ETF Holdings of Gold Index; the ETSITOTL is the Bloomberg Total Known ETF Holdings of Silver Index.
Gold Market: Growing Strategic Appeal
In February, spot gold rose $384.70 per ounce (or 7.86%) to close the month at $5,279.73. It was an all-time monthly closing high and the first monthly close to exceed $5,000. After its violent one-day sell-off on January 30, gold spent February recovering and ended the month only $138.28 (or 2.55%) below its all-time closing high. There was scant evidence that January’s one-day flash crash was anything more than a violent, mechanical reversal as leveraged momentum trades were unwound and forced into liquidation.
Since late 2023, when the gold price was around $2,000, gold has only experienced right-tail price outcomes, meaning upside shocks. It would not be unusual or bearish to see more balanced left- and right-tail price events7 as gold ownership has broadened over the last few years. Gold’s climb in February appears to be the continuation of the rally that began in November 2025 (see Figure 1), with the gold price trading well within a long-term bullish8 structural trend.
As balance sheets stretch, confidence shifts to gold.
Over the past few months, the S&P 500 Index has traded within a narrow range. However, beneath the surface, there has been remarkable movement. In February, the equity markets experienced violent internal regime shifts driven by AI-linked balance-sheet stress and collapsing intra-stock correlations. Selling focused on software and SaaS stocks as fears around agentic AI disruption spread from equities into credit and private markets, raising concerns about white collar employment, credit default risk and the sustainability of high valuations on technology stocks.
At the same time, AI-related capital expenditures by hyperscale technology companies have begun to reshape corporate balance sheets. These firms are issuing record volumes of investment-grade debt to finance infrastructure spending. The resulting increase in corporate borrowing has widened credit spreads and reduced the capacity for share buybacks, which have been an important source of support for equity markets in recent years.
While headline equity indexes remained relatively stable in February, internal market stress was severe. Dispersion—the degree of variation in returns across individual stocks and sectors—rose to levels typically seen during periods of market dislocation. Single-stock volatility surged while leverage remained elevated, a combination that has often preceded rising correlations, forced deleveraging and broader market drawdowns.
Even strong earnings results, particularly among semiconductor companies, failed to stabilize prices. This suggested that investor focus had shifted from growth expectations toward concerns about liquidity sensitivity and long-term valuation risk. As confidence weakened across segments of both equity and private credit markets, investor preferences increasingly rotated toward hard assets over digital or financial ones. This dynamic reinforced gold’s growing strategic appeal as markets moved deeper into a late-cycle environment characterized by tightening liquidity and rising balance-sheet stress.
Figure 1. Gold’s Highest Monthly Close (2022-2026)
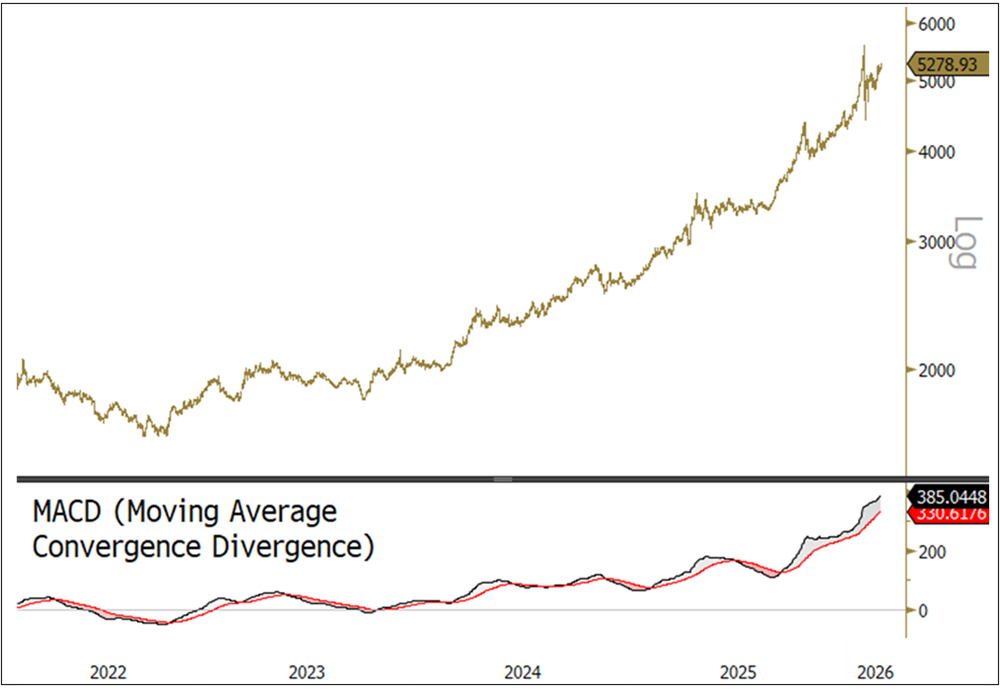
Source: Bloomberg. Gold spot price, $/oz. Data as of 3/1/2026. Moving average convergence/divergence is a trend-following momentum indicator that shows the relationship between two exponential moving averages. Past performance is no guarantee of future results.
The New Fed: Return of Liquidity Plumbing and Monetary Creep
With Kevin Warsh widely expected to assume the role of Federal Reserve Chair, markets are beginning to price in a shift in the monetary regime. Rather than the discretionary stimulus programs that followed the Global Financial Crisis (GFC) of 2008, the emerging framework appears more focused on maintaining market function during periods of liquidity stress. The result may not be overt monetary expansion but a gradual and persistent expansion of the Fed’s balance sheet through reserve management and liquidity operations, policies that quietly erode confidence in long-term fiat discipline.
Lower rates and abundant reserves tend to support gold.
Kevin Warsh is a well-known skeptic of large-scale quantitative easing (QE). His stated preference is to rely on conventional rate policy and avoid the perception of permanent balance sheet monetization. This suggests he would be more open to interest rate cuts and cautious about overt QE. However, any Fed chair is constrained by institutional and market realities. The structure of the Federal Open Market Committee (FOMC), post-GFC market regulation and the sheer scale of the Treasury’s financing needs severely limit the Fed’s ability to meaningfully contract its balance sheet. Even under Warsh, aggressive shrinkage of the balance sheet would risk destabilizing funding markets. New Fed leadership may influence how liquidity is provided to the markets, but not the need for it.
A monetary regime that is flexible on interest rates, without being focused on normalizing the Fed's balance sheet, is accommodative for gold. Lower nominal rates combined with structurally elevated reserves have historically supported gold, particularly when policy credibility is called into question.
Over recent months, the Fed has quietly resumed balance sheet growth, framed as reserve management rather than stimulus. It has concentrated purchases on short-dated Treasuries and allowed mortgage-backed securities to continue to roll off. The stated objective is to maintain ample reserves and preserve control over short-term rates.
The scale of purchases is modest by historical standards (tens of billions per month rather than trillions), but functionally, this is still money printing (QE-lite). Reserves increase, safe collateral tightens and liquidity conditions ease at the margin. QE lite is not designed to inflate risk assets but to stabilize funding markets. For gold, even restrained balance-sheet growth reinforces the perception that the Fed cannot return to a scarce-reserves regime.
The Structural Floor Under the Balance Sheet
The trigger for the latest round of renewed balance sheet expansion was stress in overnight funding markets. Repo rates persistently traded above the interest rate on reserves, signaling an emerging scarcity of reserves. Increased usage of the standing repo facility confirmed that liquidity was unevenly distributed.
The incoming Fed leadership remains constructive for gold.
These episodes reflected modern market structure; that is, higher reserve requirements, constrained dealer balance sheets and greater reliance on non-bank intermediaries. Seasonal drains routinely tightened liquidity to the point of threatening the Fed’s control over interest rates. The Fed’s response—pre-funding reserves—stabilized markets without formal QE but underscored a key point: reserves are now a structural input rather than an excess buffer.
In a steady state, the Fed’s balance sheet will likely grow alongside nominal gross domestic product (GDP), bank deposits and regulation. Modest reductions are possible, but pushing reserves meaningfully below the ample threshold risks renewed funding stress. Treasury cash management can shift liquidity but cannot eliminate it without destabilizing markets.
The emerging regime will likely be neither true tightening nor outright easing. Under this regime, liquidity would be managed, not withdrawn. Funding markets would be stabilized, not liberalized. The Fed’s balance sheet would remain structurally biased toward growth, even when rhetoric turned hawkish.
The incoming Fed leadership remains constructive for gold. Persistent growth in reserves undermines long-term confidence in fiat discipline, while rate flexibility compresses real yields. Gold does not require aggressive QE to perform; it benefits from the recognition that durable monetary restraint has become structurally unattainable. Under these conditions, we believe the Fed will continue to exercise fiscal dominance9 and currency debasement.
China's Monetary Policy: Tacit Devaluation
Gold has been playing an increasingly important role in China’s broad macroeconomic and financial strategy for several years. With the country’s prolonged property downturn, elevated levels of domestic debt and constrained policy choices, gold has become an increasingly valuable asset for managing balance sheet stress without triggering overt currency instability.
China’s property sector remains a significant drag on growth and household balance sheets. Years of credit-driven expansion have left developers, local governments, and households heavily exposed to falling asset values. Traditional reflation tools, like large-scale fiscal stimulus or aggressive monetary easing, risk accelerating capital outflows and undermining confidence in the renminbi. As a result, Chinese policymakers have chosen to pursue a more indirect form of adjustment.
For China, gold remains one of the few credible stores of value available.
Rather than forcing a sharp devaluation, Chinese authorities appear focused on allowing the real values of domestic assets and liabilities to adjust gradually. This approach prioritizes stability in headline exchange rates while tolerating slower growth, financial repression and balance sheet erosion in real terms. Gold fits naturally into this framework.
The People’s Bank of China has continued to add to its gold reserves, even if official reporting likely understates the true scale of accumulation. These purchases are not about short-term price management. They are about diversifying away from dollar-centric reserves and strengthening confidence in China’s sovereign balance sheet.
Gold offers a unique advantage for China. It allows the government to diversify sovereign reserves without explicitly challenging the existing monetary order. Unlike foreign currency assets, gold carries no counterparty risk and cannot be frozen or sanctioned. Accumulating gold while maintaining tight capital controls enables China to reinforce financial resilience without inviting speculative pressure on the renminbi.
China’s currency strategy increasingly resembles a managed depreciation in real, rather than nominal, terms. By holding the renminbi relatively stable against major currencies while domestic inflation and asset price adjustments run their course, the authorities can gradually reduce the real burden of debt, particularly property-related liabilities.
In this context, gold serves as a reference point for preserving value. A renminbi that weakens relative to gold over time allows domestic balance sheets to adjust without the political and financial shock of a visible currency devaluation. This process is slow, opaque and incremental, but it aligns with China’s preference for control over speed. Figure 2 shows that gold priced in renminbi has increased by 187.87% since December 30, 2022, for a compounded annual growth rate (CAGR) of 39.67%.
Figure 2. Gold Tracks the Depreciating Renminbi (2020-2026)
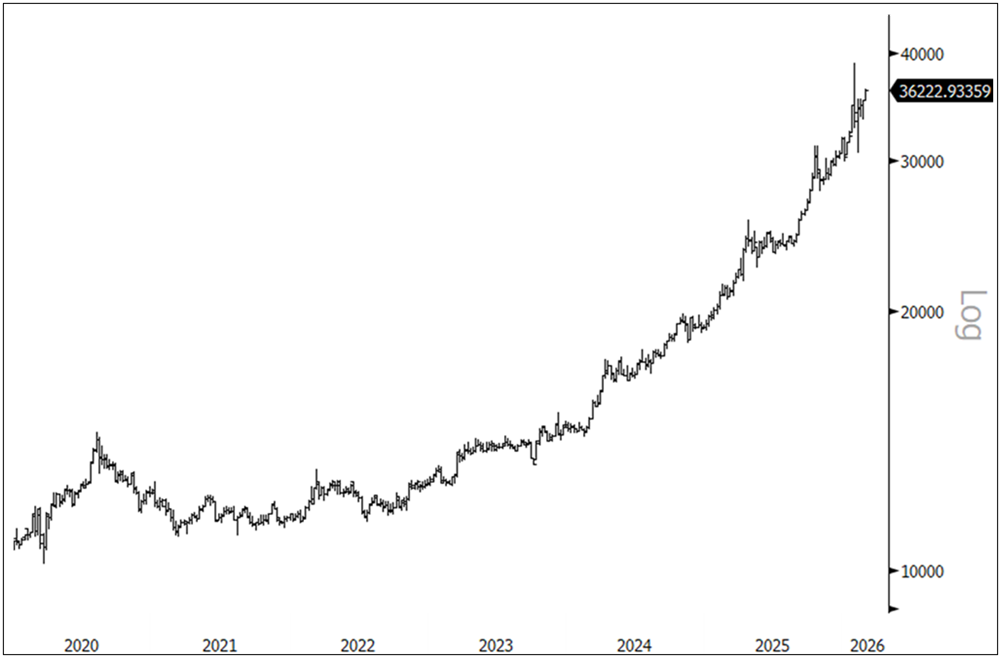
Source: Bloomberg. Spot gold priced in renminbi/oz. Data as of 3/4/2026. Past performance is no guarantee of future results.
China’s capital controls further reinforce gold’s role. Households and institutions in China are limited in their ability to move capital offshore and access foreign assets. For them, gold remains one of the few credible stores of value available. This structural demand is less sensitive to price fluctuations and more driven by risk management and wealth preservation.
China’s impact on gold is rooted in the country’s need to manage debt, preserve currency stability and rebuild confidence without destabilizing its financial system. Gold provides a politically acceptable, internationally neutral mechanism to absorb these pressures. For global investors, this reinforces gold’s role as a monetary asset. As China continues to navigate balance sheet repair under tight policy constraints, gold demand driven by strategic necessity, not speculation, should remain a continuing feature of the gold market.
Gold’s Deep Structural Drivers Remain Intact
Near-term gold market narratives continue to oscillate between inflation scares, growth concerns and policy pivots. Beneath all this, gold’s long-term drivers remain firmly in place. These forces are structural rather than cyclical. They are unlikely to be meaningfully altered by incremental changes in policy tone or leadership. At the same time, gold is likely to experience short-term volatility as positioning, rates and the U.S. dollar adjust to shifting expectations.
Among the key long-term drivers for gold, these three stand out:
- 1. The Persistence of Fiscal Dominance in Advanced Economies
Government debt levels remain high, deficits are structurally entrenched and political tolerance for austerity is minimal. Central banks may signal discipline, but sovereign financing needs and the fragility of market plumbing constrain their ability to enforce it. In this environment, monetary policy increasingly responds to fiscal realities rather than constraining them. Rate cuts may come and go, but central bank balance sheets remain biased toward growth over time. Gold benefits from the recognition that the path of least resistance to deal with massive real debt burdens is through financial repression and currency debasement. - 2. Continued Diversification of Global Reserves Away from the U.S. Dollar
This is not a sudden abandonment of the U.S. dollar, but a gradual rebalancing motivated by geopolitics, sanctions risk and the need for monetary sovereignty. Gold plays a unique role in this transition because it is neutral, liquid and free of counterparty risk. Demand for gold from central banks reflects this reality. As the global monetary system becomes more fragmented, gold’s role as a universally accepted reserve asset becomes more valuable, not less. - 3. Suppressed Real Returns on Cash and Sovereign Bonds.
Even when nominal yields rise, inflation, regulatory constraints and policy interventions work to limit real gains in purchasing power. This encourages a steady reallocation toward assets that preserve value over long horizons rather than maximize short-term yield. Gold has an inverse relationship with investors’ confidence in fiat savings. As long as policymakers prioritize stability over price discovery and debt sustainability over hard constraints, gold remains a rational component of long-term portfolios.
In the short term, the gold price is unlikely to move in a straight line. Shifts in rate expectations, temporary dollar strength or changes in speculative positioning can produce pullbacks and periods of consolidation. These episodes are features of the market rather than signals that the underlying fundamental thesis has changed. Periods of consolidation often reflect the market working to digest higher prices rather than outright selling.
As liquidity conditions stabilize and policy narratives evolve, gold’s role as a monetary hedge has historically reasserted itself quickly. The long-term case for gold does not depend on an imminent crisis or aggressive monetary easing. Instead, it rests on structural forces that are slow-moving, durable and increasingly visible. Periods of market volatility may interrupt the trend, but they do not undermine the strategic rationale for gold as a store of value in an increasingly constrained global monetary system.
Silver Market: Options vs. Futures
Spot silver rose in February to close the month at $93.79, an all-time monthly closing high and the first monthly close to exceed $90. After the extreme one-day sell-off on January 30, silver spent February recovering but moved in a more volatile trading range than gold (see Figure 3). There was some unwinding of momentum trades, but options activity remained high. The iShares Silver Trust ETF (SLV) continued to hold a very large underlying options position, which underpinned high levels of implied and realized volatility. Silver’s medium and long-term bullish fundamentals remain unchanged, but there is likely to be short-term volatility in the market until some of these prominent option positions clear.
Figure 3. Silver Recovering Market Highs (2024-2026)
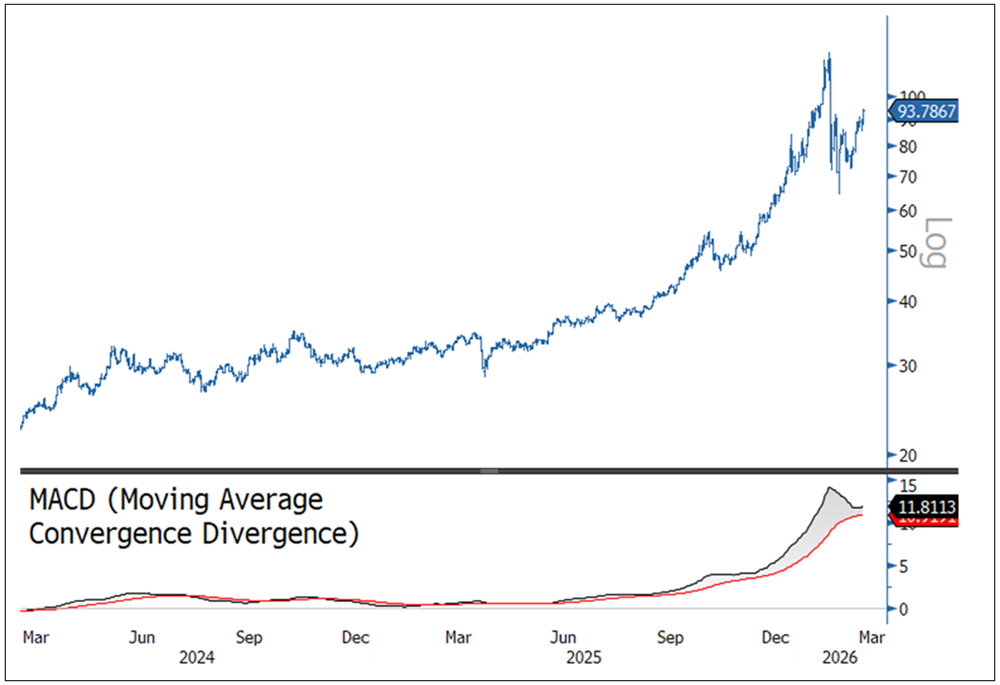
Source: Bloomberg. Silver spot price, $/oz. Data as of 3/1/2026. Moving average convergence/divergence is a trend-following momentum indicator that shows the relationship between two exponential moving averages. Past performance is no guarantee of future results.
Recent price volatility across precious metals, especially silver, should not be mistaken for a deterioration in underlying fundamentals. Instead, market behavior is increasingly shaped by positioning and market structure effects, particularly the growing influence of options markets and short-term trading flows. This distinction is important. It is true that prices have become more volatile. However, the core drivers supporting gold and silver, including monetary uncertainty, fiscal dominance, geopolitical risk, and long-term supply constraints, remain firmly intact.
Volatility does not signal a loss of conviction in silver or precious metals.
Silver provides a clear example of this dynamic as positioning has shifted dramatically between futures markets and ETF options. Figure 4 shows iShares Silver Trust (SLV) call option open interest (representing ETF options) and CFTC silver non-commercial longs (representing futures markets) converted into notional silver ounces10. Futures-based speculative length has declined meaningfully since mid-2025. At the same time, open interest in call options on the SLV ETF has surged to historically high levels. This divergence is likely signaling a volatility regime shift, with risk being expressed differently. Instead of using futures to commit capital directionally, traders are increasingly embedding bullish exposure in options.
Figure 4. Bulls Prefer Options Now (2020-2026)
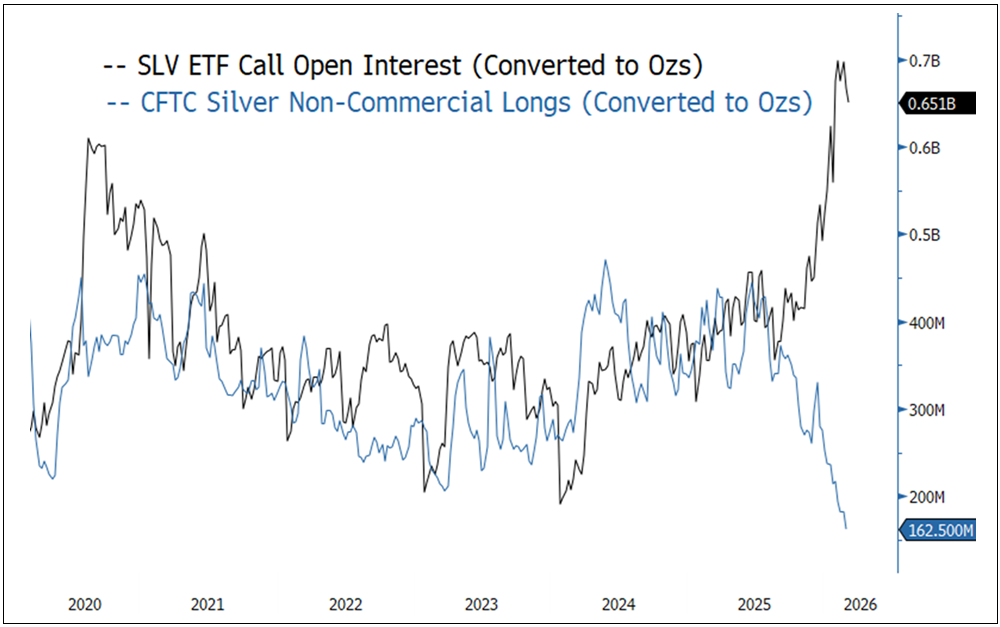
Source: Bloomberg. This graphic is meant to be illustrative. A proper methodology would involve netting out positions and delta adjustments, but it would complicate the picture. We also excluded silver held in ETFs, as this tends to be relatively steady in terms of trend. Past performance is no guarantee of future results.
Options-driven markets behave differently from markets dominated by outright long positions. Large call open interest can force dealers to dynamically hedge their exposure as prices move, particularly when prices rise toward heavily populated strike levels. These hedging flows can reinforce price moves in the short run. They can create feedback loops that exaggerate rallies or pullbacks when momentum fades or options expire. In this environment, price action becomes path dependent and episodic, even if the underlying fundamental backdrop has not changed. Over the past several weeks, we have seen many notable up-and-down days.
The fundamental case for both gold and silver remains grounded in long-duration macro realities.
Volatility like this does not signal a loss of conviction in silver or precious metals. The migration of exposure toward options and optionality often reflects uncertainty about timing rather than direction. Investors are expressing upside exposure while limiting balance sheet risk. It is a rational response in markets where macro outcomes remain favorable but near-term price paths are increasingly noisy. The result is a market that can look unstable on the surface even as long-term support remains strong underneath.
Precious metals continue to benefit from structural forces that operate over years, not weeks. These include rising sovereign debt burdens, persistent inflation risk, currency debasement concerns and growing demand for neutral reserve assets. Short-term volatility—which is driven by positioning, dealer hedging and expiry cycles—does not negate these trends. It reflects market plumbing rather than a reassessment of the role of gold and silver in portfolios. As option-related distortions ebb and flow, prices may remain choppy, but the fundamental case for both gold and silver remains grounded in long-duration macro realities.
Footnotes
| 1 | Gold bullion is measured by the Bloomberg GOLDS Comdty Index. |
| 2 | Silver bullion is measured by the Bloomberg Silver (XAG Curncy) U.S. dollar spot rate. |
| 3 | The NYSE Arca Gold Miners Index (GDM) is a rules-based index designed to measure the performance of highly capitalized companies in the gold mining industry. |
| 4 | The Bloomberg Commodity Index (BCOM) is a broadly diversified commodity price index distributed by Bloomberg Indices. |
| 5 | The U.S. Dollar Index (USDX, DXY, DX) is an index (or measure) of the value of the United States dollar relative to a basket of foreign currencies, often referred to as a basket of U.S. trade partners' currencies. |
| 6 | The S&P 500 or Standard & Poor's 500 Index is a market-capitalization-weighted index of the 500 largest U.S. publicly traded companies. |
| 7 | Left tail shocks are severe negative events causing massive, often lasting, losses, while right tail shocks are unexpected, sharp gains. |
| 8 | "Bullish" refers to a market sentiment or personal belief that the price of an asset, sector, or the overall market is expected to rise. |
| 9 | Fiscal dominance is a scenario where high government debt and persistent deficits force the central bank to prioritize financing government spending over controlling inflation. In this state, monetary policy becomes subordinate to fiscal policy, often leading to low interest rates to manage debt costs, which can fuel inflation. |
| 10 | SLV ETF call open interest refers to the total number of outstanding call option contracts for the iShares Silver Trust (SLV). This is the largest silver ETF and a proxy for speculative interest in silver. Higher call open interest indicates sentiment tilted towards the potential for silver’s price to rise, as more traders buy call options to profit from upward price movements. CFTC silver non-commercial longs refer to the positions held by speculators, such as hedge funds, who use futures to bet that silver prices will rise, as reported by the Commodity Futures Trading Commission. These traders do not have a direct interest in the physical commodity but aim to profit from price movements in the silver futures market. |


Investment Risks and Important Disclosure
Relative to other sectors, precious metals and natural resources investments have higher headline risk and are more sensitive to changes in economic data, political or regulatory events, and underlying commodity price fluctuations. Risks related to extraction, storage and liquidity should also be considered.
Gold and precious metals are referred to with terms of art like "store of value," "safe haven" and "safe asset." These terms should not be construed to guarantee any form of investment safety. While “safe” assets like gold, Treasuries, money market funds and cash generally do not carry a high risk of loss relative to other asset classes, any asset may lose value, which may involve the complete loss of invested principal.
Past performance is no guarantee of future results. You cannot invest directly in an index. Investments, commentary and opinions are unique and may not be reflective of any other Sprott entity or affiliate. Forward-looking language should not be construed as predictive. While third-party sources are believed to be reliable, Sprott makes no guarantee as to their accuracy or timeliness. This information does not constitute an offer or solicitation and may not be relied upon or considered to be the rendering of tax, legal, accounting or professional advice.