

Key Takeaways
-
Financial market stress has forced the U.S. Federal Reserve (the Fed) to end quantitative tightening and pivot to liquidity support, expected in the form of QE-lite, a moderate expansion of the balance sheet in line with nominal gross domestic product (GDP) growth.
-
At the same time, rising bond yields in Japan are unwinding the yen carry trade, pulling liquidity from global markets and creating headwinds for risk assets.
-
These broad trends are bullish for both gold and silver since they erode confidence in fiat systems and send investors and central banks in search of safe-haven assets, including precious metals.
Performance as of November 30, 2025
| Indicator | 11/30/2025 | 10/31/2025 | Change | Mo % Chg | YTD % Chg | Analysis |
| Gold Bullion1 | $4,239.43 | $4,002.92 | $236.51 | 5.91% | 61.53% | All-time monthly closing high, above $4,200. |
| Silver Bullion2 | 56.50 | 48.69 | 7.81 | 16.04% | 95.49% | Silver breaks out to new all-time highs. |
| NYSE Arca Gold Miners (GDM)3 | 2,317.74 | 2,013.97 | 303.77 | 15.08% | 142.29% | Snapback rally to near all-time highs. |
| Bloomberg Comdty (BCOM Index)4 | 110.41 | 107.30 | 3.11 | 2.90% | 11.80% | Large base pattern is in place. |
| DXY U.S. Dollar Index5 | 99.46 | 99.80 | (0.34) | -0.35% | -8.32% | Tested, but fell from resistance levels. |
| S&P 500 Index6 | 6,849.09 | 6,840.20 | 8.89 | 0.13% | 16.45% | Seventh straight month up, but just barely. |
| U.S. Treasury Index | $2,442.94 | $2,427.94 | $15.00 | 0.62% | 6.67% | Best YTD since 2020. |
| U.S. Treasury 10 YR Yield* | 4.01 | 4.08 | (0.06) | -6 BPS | -56 BPS | Yields have been range-bound since May. |
| Silver ETFs** (Total Known Holdings ETSITOTL Index Bloomberg) | 829.57 | 813.90 | 15.67 | 1.93% | 15.83% | Levels back to recent highs. |
| Gold ETFs** (Total Known Holdings ETFGTOTL Index Bloomberg) | 97.50 | 97.28 | 0.22 | 0.23% | 16.93% | ETF levels flat for November. |
Source: Bloomberg and Sprott Asset Management LP. Data as of November 28, 2025.
* BPS stands for basis points. **ETF holdings are measured by Bloomberg Indices; the ETFGTOTL is the Bloomberg Total Known ETF Holdings of Gold Index; the ETSITOTL is the Bloomberg Total Known ETF Holdings of Silver Index.
Gold Market: Riding the Debasement Trade
Spot gold rose $236.51 per ounce (or 5.91%) in November to close the month at $4,239.43, the highest monthly closing for gold ever. November was mainly a consolidation period as gold generally found firm support in the $4,000 range early in the month before trading higher into the month's end. The sudden sell-off in mid-October did not spark a sustained wave of profit taking or any meaningful selling pressure. Gold ETF buying was essentially flat for the month, while CFTC gold data7 has yet to be updated due to the recent government shutdown. Available China gold exchange data also do not show a meaningful change in holdings.
Gold hits record high, as debasement trade persists.
Gold is holding steady and consolidating sideways, a pattern observed in other periods since 2023 (see Figure 1). The overriding long-term macro theme remains the debasement trade8, which we have written extensively about this year. Until policymakers globally decide to address the rampant expansion of debt and deficits without resorting to financial repression policies, the debasement trade will likely remain a persistent feature, limiting the time and scope of corrections for gold and precious metals. In this month’s commentary, we highlight two recent developments affecting markets due to ongoing fiscal dominance9: funding liquidity and erosion in the yen carry trade.
The broad equity market, as measured by the S&P 500 Index, closed approximately flat in November. This was despite a drawdown of ~5.5% at one point during the month, as concerns over AI (artificial intelligence) capital expenditure spending, equity overvaluation, uncertainty about a Fed rate cut in December, and money market funding liquidity stress all contributed to some notable selling in speculative and liquidity-sensitive assets. However, by month's end, the S&P 500 Index had rallied as the probability of a December rate cut surged, financial conditions remained easy, the earnings growth outlook stayed firm, and a large November options expiry led to a rollover of bearish positions and volatility suppression, creating delta10 to buy and pushing equities back to near their highs.
Figure 1. Spot Gold’s Rising Channel (2022-2025)
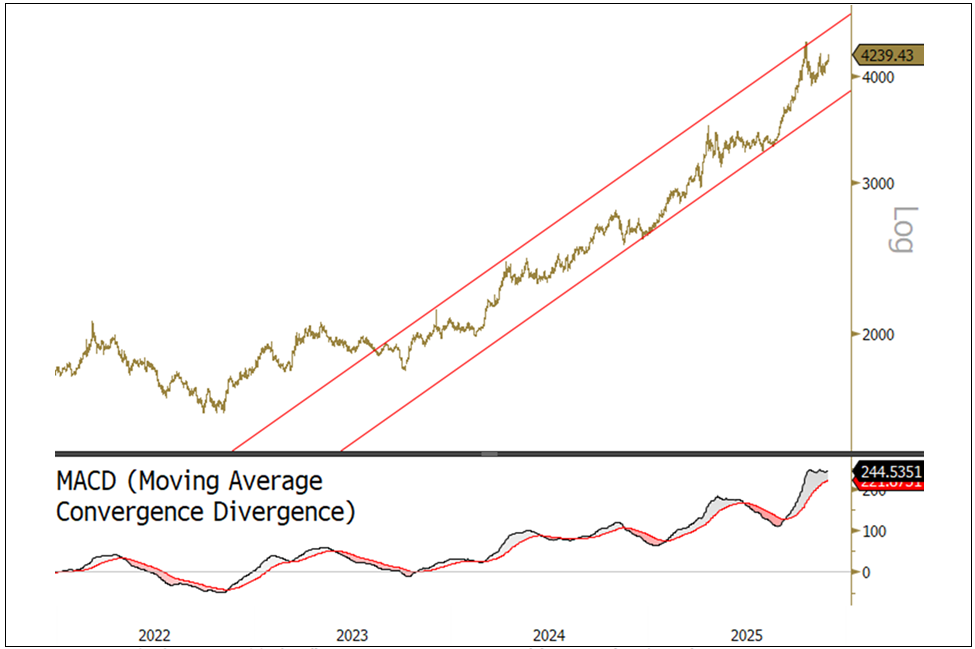
Source: Bloomberg. Gold spot price, $/oz. Data as of 12/1/2025. Moving Average Convergence/Divergence (MACD) is a trend-following momentum indicator that illustrates the relationship between two exponential moving averages. Past performance is no guarantee of future results.
The Return of Liquidity Stress
The Federal Reserve’s decision to end quantitative tightening (QT)11 on December 1, 2025, marked a shift in global liquidity dynamics. QT, which began in mid-2022, reduced the Fed’s balance sheet by over $2 trillion in an effort to normalize monetary policy after years of stimulus. However, rising stress in short-term funding markets, particularly the repo market12 (where institutions raise short-term cash against Treasury collateral), has forced the Fed to pivot toward liquidity support.
Liquidity stress supports gold’s bullish backdrop.
The mounting U.S. public debt burden and rapidly growing fiscal deficit have reshaped issuance of Treasury securities toward the short end of the yield curve. This shift has created a refinancing treadmill where large volumes of short-term debt must be continually rolled over (see Figure 2). Total U.S. Treasury bill issuance ballooned to $2.5 trillion as of October 31, 2025. This was 2.5 times higher than in 2022. The result is growing stress in short-term funding markets as demand for liquidity surges while structural constraints remain in place.
The current challenge is not a credit crisis but likely an evolving liquidity crisis. The market has limited appetite for longer-dated Treasuries, and the government’s reliance on front-end issuance amplifies pressure on repo markets and reserve availability. Policy options are narrow: either expand liquidity—effectively printing more money—or allow rates to rise, both of which carry significant economic consequences. The current path of expanding liquidity may stabilize funding conditions, but it also enables more borrowing and heightens the risk of inflation.
The policy mix of large deficits financed at the front end, combined with ongoing liquidity support, creates a structurally bullish backdrop for gold. Under fiscal dominance, inflation dynamics are more closely tied to government spending than to monetary tightening. This reinforces the appeal of real assets as a hedge against persistent fiscal imbalances. Until a stress event occurs to derail this policy mix, liquidity funding dynamics are expected to be the next feature of fiscal dominance and the debasement trade.
Figure 2. Funding the U.S. Deficit: Treasury Bill Issuance (2000-2024)
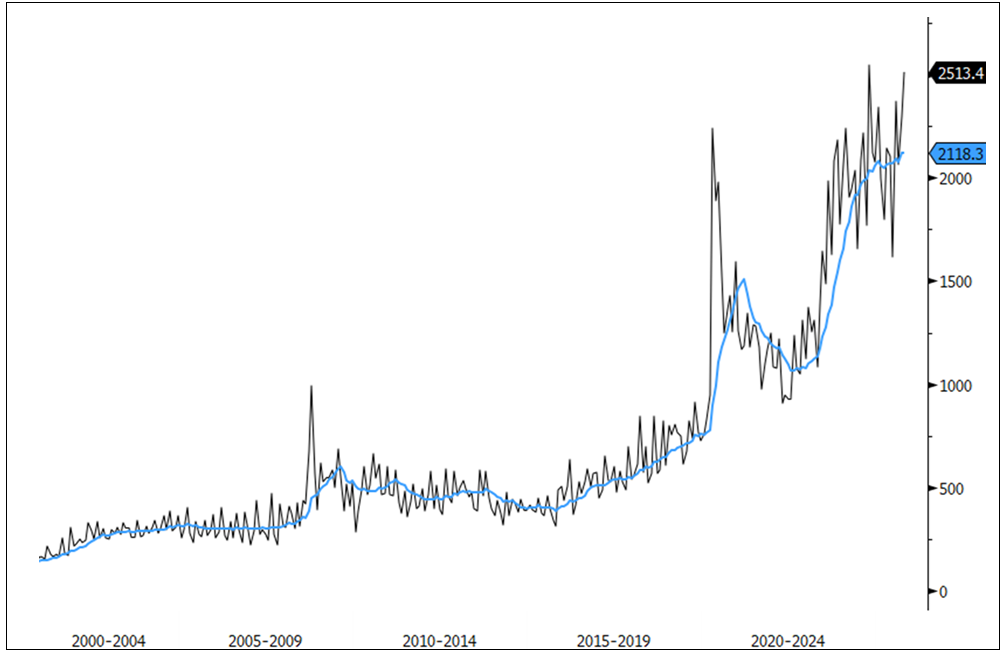
Source: Bloomberg. U.S. Treasury bill issuance with 12-month moving average, $ billions. Data as of 12/2/2025. Past performance is no guarantee of future results.
Extreme Demand in the Repo Market
QT was launched in 2022 to shrink excess reserves and restore pre-COVID pandemic norms. As reserves declined, repo rates began to spike, signaling a scarcity of liquidity reminiscent of the September 2019 funding crisis. This shortage of reserves threatened systemic stability, leading the Fed to end QT to prevent further stress and maintain control over short-term interest rates.
In the critical repo market, hedge funds engaged in highly leveraged basis trades have driven repo demand to extreme levels. Money market funds have reached their limits, leaving commercial banks as marginal lenders with limited cash. Persistent spikes in repo rates above the federal funds rate indicate that reserves are scarce, a condition that the Fed closely monitors to assess the health of liquidity.
Various spreads, such as the SOFR (Secured Overnight Financing Rate) versus the IORB rate (the Federal Reserve's interest rate on reserve balances), OIS (overnight index swaps), and RRP (overnight repo rate), can indicate the relative amount of liquidity stress.12 In Figure 3, we created a simple average of these spreads to provide an approximate guide to liquidity conditions (tight spreads = ample reserves; wide spreads = funding stress). Funding stress in this example may indicate whether reserve levels are adequate or not. A persistently high liquidity stress reading may precede Fed liquidity injections, creating a structurally bullish backdrop for gold and other real assets under fiscal dominance.
Figure 3. Tracking Liquidity Stress (2024-2025)

Source: Bloomberg. Average of spread between SOFR (Secured Overnight Financing Rate) vs IORB (Federal Reserve interest rate on reserve balances), OIS (overnight index swaps rate) and RRP (overnight repo rate). Data as of 12/2/2025. Past performance is no guarantee of future results.
QE-Lite: Growing the Balance Sheet Slowly
Government actions have compounded liquidity stress. A swollen Treasury General Account (TGA)13 during the recent shutdown drained hundreds of billions of dollars from the banking system. Estimates suggest there is a significant shortfall in bank reserves that the Fed may need to address through Treasury QE, a tactical liquidity injection achieved by purchasing short-term Treasury bills rather than long bonds. This approach would restore reserve adequacy without signaling aggressive monetary stimulus.
QE-lite signals slow balance sheet growth and steady liquidity.
Beyond the size of the Fed’s balance sheet, its composition is also important. A shift toward Treasury bills on the balance sheet reduces interest-rate risk but forces private markets to absorb more long-duration debt, steepening the yield curve.
Looking ahead, the Fed is expected to resume balance sheet growth in a muted form, often referred to as QE-lite (sometimes referred to as Not-QE or Technical-QE), characterized by slow expansion aligned with nominal GDP and focused on bills rather than bonds. We expect the Fed to use the term “Reserve Management Operation” instead of “QE-lite,” as the latter name may be politically sensitive.
QE-lite represents a structural, gradual increase in the Fed’s balance sheet after the end of QT. Its objective is to maintain reserve adequacy and smooth liquidity conditions without signaling aggressive stimulus. Growth typically occurs through reinvestment and modest Treasury purchases, roughly in line with nominal GDP, providing a mild and persistent tailwind for liquidity and asset prices over time. In this sense, QE-lite differs from the tactical liquidity injections of Treasury QE, which are designed to address acute funding stress and stabilize short-term interest rates.
The key distinction is that QE-lite reflects a shift toward gradual balance sheet growth while Treasury QE is a targeted tool for addressing plumbing issues. They can coexist, with Treasury QE deployed within a QE-lite environment during periods of stress.
Fiscal Dominance Ties the Fed’s Hands
The U.S. government spends about $7 trillion annually and borrows roughly $2 trillion. QT reduced liquidity while deficits grew, creating a structural liquidity funding mismatch. Expanding liquidity supports more borrowing but risks fueling inflation. This is a feature of fiscal dominance, where fiscal needs dictate monetary policy and limit the Fed’s independence.
The yield curve is likely to steepen as the Fed pivots toward Treasury bills and private investors absorb more duration risk. Liquidity injections will ease funding stress but will not eliminate refinancing challenges. Equities may experience a mild tailwind from QE-lite, though not the risk-on surge associated with full QE programs.
One sector that will likely be affected by funding liquidity stress is leveraged funds, such as hedge funds. Hedge funds dominate long-end Treasury buying through leveraged basis trades. They hold up to $1.4 trillion in Treasuries14 with leverage ratios of 50–100 times, primarily funded by borrowing in the repo market. Rising repo rates squeeze funding, creating the risk that leveraged funds may engage in disorderly selling of bonds and equities during stress events. As deficits grow, the need for repo financing rises, pushing rates higher. To keep these rates stable, the Fed must inject sufficient liquidity into the system, despite the risks of higher inflation.
Gold thrives in times of fiscal dominance and liquidity expansion. Structural deficits, reserve scarcity and eroding confidence in fiat systems underpin demand for neutral reserve assets. Central banks are already replacing Treasuries with gold in their foreign exchange reserves, a trend likely to accelerate. Liquidity injections that weaken the dollar at the margin, combined with geopolitical uncertainty, reinforce gold’s strategic role in global portfolios. It is widely expected that QE-lite will generally provide liquidity support and maintain sticky inflation, while gold plays an increasingly central role in global reserves.
Fading Yen Carry Trade Hits Risk Assets Globally
Japan’s financial landscape is undergoing a significant shift as its new Prime Minister, Sanae Takaichi, launches an aggressive $135 billion stimulus package, reminiscent of former Prime Minister Shinzo Abe's (Abenomics 2.0). The stimulus package is designed to boost GDP growth, which has been persistently weak. Japan’s GDP growth has remained below 1% for a long time and actually contracted in the third quarter of 2025.
This move has placed pressure on Japanese bonds and the yen due to the anticipated rise in government debt, but it has exerted upward pressure on Japanese equities through stimulus. The sudden impact on monetary and fiscal policies is reshaping the mechanics of the yen carry trade. This trade involved borrowing at a low interest rate in yen and investing in higher-yielding assets abroad. For decades, Japan’s persistently low interest rates made it an attractive funding source for global investors. The yen carry trade facilitated the export of Japanese capital and liquidity to global markets, thereby supporting asset prices and influencing global liquidity.
Rising Japanese yields represent a stong headwind for global asset prices and financial stability, but support gold.
The yen carry trade is notoriously difficult to measure precisely due to its complexity and the variety of instruments and participants involved. Carry trades are often implemented through loans, foreign currency exchange (FX) swaps, forwards, options and portfolio flows, many of which are off-balance sheet. The heavy use of derivatives further complicates the determination of notional values and direct values. Estimates for the total size of the carry trade range considerably, but central bank sources often quote values around $1 trillion.
However, recent developments have altered the dynamics of the yen carry trade. Japanese interest rates have risen sharply, with 10-year Japanese government bond yields increasing from a 2022 low of 0.07% to 1.81% currently (see Figure 4). As FX hedge costs climb, the profitability of the carry trade has diminished. Investors now have less incentive to borrow in yen and invest overseas, drawing capital back to Japan and away from foreign markets. This shift has a dual effect: it reduces the supply of global funding and increases domestic demand for Japanese assets.
As Japanese investors unwind their positions abroad and repatriate their capital, demand for foreign sovereign debt, such as U.S. Treasury securities and European bonds, may decline, leading to higher yields. The process also introduces volatility into currency markets as FX hedges are unwound, acting as a liquidity drain on global markets.
Japan’s role as a major exporter of liquidity has supported global markets for decades. The current reversal in yield differentials and the drying up of access to Japanese liquidity could have systemic implications, reminiscent of historical episodes where shifts in capital flows triggered broader financial disruptions. It represents a significant headwind for global asset prices and financial stability, especially if broader liquidity pressures were to occur, such as the funding liquidity stress discussed earlier.
The end of the yen carry trade also has implications for gold. Unlike prior periods when the yen carry trade unwound, the yen is now weakening with higher yields, another indication of the debasement trade discussed earlier. Usually, higher yields support the underlying currency, but when systematic risk is perceived as too great, both bonds and currencies sell off together (i.e., the US market in April 2025’s tariff-induced sell-off). Global liquidity contractions may cause short-term turbulence, but they often lead to renewed gold buying as investors prioritize stability. Structural demand from central banks and sovereigns provides further support, while technical momentum can amplify price movements during periods of stress. The combination of liquidity tightening, currency volatility and fiscal stimulus creates a bullish backdrop for gold.
Figure 4. Closing Down the Yen Carry Trade (2021-2025)
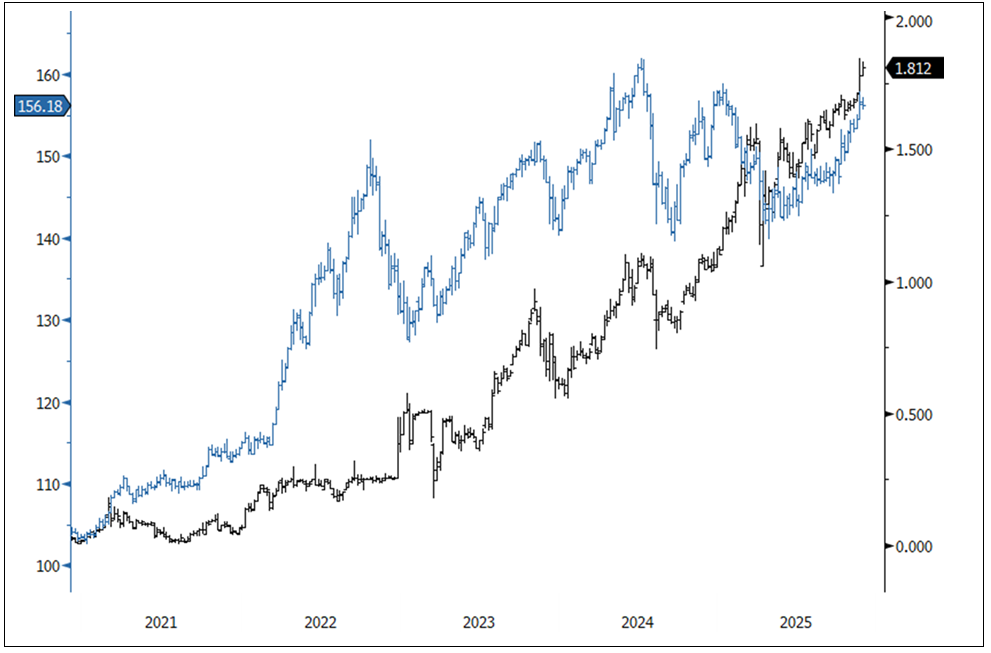
Source: Bloomberg. 10-year Japanese government bond yields (right axis, black line, %) and US dollar / Japanese yen exchange rate (left axis, blue line, JPY per USD). Data as of 12/2/2025. Past performance is no guarantee of future results.
Silver Market: Record Closing High
Spot silver surged $7.81 per ounce (or 16.04%) in November to close the month at $56.50, an all-time closing record for silver. Year-to-date, silver had increased by 95.49% by the end of November, its best performance since 1979. Like gold, the violent sell-off of silver in mid-October did not lead to further downside, and silver prices stayed above their 50-day moving average. November saw silver consolidate its gains before breaking out to new highs on the last day of the month, shaping a bullish cup and handle chart pattern in the process (see Figure 5). Silver ETF buying increased by almost 2%, nearly recovering to October’s high levels. CFTC data on silver has yet to be updated due to the government shutdown.
November's 16% jump pushed silver to all-time highs, solidifying one of its strongest years since 1979.
The breakout on the last day of November was a significant move on a holiday half-day of trading with generally light volume. There was no news (aside from a cooling malfunction shutting down the Chicago Mercantile Exchange’s data center for a period). While there was some speculation that a repeat of mid-October’s silver squeeze might have occurred, the data did not bear this out, as silver lease rates and spot futures spreads both remained calm. Silver options market data also did not bear this out.
Figure 5. Silver’s Bullish Cup and Handle (2024-2025)
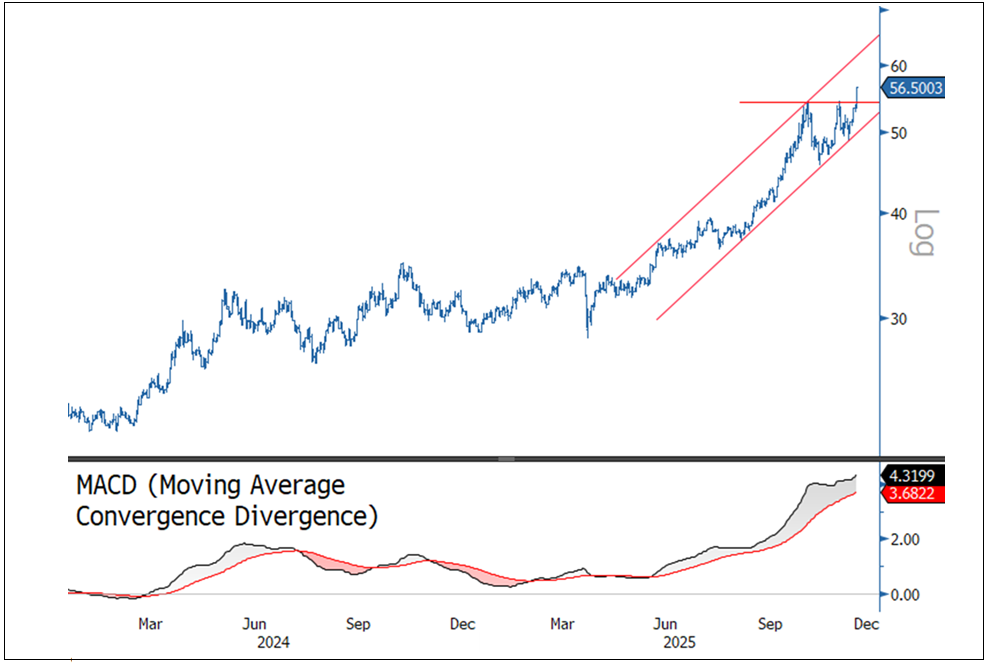
Source: Bloomberg. Silver spot price, $/oz. Data as of 12/2/2025. Past performance is no guarantee of future results.
What’s Driving Silver’s Surge?
The most likely explanation for the surge in silver prices in 2025 is that the availability of free trading inventory may have depleted to the point where any further silver demand is creating price convexity, when price changes tend to speed up as silver supply tightens. This is an argument we have been making for most of this year. In prior commentaries, we have noted that global silver inventories were being reduced to the point where the free float of silver availability would likely result in a possible silver price spike (see Gold Gains Ground as Faith in the Dollar Erodes and Challenges to Fed Autonomy Strengthen Case for Gold).
Reasons for the decline in silver inventory include:
- Persistent Structural Supply Deficit
Silver mine production and recycling have remained essentially flat for over a decade while industrial demand, especially from solar panels and electronics, continues to surge. This has created a persistent and growing supply deficit, with 2025 forecast to be the fifth consecutive year of significant shortages (estimated at 125 million ounces for 2025). The cumulative deficit since 2021 is approaching 800 million ounces. - Inventory Drain and Tight Physical Market
London Bullion Market Association (LBMA) silver inventories have plunged since their 2021 peak, reaching a low in 2025. The rapid drawdown in London vaults signals tightening liquidity and a physical market under stress, which often precedes sharp price moves. - Tariff-Driven Market Dislocations
Tariff uncertainties have triggered arbitrage flows from London to COMEX in New York, driving lease rates higher and pushing COMEX inventories to all-time highs. The migration of metal supply to New York raises the odds of localized squeezes. Silver’s addition to the USGS critical minerals list15 has heightened concerns about future tariffs, reinforcing U.S. demand and raising worries that COMEX silver inventory will not be available to balance prices. - ETF Speculative Positioning and Investment Flows
ETF silver holdings are currently well below their peak (830 million ounces vs. one billion ounces in 2021). A return to previous highs would absorb a large share of current LBMA stocks, potentially overwhelming available metal and accelerating price gains. Futures positioning as of mid-October (new data has been delayed due to the recent U.S. government shutdown) remained well below the speculative extremes seen in past bull runs, leaving room for inflows if prices break through resistance levels. - Macro Tailwinds and Reserve Asset Dynamics
Like gold, silver benefits from the dynamics of the debasement trade, a weaker dollar and heightened policy/geopolitical risks. A steepening yield curve, driven by rising long-end bond yields globally, signals escalating risk, which could lead to currency devaluation and a flight to real/hard assets, such as silver. Silver’s dual role as both a reserve asset and an industrial commodity likely positions it to be the next precious metal after gold to break out to new all-time highs. - Industrial, Photovoltaics and Electronics Demand Growth
Growth in photovoltaics and electronics remains robust, outpacing GDP growth. Even as sentiment concerning renewables has rolled back, actual demand continues to expand, supporting the bull case for silver, whose unique properties make it essentially irreplaceable in these sectors. - Persistent Technical Strength
Throughout 2025, silver has broken above key resistance levels ($35, $40 and then $50/oz), establishing a persistent trend strength typically indicative of significant structural change in its outlook. - China’s Export Controls
China has announced strict new export controls on silver for 2026, fueling a rush to secure the metal before the restrictions take effect. October saw record Chinese silver exports to London, but inventories in Shanghai collapsed, flipping local markets into backwardation, when the spot price of silver is higher than its price for future delivery, a possible sign of physical scarcity.
Silver’s bullish case is anchored in persistent supply deficits, shrinking inventories, tariff-driven market dislocations and robust industrial and investment demand. Macro tailwinds and technical conditions further reinforce the potential for sharp price moves. As investment flows climb and the debasement trade broadens and deepens, silver could experience a further price squeeze.
Footnotes
| 1 | Gold bullion is measured by the Bloomberg GOLDS Comdty Index. |
| 2 | Silver bullion is measured by Bloomberg Silver (XAG Curncy) U.S. dollar spot rate. |
| 3 | The NYSE Arca Gold Miners Index (GDM) is a rules-based index designed to measure the performance of highly capitalized companies in the gold mining industry. |
| 4 | The Bloomberg Commodity Index (BCOM) is a broadly diversified commodity price index distributed by Bloomberg Indices. |
| 5 | The U.S. Dollar Index (USDX, DXY, DX) is an index (or measure) of the value of the United States dollar relative to a basket of foreign currencies, often referred to as a basket of U.S. trade partners' currencies. |
| 6 | The S&P 500 or Standard & Poor's 500 Index is a market-capitalization-weighted index of the 500 largest U.S. publicly traded companies. |
| 7 | CFTC data refers to the weekly Commitment of Traders (COT) reports collected by the U.S. Commodity Futures Trading Commission (CFTC) which detail the positions of different market participants in the U.S. futures and options market, including in gold and silver. These reports are used by traders as a market sentiment indicator to assess speculative interest in various commodities and forecast price trends. |
| 8 | The "debasement trade" is an investment strategy that involves buying safe-haven assets like gold to hedge against the devaluation of fiat currencies, which can be caused by excessive government spending and money printing. It is based on the fear that central banks and governments will reduce the value of currencies through inflation to decrease the real burden of debt. |
| 9 | Fiscal dominance is where the central bank's monetary policy is subordinated to the government's fiscal needs, often to help finance large public debt. This occurs when public deficits are so high that the central bank is pressured to keep interest rates low to reduce the government's borrowing costs, even if it means compromising its main goal of controlling inflation. |
| 10 | Delta is a measure of how much an option’s price changes relative to the underlying asset’s price. "Delta to buy" means traders are adding bullish exposure (via options or hedging) that results in actual stock buying, which supports equity prices near their previous highs. Bullish is the expectation prices will rise and bearish is the expectation prices will fall. |
| 11 | Quantitative tightening (QT) is a monetary policy where a central bank reduces the size of its balance sheet, decreasing the money supply to combat inflation. It involves either selling assets like government bonds or letting them mature without reinvesting the proceeds. Quantitative easing (QE) is where a central bank expands its balance sheet by buying assets like government bonds to inject money into the economy and improve liquidity conditions. |
| 12 | The US repo market is a critical part of the financial system where institutions borrow cash overnight or for short terms by selling securities with an agreement to repurchase them later at a slightly higher price. This huge market is often described as the "plumbing" of the financial system. It facilitates the daily funding needs of large financial institutions by providing trillions of dollars in short-term funding against high-quality collateral like U.S. Treasuries. |
| 13 | SOFR (Secured Overnight Financing Rate) is a broad measure of the cost of borrowing cash overnight against U.S. Treasury securities. IORB (interest on reserve balances) is the rate the U.S. Federal Reserve pays to eligible financial institutions on the reserves they hold in their master accounts at the Fed. The OIS rate is the fixed rate on an overnight indexed swap, which is a derivative contract where two parties exchange interest payments. The RRP rate is the overnight reverse repurchase agreement rate set by the Federal Reserve to establish a floor for money market rates and influence short-term interest rates. |
| 14 | The Treasury General Account (TGA) is the U.S. government's primary operating bank account, used to handle daily transactions like collecting tax revenue and paying government expenses. |
| 15 | Source: U.S. Federal Reserve, FEDS Notes, “The Cross-Border Trail of the Treasury Basis Trade,” October 15, 2025. |
| 16 | The USGS critical minerals list is a list of 60 minerals identified by the U.S. Geological Survey as essential to U.S. economic and national security, serving a vital function in manufacturing and facing supply chain vulnerabilities |


Investment Risks and Important Disclosure
Relative to other sectors, precious metals and natural resources investments have higher headline risk and are more sensitive to changes in economic data, political or regulatory events, and underlying commodity price fluctuations. Risks related to extraction, storage and liquidity should also be considered.
Gold and precious metals are referred to with terms of art like "store of value," "safe haven" and "safe asset." These terms should not be construed to guarantee any form of investment safety. While “safe” assets like gold, Treasuries, money market funds and cash generally do not carry a high risk of loss relative to other asset classes, any asset may lose value, which may involve the complete loss of invested principal.
Past performance is no guarantee of future results. You cannot invest directly in an index. Investments, commentary and opinions are unique and may not be reflective of any other Sprott entity or affiliate. Forward-looking language should not be construed as predictive. While third-party sources are believed to be reliable, Sprott makes no guarantee as to their accuracy or timeliness. This information does not constitute an offer or solicitation and may not be relied upon or considered to be the rendering of tax, legal, accounting or professional advice.