

Key Takeaways
- Gold rose for a fifth straight month and is up 25.33% YTD, as markets reacted to tariff shifts, fiscal concerns and bond market volatility; long-term drivers like inflation, deglobalization and rising deficits continue to support gold’s structural bull case.
- At this writing, silver was breaking out above the $35 resistance level. Silver has been in a structural deficit since 2021, and overall demand has been outstripping supply since 2021 a trend that will likely continue.
- The foundation on which the U.S. dollar has built its dominance as the world’s reserve currency for the last 80 years is shifting, undermined by America’s rising fiscal deficits and the current administration's erratic trade policies.
- America’s adversaries have long pursued alternative payment systems and local currency invoicing, but now even its allies are quietly diversifying away from U.S. dollar assets.
- Fiscal uncertainty in the U.S. and other developed economies with big debt burdens means higher bond yields, asset market pressure and potentially slower economic growth—all bullish for gold.
Performance as of May 31, 2025
| Indicator | 5/31/2025 | 4/30/2025 | Change | Mo % Chg | YTD % Chg | Analysis |
| Gold Bullion1 | $3,289.25 | $3,288.71 | $0.54 | 0.02% | 25.33% | Fifth straight up month |
| Silver Bullion2 | $32.98 | $32.62 | $0.37 | 1.12% | 14.12% | In a bullish configuration, breakout watch |
| NYSE Arca Gold Miners (GDM)3 | 1,416.16 | 1,377.21 | 38.95 | 2.83% | 48.04% | Fifth straight up month |
| Bloomberg Comdty (BCOM Index)4 | 99.99 | 100.93 | (0.94) | (0.93)% | 1.24% | Agriculture & Energy dragging |
| DXY US Dollar Index5 | 99.33 | 99.47 | (0.14) | (0.14)% | (8.44)% | Fifth straight down month |
| S&P 500 Index6 | 5,911.69 | 5,569.06 | 342.63 | 6.15% | 0.51% | Best monthly return since November 2023 |
| U.S. Treasury Index | $2,347.66 | $2,372.05 | ($24.39) | (1.03)% | 2.51% | Fiscal deficits & USD weighing on bonds |
| U.S. Treasury 10 YR Yield* | 4.40% | 4.16% | 0.24 | 24 BPS | -17 BPS | |
| Silver ETFs** (Total Known Holdings ETSITOTL Index Bloomberg) | 741.02 | 736.19 | 4.83 | 0.66% | 3.47% | Silver in ETFs forming large base |
| Gold ETFs** (Total Known Holdings ETFGTOTL Index Bloomberg) | 88.22 | 88.90 | (0.68) | (0.77)% | 6.47% | First down month YTD |
Source: Bloomberg and Sprott Asset Management LP. Data as of May 31, 2025.
* BPS stands for basis points. **ETF holdings are measured by Bloomberg Indices; the ETFGTOTL is the Bloomberg Total Known ETF Holdings of Gold Index; the ETSITOTL is the Bloomberg Total Known ETF Holdings of Silver Index.
Gold Market: Wild Swings on Tariff Headlines
Spot gold rose slightly in May by $0.54 per ounce (or 0.02%) to close at $3,289. Gold has risen for five straight months since the start of 2025 and was up 25.33% year-to-date at the end of May, one of the best yearly starts since 1974. May was volatile as myriad tariff headlines swung the markets wildly. Most asset classes were affected. During the month, tariff-easing news led to outsized bullish equity squeezes. Then by mid-month, the U.S. House of Representatives passed the reconciliation tax bill (which is now in the Senate). This caused the bond market and the U.S. dollar to sell off on fears that the bill would increase the already ballooning U.S. national debt by an estimated $2.4 trillion over the next decade, according to the Associated Press (most street estimates put this figure at $4 trillion).
The S&P 500 Index7 had a solid recovery month (6.15%) as the punishingly high tit-for-tat tariff levels that the U.S. and China levied on each other were rolled back and paused, creating a rebound in the market from very oversold and underweighted equity exposure levels. Equity markets have bounced 18.64% off their closing lows this year and are a mere -3.83% from their all-time closing highs. This is despite rising yields, especially in the long end, and companies withdrawing earnings guidance due to tariff uncertainty. While the equity markets have recovered most of their downside, the U.S. dollar (USD) remains weak and unable to rally on any news. The bond market has also been under pressure, with a bearish steepening of the yield curve, reflecting investor concerns over fiscal deficits, inflation, Treasury bond supply and governance issues.
The long-term secular and structural drivers of gold remain firmly in place and are likely still in the early stages.
The gold market traded in a consolidation range during May as it absorbed tariff headlines and bond market developments. Overall, we see gold undergoing a short-term correction before resuming its advance, much like other episodes over the past few years where sharp price spikes were followed by brief consolidations (see red boxes in Figure 1). Gold’s long-term secular and structural drivers remain firmly in place and are likely still in the early stages. We have discussed many of these macro drivers over the past few years, such as deglobalization, de-dollarization trends, the need for multi-asset monetary reserves, inflation, unsustainable fiscal deficits, the reordering of the global trading system and others. All these factors have accelerated noticeably in 2025 with the aggressive policies of the second Trump administration.
In this month's commentary, we will look at developments in the U.S. dollar and long bond yields and how they are likely to increase gold prices.
Figure 1. Gold Is Consolidating Inside a Bullish Trend (2022-2025)
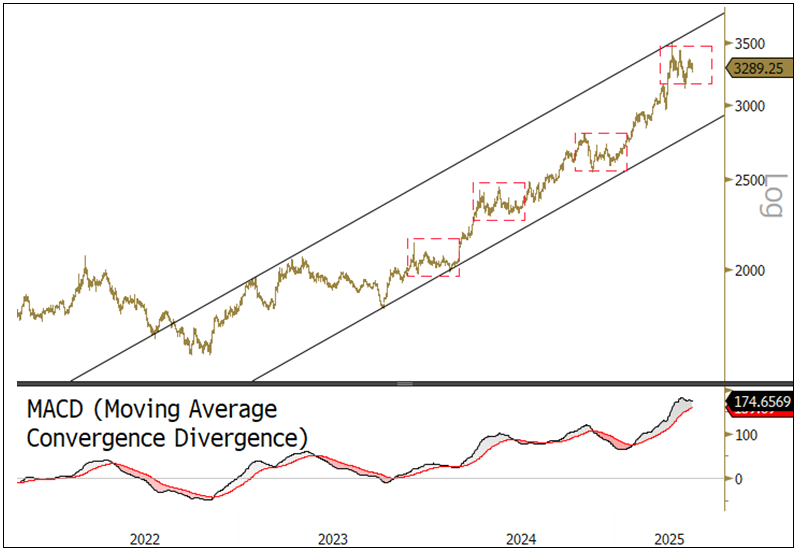
Source: Bloomberg. Gold bullion spot price, US dollar/oz. Data as of 5/31/2025. Moving average convergence/divergence is a trend-following momentum indicator that shows the relationship between two exponential moving averages (EMAs). Past performance is no guarantee of future results.
Threats to U.S. Dollar Dominance
For almost eight decades, the architecture of global finance has rested on the U.S. dollar's reserve-currency status. That special status was built on three pillars: the dollar as a medium of exchange, an official reserve asset and an ultimate safe haven. This foundation is now shifting. Sanctions have spurred adversaries to develop alternative payment systems and local currency invoicing, and now even allies are quietly diversifying away from U.S. dollar assets. These early, gradual reallocations have already caused tremors, suggesting several tumultuous years ahead. Gold has been the prime beneficiary, yet even gold’s recent rally still looks like the opening innings of a protracted saga.
Gold is reclaiming its role as the ultimate safe haven as the dollar’s dominance fades and global trust in U.S. leadership erodes.
The U.S. has now paired century-high tariff rates with an increasingly unilateral foreign-policy stance, walking away from multilateral frameworks and casting doubt on long-standing security guarantees. The Trump administration argues that the U.S. dollar overvaluation and reserve-currency obligations undermine U.S. industry. It is openly questioning whether the U.S. should continue to underwrite the system it built and has maintained for generations. Foreign investors, however, see something different: a surging U.S. fiscal deficit near 7% of GDP, tax-cut proposals skewed toward the very wealthy, and an executive temperament that appears erratic and authoritarian.
The U.S. administration’s initial strategy was to connect revenue and realpolitik by using punitive import taxes to plug the widening U.S. budget hole while forcing supply chains to reshore in the U.S. Markets revolted almost immediately. In early April, the U.S. dollar, Treasury bonds and U.S. equities all sold off together in multi-standard deviation moves. This extraordinary correlation shift exposed the fragility of the “exorbitant privilege" that the U.S. has enjoyed through the dollar’s reserve currency status. Facing a prospective buyers' strike in the Treasury bond auctions, Trump announced a 90-day pause on the most draconian tariffs. It was an implicit acknowledgment that excessive tariffs would accelerate foreign divestment, deepen recession risk and ultimately worsen the U.S.’ debt and fiscal deficit situation.
Confronting the Triffin Dilemma
Though the U.S. is the world’s largest debtor, its obligations occupy a unique place in the global financial plumbing system. Treasuries function as “interest-bearing dollars” that form the bedrock collateral for repo markets, derivatives margining and central bank reserves. The larger the U.S. Federal deficit, the more the system relies on steady foreign inflows to absorb new issuance. April's simultaneous liquidation of U.S. bonds, dollars and equities revealed how quickly that arrangement can buckle when investors lose faith in U.S. stewardship.
This is the central contradiction behind a reserve currency—the so-called Triffin dilemma. In the 1960s, the Belgian-American economist Robert Triffin noted that any issuer of the world's reserve currency faces an impossible bind: to supply global liquidity, it must run persistent trade deficits, yet those same deficits eventually undermine confidence in the currency. The U.S. has lived with this contradiction for decades, but the strain is now becoming more visible. The Triffin dilemma suggests that sustaining global dollar liquidity while shrinking the trade deficit is impossible without a weaker currency. In that environment, higher yields become the default release valve unless the dollar weakens sufficiently to attract real money inflows into U.S. exports of goods and services.
As the Triffin dilemma plays out, investors are turning to gold as trust in the dollar’s long-term stability erodes.
Against this backdrop, gold’s advance can be seen as a sensible pricing response to the growing repercussions of the Triffin dilemma. While investors question the neutrality of Treasury bonds and the stability of the U.S. dollar they reach for non-sovereign stores of value, primarily gold bullion. Commodities with robust supply-demand fundamentals also stand to benefit from a structurally weaker U.S. dollar and from investors' search for real assets that hedge against both inflation and geopolitical disorder. The bond market, by contrast, faces a future in which yields may drift higher even during slowdowns, reflecting not just inflation risk but also a creeping discount for political unpredictability.
The U.S. fiscal spending machine has long relied on the dollar's unique status to fund deficits cheaply (the so-called exorbitant privilege). While the U.S. can run large deficits due to the U.S. dollar’s reserve status, it cannot behave in a way that jeopardizes that privilege. Fiscal deficits matter, and foreign investors and creditors are growing uneasy with erratic U.S. policy. They are demanding either higher compensation or more disciplined fiscal policy.
April's violent three-way sell-off in U.S. Treasuries, equities and the dollar may be a glimpse of what disorderly adjustment could look like. The least disruptive way out appears to be a controlled depreciation of the U.S. dollar to avoid risking bond market stress. In Figure 2, we highlight how the U.S. dollar (represented by the U.S. Dollar Index or DXY)8 seems likely to test and possibly break out of its long-term rising bullish channel.
Figure 2. DXY Tests Long-Term Uptrend (2006-2025)
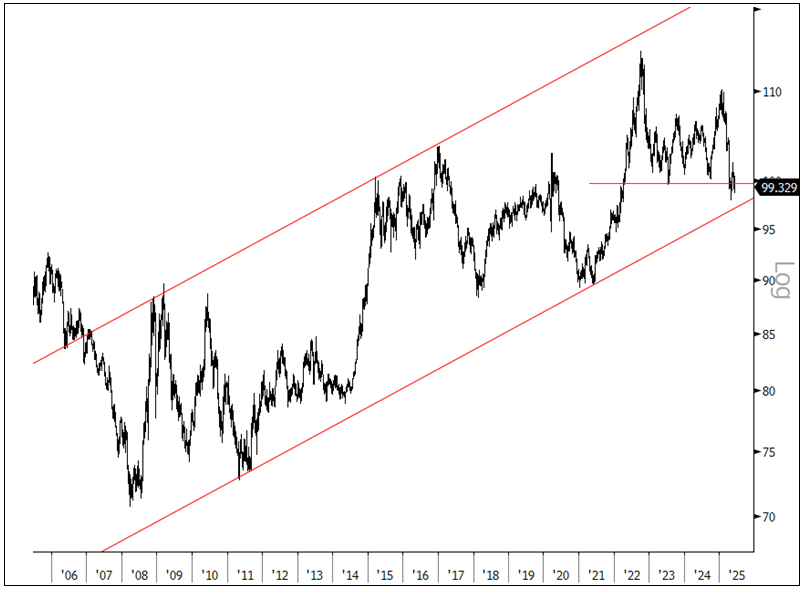
Source: Bloomberg. Data as of 6/3/2025. DXY is an index of the value of the U.S. dollar relative to a basket of foreign currencies published by the Intercontinental Exchange. Past performance is no guarantee of future results.
Fiscal Uncertainty Means Higher Yields
Almost every major developed economy is now running large fiscal deficits, a trend exacerbated by a series of global shocks: the 2008 financial crisis, the COVID-19 pandemic and the ongoing war in Europe. These events forced governments to step in as insurers of last resort, normalizing heavy borrowing as a means of stabilizing economies. As a result, the average public debt-to-GDP ratio in advanced economies has returned to roughly 100%, and projections based on spending intentions show that debt should continue to rise.
Structural inflation constitutes another pressure point on government spending. It is driven by factors like deglobalization, tariff and trade tensions, an aging population, larger defense budgets, the green transition and a rising cost of capital. Combined, these forces place heavy fiscal demands on governments.
Governments face limited options to manage the situation. Typical solutions include politically unacceptable deep spending cuts and/or significant tax hikes. Another severe choice would be financial repression, a tactic that was used after World War II, where nations capped bond yields, steered savings into sovereign bonds and allowed moderate inflation to erode real debt levels. While this approach may provide temporary relief, it often comes with long-term consequences, including reduced economic growth and the erosion of investor confidence (consider Japan’s lost decades).
Return of the Bond Vigilante
With U.S. government borrowing having reached levels last seen at the end of World War II, bond markets are beginning to question when the strain of rising debt will reach breaking point. Investors are increasingly concerned that with rising yields a new generation of “bond vigilantes” could drive up financing costs just when economies can least afford it.
Bond vigilantes—investors who react sharply to rising debt and inflation concerns—were a feature of past decades when investors lost confidence in government bond markets. A recent example was the UK’s 2022 mini budget where unfunded tax cuts led to soaring gilt yields and a plummeting pound until the Bank of England intervened to stabilize the market. The U.S., with its large and persistent deficits, could be facing a similar situation as bond buyers begin to demand higher yields to compensate for growing fiscal and political risks. The persistent weakness in the U.S. dollar only adds to the downside pressures.
Bond vigilantes are back, driving yields higher as debt fears mount.
The rise in long-term yields is not unique to the U.S. It is a global trend. Countries like Japan, the UK and Germany are seeing similar pressures, with yields climbing as fiscal risks mount. Japan, for example, is grappling with a debt-to-GDP ratio exceeding 200%, and the country's central bank has struggled to cap rising yields. This underscores the fact that high levels of sovereign debt and rising yields are a global risk.
Pressures like these have caused a significant shift in the long end of government bond markets in recent years. Notable was the recent surge in 30-year U.S. Treasury yields to over 5% (see Figure 3). It reflects rising concerns over fiscal sustainability compounded by governance issues. In particular, the failure to address growing deficits, has only worsened the outlook for long-term debt management. A case in point is the latest proposed U.S. spending bill which is projected to add about $2.4 trillion to the national debt over the next 10 years.
Figure 3. Global Rise of 30-Year Yields (2010-2025)
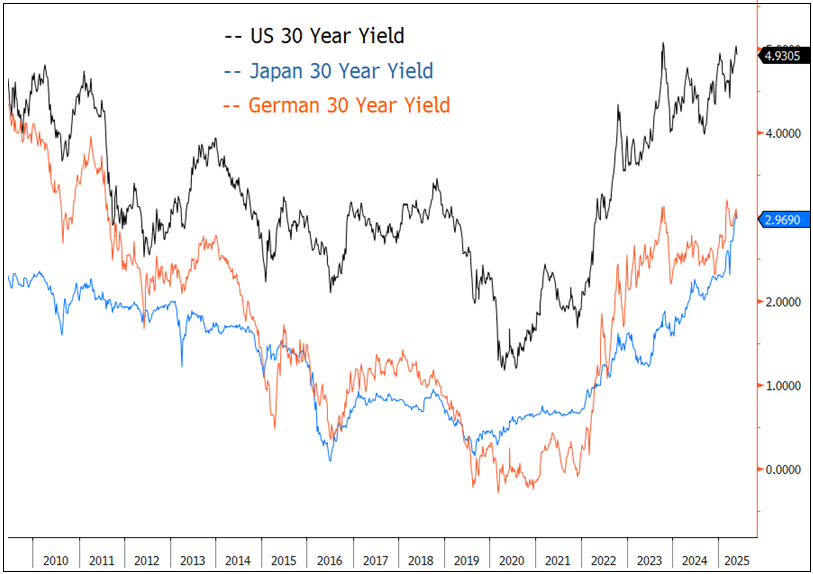
Source: Bloomberg. Data as of 6/3/2025. Past performance is no guarantee of future results.
The "Sell America" Trade
As concerns about U.S. fiscal management mount, a broader “sell America” narrative has emerged. Foreign investors, once enthusiastic buyers of U.S. Treasuries, are now pulling back from the market. Treasury holdings by foreign governments and exchange-traded funds (ETFs) have dropped significantly, especially in Asia, where reserve managers are reducing their purchases due to the rising fiscal and political risks. This withdrawal of foreign capital, coupled with higher yields, has created a self-reinforcing cycle where the weakening dollar and rising long-end yields further erode confidence in U.S. assets.
Tightening financial conditions could dampen economic growth. Higher borrowing costs for both governments and businesses are likely to lead to slower investment, weaker consumer spending and a drag on overall economic activity. In equity markets, higher yields exert downward pressure on asset price valuations, particularly in growth sectors like technology. This, coupled with the weakening dollar, creates a “double squeeze” on the U.S. economy, forcing businesses to contend with higher capital costs and the volatility of a weakening currency.
As the “sell America” trade intensifies and bond vigilantes return to the market, the pressure on governments to stabilize their debt and restore investor confidence will only increase. Whether through fiscal reforms, debt restructuring or financial repression, the coming years will likely be marked by significant challenges in managing sovereign debt with potentially severe consequences for economic growth and financial stability.
In this environment, gold's recent surge is less about investment demand than about trust as buyers seek a store of value untethered to fiscal or geopolitical choices.
Together, the twin stories of a fraying U.S.-centric monetary order and a worldwide upswell in sovereign debt are forcing investors to question the safety of government debt just as those debt levels multiply. The U.S. tariff-driven retreat from multilateralism and the return of the bond vigilantes erode confidence in both U.S. government bonds and the U.S. dollar. This forces term premiums higher, reduces the role of the U.S. dollar as a safe haven, and encourages reserve managers to diversify toward alternative currencies and real assets. In this environment, gold's recent surge is less about investment demand than about trust as buyers seek a non-sovereign store of value untethered to any one government's fiscal or geopolitical choices.
Silver Market: Ready to Test Resistance
Silver rose $0.37/oz (or 1.12%) in May to close the month at $32.98/oz. Like gold and copper, silver traded in a narrow range during the month. Technically, silver is recovering from the significant selling event in early April when widespread de-grossing and deleveraging forced liquidation (see Figure 4). The silver price is preparing to test the critical $35/oz resistance level which, if cleared, would set up a breakout pattern with a $40-42/oz target.
Rising long-end bond yields in every developed economy are signs of escalating risk, such as inflation fears or fiscal instability due to high debt. A sustained and persistent rise across global long yields could lead to all currencies weakening relative to real/hard assets. In the short term, this positive commodity driver is in a tug of war with fears of a global slowdown. Silver, due to its dual role as a both a reserve asset and an industrial commodity, could be the first non-gold metal to break out higher. If all major currencies are facing devaluation, led by the U.S. dollar, commodities would likely not only rise in value but start to attain some measure of the kind of reserve status last seen in the 1970s.
Figure 4. Setting Up for a Possible Breakout
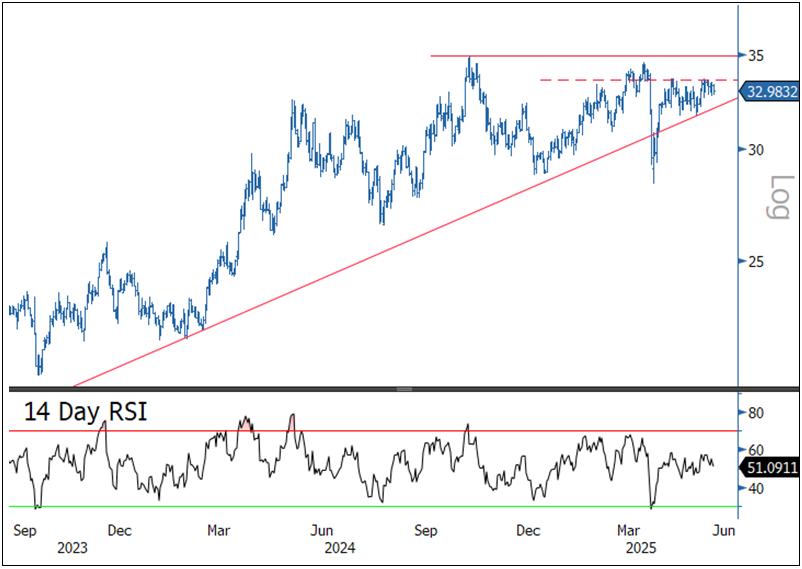
Source: Bloomberg. Silver spot price, U.S. dollar/oz. Data as of 5/31/2025. RSI = relative strength indicator, a momentum indicator that measures the speed and magnitude of price changes to evaluate overvalued or undervalued conditions. The area above the red line indicates buying pressure or overbought conditions, while the area beneath the green line indicates selling pressure or oversold conditions. Included for illustrative purposes only. Past performance is no guarantee of future results.
The Silver Institute recently released its 2025 Silver World Survey, which we summarize in Figure 5. It notes that the macro tailwinds which powered silver in 2024—looming rate cuts by the U.S. Federal Reserve, a softer dollar and heightened policy/geopolitical risk under the new U.S. administration—remain intact. If the Fed were to ease later this year in an environment of ballooning U.S. debt and a policy push to shrink the trade deficit, it would be seen as undermining the U.S. dollar and adding fuel to precious metals demand. Continued robust central bank demand supports gold prices directly and silver indirectly. Overall, the Silver Institute expects silver to probe multi-year highs in mid-2025.
Silver is nearing a critical breakout, backed by structural deficits and rising macro tailwinds.
Mine supply for 2025 is forecast to rise by 1.9% to 835 million ounces (moz), while little change is expected in recycling supply. The overall supply profile has remained essentially flat for the past decade. On the demand side, after four straight record growth years, photovoltaic demand is expected to fall due to lower silver loadings despite higher cell volumes.9 The overall market is expected to see a deficit of -118 moz which would be the fifth straight year of significant shortages.
Figure 5. Silver Institute World Silver Survey 2025
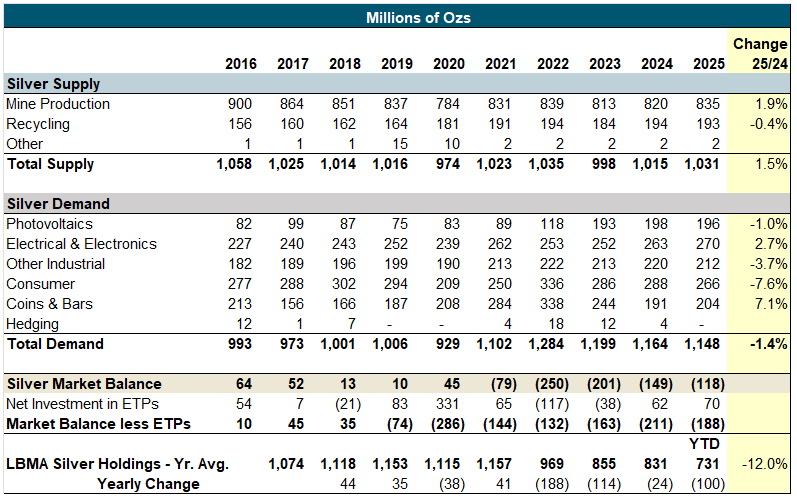
Source: Silver Institute, London Bullion Market Association.
Silver’s structural deficits keep grinding away at inventories. The forecasts suggest 2025 could mark the fifth straight year of shortage and push the 2021-25 cumulative deficit to ~800 moz. Modest expected growth in mine supply could not offset flat recycling and plateauing industrial offtake. London Bullion Market Association (LBMA) vault silver holdings have shrunk rapidly since 2021 and are now at their lowest level since the data series began.
Earlier this year, silver had been arbitraged out of London into COMEX warehouses to avoid potential tariffs10, driving COMEX-registered stocks to an all-time high of 495 moz. While silver lease rates have now normalized, the migration of metal to New York concentrates available supply in a single venue and raises the odds of localized squeezes. So far, there has been no news on specific silver tariffs (yet).
Visible investment demand is light relative to history but has plenty of room to grow. Exchange-traded products hold roughly 740 moz, down nearly 260 moz from the 2021 peak. A return to previous highs would absorb almost a third of current LBMA stocks, potentially overwhelming what remains of freely available metal. Futures positioning is still well below the speculative extremes seen in past bull runs, leaving scope for trend-following inflows from CTAs11 if prices break resistance levels.
Silver’s beta to gold also offers catch-up potential (the 20-year historical beta is 1.46)12. The widely watched gold-to-silver ratio has widened to ~100 (top two-percentile over the past 20 years), and any mean reversion from gold into silver could mean a significant price change.
Despite a pause in the rapid growth of the photovoltaics industry, silver's 2025 narrative continues to center on a physical market in structural deficit. The swift drawdown of London inventories and the potential for ETF restocking highlight the tightness in supply. If macroeconomic uncertainty persists and investment flows return to historical norms, the market may come to realize that its perception of being “well-supplied” with silver was overstated, potentially setting the stage for the first genuine squeeze since the early 2010s.
Footnotes
| 1 | Gold bullion is measured by the Bloomberg GOLDS Comdty Index. |
| 2 | Silver bullion is measured by Bloomberg Silver (XAG Curncy) U.S. dollar spot rate. |
| 3 | The NYSE Arca Gold Miners Index (GDM) is a rules-based index designed to measure the performance of highly capitalized companies in the gold mining industry. |
| 4 | The Bloomberg Commodity Index (BCOM) is a broadly diversified commodity price index distributed by Bloomberg Indices. |
| 5 | The U.S. Dollar Index (USDX, DXY, DX) is an index (or measure) of the value of the United States dollar relative to a basket of foreign currencies, often referred to as a basket of U.S. trade partners' currencies. |
| 6 | The S&P 500 or Standard & Poor's 500 Index is a market-capitalization-weighted index of the 500 largest U.S. publicly traded companies. |
| 7 | The S&P 500 or Standard & Poor's 500 Index is a market capitalization-weighted index of the 500 largest U.S. publicly traded companies. |
| 8 | The U.S. Dollar Index (DXY, USDX or DX) is a measure of the value of the U.S. dollar relative to a basket of U.S. trade partners' currencies. It is maintained by the Intercontinental Exchange (ICE). |
| 9 | Photovoltaic demand represents demand for silver from the solar power industry, based on the total amount of solar panels and solar power systems expected to be installed. As solar panels become more efficient, they need less silver to generate the same amount of wattage. |
| 10 | COMEX stands for The Commodity Exchange, a division of the Chicago Mercantile Exchange Group (CME Group) and a major futures and options exchange for trading metals, including gold and silver. The threat of U.S. tariffs on silver led traders to move silver stocks from London to the U.S. to avoid potential levies. |
| 11 | CTAs are commodity trading advisors. Together with exchange-traded funds (ETFs) they make up the bulk of investment demand for silver. |
| 12 | Beta is a measurement of the price volatility of one asset compared to another. Silver’s historical beta to gold of 1.46 means that over the past 20 years the silver price has on average risen by $1.46 for every $1 increase in the price of gold. |


Investment Risks and Important Disclosure
Relative to other sectors, precious metals and natural resources investments have higher headline risk and are more sensitive to changes in economic data, political or regulatory events, and underlying commodity price fluctuations. Risks related to extraction, storage and liquidity should also be considered.
Gold and precious metals are referred to with terms of art like "store of value," "safe haven" and "safe asset." These terms should not be construed to guarantee any form of investment safety. While “safe” assets like gold, Treasuries, money market funds and cash generally do not carry a high risk of loss relative to other asset classes, any asset may lose value, which may involve the complete loss of invested principal.
Past performance is no guarantee of future results. You cannot invest directly in an index. Investments, commentary and opinions are unique and may not be reflective of any other Sprott entity or affiliate. Forward-looking language should not be construed as predictive. While third-party sources are believed to be reliable, Sprott makes no guarantee as to their accuracy or timeliness. This information does not constitute an offer or solicitation and may not be relied upon or considered to be the rendering of tax, legal, accounting or professional advice.