

Key Takeaways
- Energy Shock Becomes a Systemic Event: The closure of the Strait of Hormuz transformed geopolitical tension into a full-scale macro shock, driving inflation, tightening liquidity, and forcing a global repricing of risk assets.
- Gold Fell for Technical Reasons, Not a Broken Thesis: Gold’s drop was driven by forced selling and liquidity stress, not by a change in its long-term outlook.
- Central Banks Are Backed Into a Corner: With inflation rising and growth slowing, policymakers may have no choice but to add liquidity, supporting real assets.
- Gold’s Role Is Strengthening: As financial stress builds, gold is likely to re-emerge as a trusted store of value and global monetary anchor.
- Silver Is Gaining a New Tailwind: Rising energy insecurity is accelerating solar demand, making silver increasingly strategic.
Performance as of March 31, 2026
| Indicator | 3/31/26 | 2/28/26 | Change | Mo % Chg | YTD % Chg | Analysis |
| Gold Bullion1 | $4,668.06 | $5,278.93 | -$610.87 | -11.57% | 8.07% | Largest monthly drop since October 2008. |
| Silver Bullion2 | $75.17 | $93.79 | -$18.62 | -19.85% | 4.89% | Largest monthly drop since September 2011. |
| NYSE Arca Gold Miners (GDM)3 | 2,602.47 | 3,299.41 | -696.94 | -21.12% | 6.53% | Largest monthly drop since July 2015. |
| Bloomberg Comdty (BCOM Index)4 | 135.25 | 121.68 | 13.56 | 11.15% | 23.30% | Largest monthly gain since May 2009. |
| DXY U.S. Dollar Index5 | 99.96 | 97.61 | 2.35 | 2.41% | 1.67% | Testing an important resistance level. |
| S&P 500 Index6 | 6,528.52 | 6,878.88 | -350.36 | -5.09% | -4.63% | Largest monthly drop since March 2025. |
| U.S. Treasury 10-YR Yield* | 4.32 | 3.94 | 0.38 | 38 BPS | 15 BPS | Testing important levels. |
| Silver ETFs** (Total Known Holdings ETSITOTL Index Bloomberg) | 798.20 | 834.04 | -35.28 | -4.30% | -7.58% | Silver ETF levels are back to September 2025 levels. |
| Gold ETFs** (Total Known Holdings ETFGTOTL Index Bloomberg) | 97.89 | 100.92 | -3.03 | -3.00% | -1.07% | Gold ETF levels are back to December 2025 levels. |
Source: Bloomberg and Sprott Asset Management LP. Data as of March 31, 2026.
* BPS stands for basis points. **Bloomberg Indices measure ETF holdings; the ETFGTOTL is the Bloomberg Total Known ETF Holdings of Gold Index; the ETSITOTL is the Bloomberg Total Known ETF Holdings of Silver Index.
Forced Selling Drives Gold's Largest Decline Since 2008
At March month-end, spot gold fell $610.87 per ounce (or -11.57%) to close at $4,668.06, registering the largest monthly decline since October 2008, the height of the Global Financial Crisis (GFC). Gold opened the month with modest gains amid escalating U.S.-Iran tensions, but soon drifted lower. In mid-March, gold dropped sharply, breaking below $5,000 and falling nearly $900 to its intraday low in just four days. Spot gold reached an intraday low of $4,099.17 in the overnight market, in the thinnest liquidity zone, when both the Chinese and European trading markets were closed. In our recent special report (Why Gold Has Fallen: A Liquidity Story, Not a Broken Thesis), we examined the mechanics behind the violent sell-off in detail.
In short, the evidence points to two main events coinciding: 1) the loss of the persistent secular bid from reserves flows cycling excess USD surpluses into gold, and 2) a de-grossing7 and deleveraging across the largest investment funds. Mechanically, the sharp drop in gold prices was caused by various funds selling into a liquidity vacuum, as large buyers such as the GCC oil producers had their oil revenue flows cut off by the closure of the Strait of Hormuz. Since the March 23 lows, gold has recovered to $4,668.06, recouping approximately two-thirds of its decline from the $5,000 level.
Figure 1. Spot Gold Performance (2022-2026)
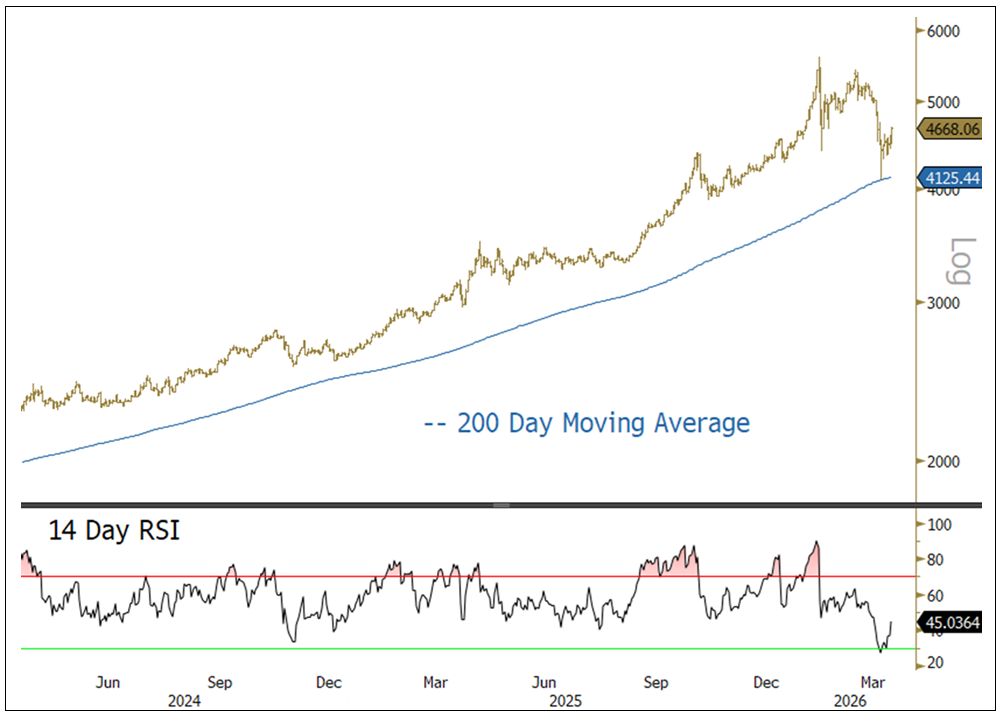
Source: Bloomberg. Gold spot price, $/oz. Data as of 4/5/2026. The 14-day RSI (Relative Strength Index) is a momentum oscillator that measures the speed and magnitude of recent price changes to assess whether an asset is overbought or oversold. It compares the average size of up-days to down-days over the prior 14 sessions and plots the result on a scale of 0 to 100.
Energy Shock and Liquidity Stress
March marked an inflection point for global markets as the U.S.-Iran conflict evolved into an energy-driven macro shock. What initially appeared as a geopolitical risk quickly forced a repricing of inflation, rates and volatility, with energy supply concerns overwhelming growth data and policy expectations. Markets moved decisively away from near-term easing toward a stagflationary outlook, tightening financial conditions in the process.
The Hormuz energy shock drained liquidity and forced markets lower.
The first stress point was sovereign bond markets. Rising energy supply risks lifted inflation expectations, particularly in energy-importing regions. European bonds sold off sharply as rate cut expectations collapsed, while UK gilts repriced violently. In the U.S., the yield curve reflected growing tension between weakening growth signals and energy-driven inflation risk. Bond volatility rose decisively, breaking long-term trend levels and signaling tightening liquidity through the collateral channel8 rather than through traditional credit stress.
As March progressed, pressure intensified at the front end of global yield curves. U.S. and G7 yields moved higher together, consistent with rising stagflation risk. For much of March, however, equities expressed war-related risk mainly through volatile markets rather than outright risk-off price action. Equities remained relatively resilient, supported by hopes of a swift resolution and by volatility-selling behavior, as implied volatility rose faster than realized moves. That resilience began to fade as the month-end approached.
By mid- to late-March, stocks and bonds began selling off together, eroding diversification benefits. Energy-led inflation fears forced hawkish rate repricing, strengthened the USD, and triggered synchronized deleveraging across foreign exchanges (FX), rates, equities and commodities. Even hard-asset inflation hedges, including precious metals, came under pressure as portfolios reduced gross exposure amid rising implied and realized volatility.
Part I. The U.S.-Iran War and the Closure of the Strait of Hormuz
Introduction: Energy Scarcity as a Macro and Financial Shock
The U.S.-Iran war represents a uniquely dangerous geopolitical risk because it directly threatens the physical functioning of the global energy system. The effective closure of the Strait of Hormuz is not a conventional oil shock driven by prices or policy; it is a hard supply disruption that cannot be arbitraged away. Energy shocks of sufficient duration are inflationary, regressive and destabilizing, with global spillovers across asset classes, forcing adjustment through demand destruction, sovereign balance-sheet stress and, ultimately, policy constraints rather than market clearing.
1. Why the Closure of the Strait of Hormuz Matters
The Strait of Hormuz is the single most important chokepoint in the global energy system. Roughly 20% (about 21 million barrels per day; see Figure 2) of global oil and gas exports normally transit the Strait. Its effective closure is not a conventional price shock; it is an extreme physical supply shock that halts the market’s normal adjustment mechanisms.
Figure 2. Daily Flows of Global Oil at Critical Choke Points
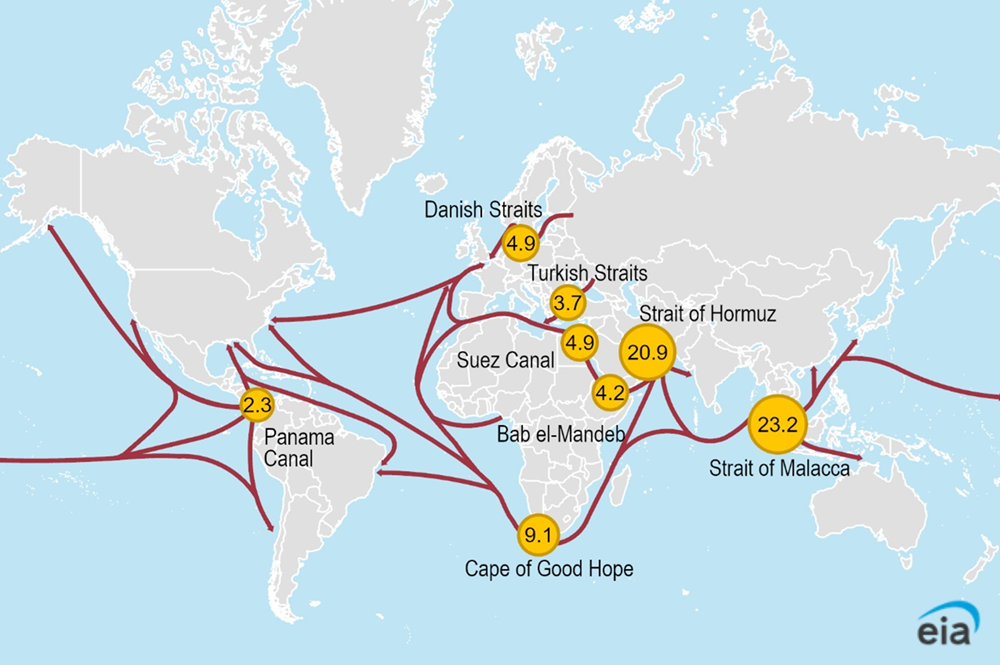
Data source: U.S. Energy Information Administration (EIA) analysis, based on Vortexa tanker tracking. Figures represent millions of barrels per day. World Bank and Panama Canal Authority data, using EIA conversion factors and calculations.
Note: 1H25=first half of 2025
Unlike prior oil crises such as the 1970s embargoes, the 1979 Iranian Revolution or the 2022 Russia-Ukraine war, this disruption cannot be solved by rerouting flows, drawing down spare capacity or releasing strategic reserves alone. Most of OPEC’s spare capacity sits on the wrong (western) side of Hormuz. Alternative routes, such as Saudi Arabia’s East-West pipeline and the UAE’s Fujairah export terminal, can replace only a fraction of lost volumes and are themselves vulnerable to attack.
If the Strait remains blocked indefinitely, supply and demand can only rebalance through demand destruction, which would require prices to rise to cause recessionary levels. Energy is a non-substitutable input across transport, food, manufacturing and trade, making this adjustment economically severe. Even a rapid ceasefire would not quickly normalize conditions: tanker congestion, forced production shutdowns and infrastructure damage would extend the shock well beyond the military conflict.
2. Second Order Economic Effects: From Energy Shock to Global Disruption
The economic importance of Hormuz lies not only in the scale of lost supply but in the fact that it cannot be arbitraged away. This forces cascading second-order effects across fuel markets, industry, trade and inflation, which persist long after hostilities end.
a) Economic Pain Arrives Through Refined Products, Not Crude
Economic pain is transmitted through diesel, jet fuel and gasoline, not crude oil itself. Asian refiners face imminent feedstock shortages, forcing run rate cuts despite record margins, while jet fuel prices spike amid thin inventories (see Figure 2). Inflation accelerates, and aviation, logistics, and trade are disrupted before headline crude prices fully reflect scarcity.
Figure 3. Asia Refined Oil Products Prices More Than Double (2024-2025)
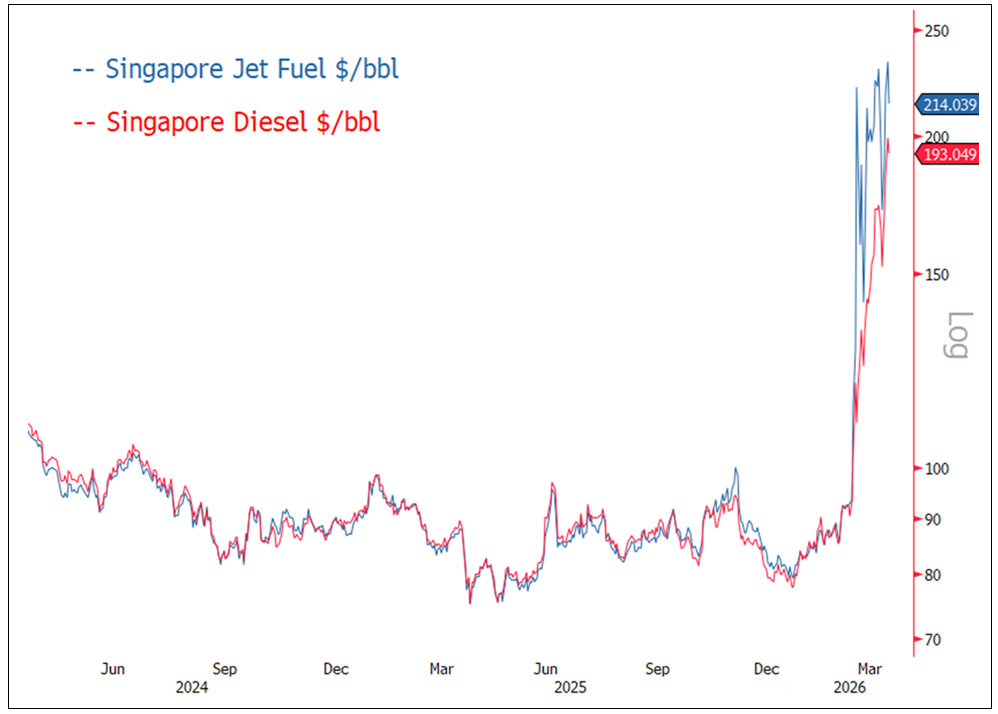
Source: Bloomberg. Data as of 4/5/2026.
b) Qatar's Ras Laffan Removes a Key Global Supply Node
Economic pain is transmitted through diesel, jet fuel and gasoline, not crude oil itself. Asian refiners face imminent feedstock shortages, forcing run rate cuts despite record margins, while jet fuel prices spike amid thin inventories (see Figure 2). Inflation accelerates, and aviation, logistics, and trade are disrupted before headline crude prices fully reflect scarcity.
c) Delayed Supply Becomes Permanent Production Loss
As storage fills and tankers are unable to move, producers are forced to shut in oil and gas wells. Delayed supply becomes outright production loss. An estimated 8-10 million barrels per day are already offline, and restarting these wells is slow and operationally risky. Supply does not snap back even if shipping resumes.
d) Disruption Extends to Semiconductors, Agriculture and Construction
The Gulf is also a major exporter of helium, sulfur, petrochemicals, fertilizers and aluminum. Disruptions propagate into semiconductor manufacturing (helium and sulfuric acid), agriculture (fertilizers) and construction and autos (aluminum), extending inflation and output losses far beyond energy markets.
e) Trade Fragmentation and the Risk of Policy Missteps
Geographic price fragmentation is emerging. Oil stranded west of Hormuz trades at distressed prices, while barrels east of the Strait clear at extreme premiums. Governments typically respond with politically driven export bans and trade restrictions, worsening shortages, undermining refinery economics, and damaging long-term supply chains and security.
f) A Higher Structural Floor for Energy Prices
Even optimistic scenarios imply a higher floor for energy prices due to inventory depletion, infrastructure damage, and especially security risk premia. The result is structurally higher inflation, tighter financial conditions and weaker growth measured in years rather than months.
3. When a Physical Shock Becomes a Financial Crisis
A prolonged Hormuz disruption risks converting an energy shock into a systemic financial crisis. The danger lies not only in higher oil prices but also in the collision between physical scarcity and financial leverage, forcing policymakers to choose between allowing bond markets to malfunction or injecting inflationary liquidity.
a) The Nonlinear Path from Energy Shock to Forced Liquidation
The closure of Hormuz is a non-financial shock that propagates through balance sheets. Energy shortages translate into inflation, FX stress and sovereign funding pressure, triggering forced liquidation.
A plausible transmission sequence, consistent with the COVID-19 pandemic and GFC episodes, is:
Energy shock → inflation / growth shock → sovereign bond stress → credit repricing → forced asset sales → liquidity intervention (QE, or quantitative easing)
This process is nonlinear and prone to abrupt regime shifts rather than gradual repricing. The last comparable sequence occurred in 2020 during the COVID-driven market crisis. If you substitute “Covid shock” for “energy shock” in the above sequence, the pattern is familiar.
4. Asset Class Implications of a Regime Shift
Once the shock from Hormuz moves beyond prices and into balance sheets, asset class performance diverges sharply. Markets do not reprice simultaneously: rates and credit break first, equities lag, FX transmits stress globally and commodities respond to physical scarcity rather than sentiment. The result is a nonlinear regime shift in which liquidity, funding pressure and policy constraint matter more than valuation, growth narratives or traditional diversification.
a) Sovereign Bonds: The Primary Fault Line
Global sovereign bond markets are the core systemic risk. Energy-importing regions, such as the EU, the UK and most of Asia, face rising inflation without the fiscal capacity to absorb higher yields. Many of these sovereigns also hold large quantities of U.S. Treasuries, creating pressure to liquidate. As energy inflation becomes structural, term premia9 and breakeven inflation10 rise, and energy short sovereigns are forced to sell Treasuries to raise USD liquidity. The dynamic increasingly resembles the 2022 UK gilt crisis, but on a global scale and with far less policy flexibility.
b) Credit Markets: The Early Warning Signal
Credit markets are leading equities lower, consistent with past recessionary episodes. High yield and leveraged industrial credits are especially exposed as energy and materials costs compress margins. Emerging market sovereign credit default swaps (CDS) are also widening as FX reserves are depleted to fund dollar-denominated energy imports. Once credit begins to freeze, liquidity dominates.
c) Equities: Lagging but Vulnerable
Equities appear to be mispricing duration risk (sensitivity to structurally higher rates) because earnings have not yet absorbed sustained energy inflation. Buybacks and legacy low-rate assumptions mask fragility as margins erode across industrials, transport, chemicals and consumer cyclicals. Supply chain disruptions are now at risk of spilling over into semiconductors, AI and data center capex, undermining forward growth narratives. Hyperscalers are committing nearly $1.5 trillion in asset-heavy, energy-intensive capital expenditures over the next few years, amid a deepening energy shock.
d) FX: USD Liquidity Demand Amplifies Global Stress
The U.S. dollar initially strengthens as sovereigns, financial institutions and corporates scramble for USD liquidity. USD strength is destabilizing rather than supportive: it worsens energy affordability abroad, accelerates emerging market foreign exchange (EM FX) depreciation, and forces additional sovereign asset sales that feed back into bond markets. Dollar strength becomes a mechanism of contagion, not stability.
e) Commodities and Real Assets: Energy Leads, Industrial Commodities Follow
Energy and industrial commodities reprice first because they are dominated by physical scarcity rather than financial positioning. Shortages in fertilizers, sulfur, metals and chemicals now compound persistent upside pressure in oil, gas and refined products. Commodities serve as both inflation hedges for sovereigns and portfolios and as a source of broader economic stress through persistently higher prices.
f) Gold: Forced Selling Precedes a Structural Reassertion
Short-term weakness in gold reflects forced selling to raise USD liquidity, a pattern that historically precedes sovereign stress. As currency convertibility comes under pressure and bond markets destabilize, liquidity injections (QE) typically follow. Late in the cycle, gold trades from a liquidity source into a monetary anchor.
Part II. Prolonged Hormuz Closure and the Role of Gold
Introduction: Gold in a Physically Constrained System
The ongoing closure of the Strait of Hormuz is the most significant risk currently facing the global financial system. The longer the disruption persists, the more profound the stress on sovereign balance sheets, central bank policy frameworks and global trade settlement. Initial gold weakness reflects liquidity-driven selling. That weakness is temporary. Over time, as energy scarcity constrains policy choices, gold further decouples from rate-based frameworks and reasserts as a core monetary asset.
1. Outside Money in a Constrained Settlement System
If Hormuz remains closed for months, markets are unlikely to experience a conventional risk-off episode. Energy cannot be sourced at scale without universally acceptable settlement assets. Gold emerges as outside money: a neutral, non-liability collateral usable across jurisdictions when currencies and reserves become politically constrained.
2. Early Stress Phase: Gold Disappoints
In the initial phase, energy-importing sovereigns and corporates scramble for USD liquidity, drawing down FX reserves and selling liquid assets. Gold often stalls or sells off because it can be mobilized quickly without destabilizing domestic financial systems. This pattern occurred in 2008 and 2020, when gold fell sharply before rebounding once liquidity was injected.
3. Systemic Stress Phase: Gold Reprices
As the disruption persists, energy inflation becomes structural, sovereign bond markets destabilize and central banks lose the ability to hike without triggering funding crises. At this point, gold stops trading against real rates. Instead, it trades against sovereign credibility, FX reserve adequacy, energy dependency and settlement stress. Gold begins to outperform equities and long-duration bonds, even if the USD remains firm.
4. Policy Resolution: Gold as the Release Valve
Policymakers face a difficult choice: bear the risk of a malfunctioning bond market amid record debt and deficits, or inject liquidity into an inflationary shock, risking even higher inflation. Historically, the second option prevails. Once balance sheets expand into scarcity, gold shifts from an asset to a reference point—a neutral reserve collateral. Repricing can be rapid because marginal settlement demand overwhelms the relatively smaller physical gold market.
5. Settlement Fragmentation and the Emergence of “Petrogold”
A prolonged Hormuz closure changes not just the price of energy, but how it is paid for. Exporters increasingly demand payment that cannot be frozen, while importers accept higher prices in exchange for secure delivery. Settlement fragments. Gold functions as the neutral bridge between non-convertible currencies, often implicitly through swaps and balance-sheet transfers. This evolution matters more than headline oil prices.
Fiscal Dominance Meets Energy Scarcity
The global debt regime has shifted from cyclical stress to structural fragility. Persistent fiscal deficits, high debt to gross domestic product (GDP) ratios, and rising interest expense have entrenched fiscal dominance11. Monetary policy is constrained and recessions are no longer reliably disinflationary but rather are becoming more stagflationary. Energy shocks of this magnitude directly threaten financial stability.
Energy scarcity cascades into food, fertilizers, and industrial output. Sovereigns ultimately face three options: default, inflation or growth—the latter of which is rarely available in an energy shock. Currency-issuing sovereigns overwhelmingly choose inflation and financial repression. In this environment, nominal claims are steadily impaired, and real asset protection becomes structural.
Silver Reprices Sharply but the Fundamental Thesis Holds
For the March month-end, spot silver fell $18.62 per ounce (or -19.85%) to close at $75.17, registering the largest monthly decline since September 2011, the prior peak in silver prices. Silver tracked gold throughout the month as headlines drove sentiment. Silver is consolidating above its 200-day moving average (Figure 4), with the emerging pattern resembling a descending wedge (an exhaustion type pattern). Extreme options positioning is beginning to normalize, implied and realized volatility are falling from +100 readings, the call-to-put skew has fallen to bearish-outlook pricing, and CFTC silver longs have collapsed to near 12-year lows.
Figure 4. Spot Silver Performance (2024-2025)
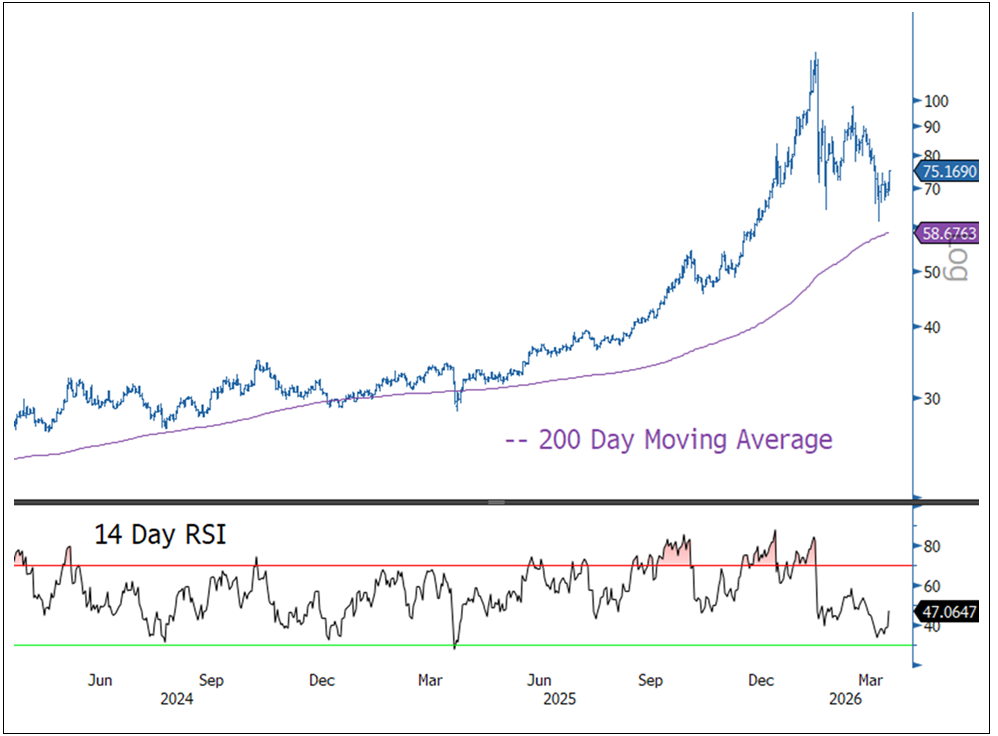
Source: Bloomberg. Silver spot price, $/oz. Data as of 4/5/2026. The 14-day RSI (Relative Strength Index) is a momentum oscillator that measures the speed and magnitude of recent price changes to assess whether an asset is overbought or oversold. It compares the average size of up-days to down-days over the prior 14 sessions and plots the result on a scale of 0 to 100. Past performance is no guarantee of future results.
Silver and Energy Security: Solar Demand in a Supply Constrained World
Geopolitical Chokepoints Accelerate the Solar Build-Out
Tight oil markets, elevated prices, and uncertainty over future supply are likely to drive strong structural demand for silver through accelerated investment in solar photovoltaics. This shift is increasingly driven not just by climate policy, but also by energy security. As hydrocarbons become increasingly exposed to geopolitical chokepoints, conflict risk, and policy weaponization, governments and utilities will likely prioritize domestic, scalable, and insulated energy sources.
Energy insecurity is making silver strategic.
Solar power meets those requirements, and silver remains a critical, largely non-substitutable input in photovoltaic cells due to its unmatched electrical conductivity. While incremental efficiency gains reduce silver loadings7 per panel, rapid growth in installed capacity driven by grid hardening, redundancy, and supply resilience more than offsets those savings. In this context, photovoltaic demand for silver is becoming less cyclical and more structural—driven by energy security imperatives and infrastructure build-out rather than short-term economics.
Past Energy Shocks Have Consistently Catalyzed Renewable Investment
History reinforces this dynamic. Past energy crises have consistently catalyzed investment in renewables as policymakers seek to reduce oil dependence and improve energy security. When energy markets become volatile and supply reliability deteriorates, policy frameworks shift away from cost optimization toward resilience and domestic control. Renewables move from being discretionary or ideological investments to strategic infrastructure. Solar adoption has tended to accelerate following energy shocks because it provides reliable, locally generated power, reducing exposure to external geopolitical supply risks. The current environment already reflects this same pattern: persistently high oil prices and unreliable supply chains are incentivizing front-loaded solar deployment, particularly in energy-importing regions. For silver, this creates a durable, security-driven source of demand, one rooted in the physical requirements of building a more resilient energy system.
Footnotes
| 1 | Gold bullion is measured by the Bloomberg GOLDS Comdty Index. |
| 2 | Silver bullion is measured by the Bloomberg Silver (XAG Curncy) U.S. dollar spot rate. |
| 3 | The NYSE Arca Gold Miners Index (GDM) is a rules-based index designed to measure the performance of highly capitalized companies in the gold mining industry. |
| 4 | The Bloomberg Commodity Index (BCOM) is a broadly diversified commodity price index distributed by Bloomberg Indices. |
| 5 | The U.S. Dollar Index (USDX, DXY, DX) is an index (or measure) of the value of the United States dollar relative to a basket of foreign currencies, often referred to as a basket of U.S. trade partners' currencies. |
| 6 | The S&P 500 or Standard & Poor's 500 Index is a market-capitalization-weighted index of the 500 largest U.S. publicly traded companies. |
| 7 | The simultaneous reduction of both long and short positions by leveraged investors, typically hedge funds, often triggered by margin calls or risk-limit breaches. Distinct from directional selling: de-grossing compresses prices across uncorrelated assets simultaneously. |
| 8 | The mechanism by which falling asset prices tighten financial conditions by reducing the value of collateral pledged against borrowing. As collateral values decline, lenders demand additional margin or reduce credit lines, forcing further asset sales, a self-reinforcing cycle distinct from traditional credit stress |
| 9 | The additional yield investors demand for holding longer-duration bonds rather than rolling over short-term instruments. Rising term premia reflect increased uncertainty about future inflation, fiscal sustainability, or central bank policy. |
| 10 | The difference between the yield on a nominal Treasury bond and the yield on a Treasury Inflation-Protected Security (TIPS) of the same maturity. It represents the market's implied expectation for average inflation over the bond's life; rising breakevens signal that investors expect higher future inflation. |
| 11 | Fiscal dominance is a scenario where high government debt and persistent deficits force the central bank to prioritize financing government spending over controlling inflation. In this state, monetary policy becomes subordinate to fiscal policy, often leading to low interest rates to manage debt costs, which can fuel inflation. |
| 12 | The quantity of silver used per solar photovoltaic panel, typically measured in milligrams per watt of capacity. Silver loadings have declined over time as manufacturers have improved paste formulations and cell architectures, but total silver demand from solar has continued to rise as installed capacity grows faster than efficiency gains reduce per-unit consumption. |


Investment Risks and Important Disclosure
Relative to other sectors, precious metals and natural resources investments have higher headline risk and are more sensitive to changes in economic data, political or regulatory events, and underlying commodity price fluctuations. Risks related to extraction, storage and liquidity should also be considered.
Gold and precious metals are referred to with terms of art like "store of value," "safe haven" and "safe asset." These terms should not be construed to guarantee any form of investment safety. While “safe” assets like gold, Treasuries, money market funds and cash generally do not carry a high risk of loss relative to other asset classes, any asset may lose value, which may involve the complete loss of invested principal.
Past performance is no guarantee of future results. You cannot invest directly in an index. Investments, commentary and opinions are unique and may not be reflective of any other Sprott entity or affiliate. Forward-looking language should not be construed as predictive. While third-party sources are believed to be reliable, Sprott makes no guarantee as to their accuracy or timeliness. This information does not constitute an offer or solicitation and may not be relied upon or considered to be the rendering of tax, legal, accounting or professional advice.