

Key Takeaways
- Record Copper Prices: Copper hit all-time highs as supply disruptions and structural deficits drove strong repricing.
- Tight Inventories: Regional stockpiling and policy uncertainty are tightening supply outside the U.S.
- Supply Shocks: Major mine outages and collapsing treatment charges signal severe upstream stress.
- Strategic Demand: AI, defense and grid modernization are making copper demand more durable.
- Key Catalysts: Section 232 tariff risk and rising M&A activity support a constructive 2026 outlook.
Performance as of December 31, 2025
| Metric | 1 MO* | 3 MO* | 1 YR | 3 YR | 5 YR |
| Copper Spot Price1 | 10.86% | 21.79% | 43.93% | 14.19% | 9.95% |
| Copper Mining Equities (Nasdaq Sprott Copper Miners Index TR)2 | 16.49% | 26.28% | 74.59% | 28.53% | 18.76% |
| Copper Junior Mining Equities (Nasdaq Sprott Junior Copper Miners Index TR)3 | 16.17% | 34.77% | 132.42% | 43.42% | 26.45% |
| Broad Commodities (BCOM Index)4 | -0.65% | 4.84% | 11.07% | -0.93% | 7.04% |
| U.S. Equities (S&P 500 TR Index)5 | 0.06% | 2.65% | 17.88% | 22.98% | 14.42% |
*Performance for periods under one year is not annualized.
Source: Bloomberg as of 12/31/2025. You cannot invest directly in an index. Past performance is no guarantee of future results.
Performance Overview: Copper Price Hits All-Time Highs
Copper is in a powerful breakout, coming off a blockbuster 2025 and pushing deeper into record territory as tight supply and trade-driven dislocation keep the market on a scarcity footing.
Copper rose 43.93% in 2025, capping a strong year that reshaped market expectations for both price and the supply-demand balance. Copper’s strength has carried into early 2026, with the copper price continuing to attain all-time highs, reaching $13,273.81 per metric ton as of this writing. Notably, this is not a typical cyclical upswing. Copper is being repriced amid tightening fundamentals. Major supply disruptions have pushed the market into a deficit sooner than expected, while long-term demand growth continues to outstrip supply, increasing the likelihood of deeper shortages ahead. Copper’s momentum has been further reinforced by the broader strength of hard assets, as deglobalization and de-dollarization are increasing the strategic premium investors assign to essential critical materials like copper.
Copper is breaking records, driven by tight supply, structural market shifts and surging demand.
Copper’s strength is also being reinforced by a structural shift in the mobility of copper inventories. In a more open system, before 2025, exchange stocks and arbitrage help move metal to where it is most needed, smoothing regional imbalances. Today, that mechanism is increasingly constrained by trade frictions and policy uncertainty, which are encouraging stockpiling behavior and redirecting deliverable inventory to specific jurisdictions. This has left U.S. inventories elevated, while availability outside the U.S. is tighter than global headline inventories imply, providing support for the copper market. The result is a copper market where location, deliverability and policy risk can heighten the impact of the traditional supply-demand balance, particularly when the supply chain is already strained, and deficits are developing earlier than many expected. In effect, copper's inventory buffer is behaving more like a set of regional pools than a single global reservoir, which helps explain why tightness can persist even when headline inventories do not look extreme.
Copper miners were the primary beneficiaries of rising copper prices in 2025. Copper miners gained 74.59% and junior copper miners rose 132.42%, underscoring how copper mining equities can deliver operating leverage to a higher copper price. For junior copper miners, the outperformance also reflects a rising probability that projects move from optionality to execution as higher prices improve economics and financing viability. That dynamic has been especially important for U.S.-linked projects, where government actions have increased confidence that domestic copper supply can be accelerated through faster permitting and broader support mechanisms, such as a direct equity stake in one junior developer.
Looking at longer-term performance, copper and copper miners have meaningfully outpaced equities and broader commodity benchmarks, respectively, over the past five years (Figure 1).
Figure 1. Physical Copper and Copper Stocks Have Outperformed Other Asset Classes Over the Past Five Years (12/31/2020-12/31/2025)
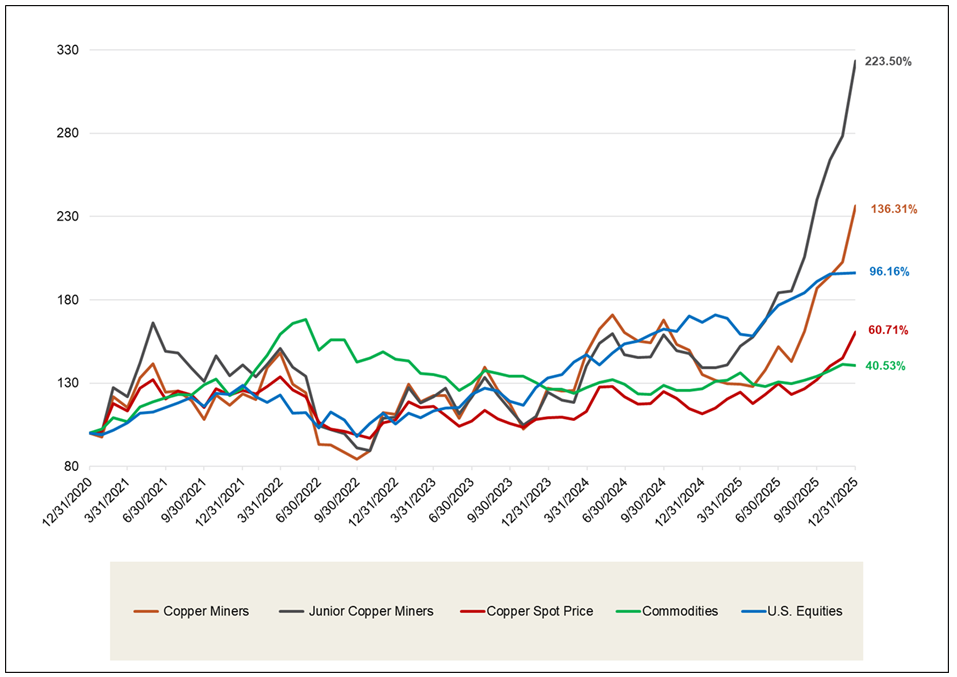
Source: Bloomberg and Sprott Asset Management. Data as of 12/31/2025. Copper Miners are measured by the Nasdaq Sprott Copper Miners™ Index (NSCOPPT index); Junior Copper Miners are measured by the Nasdaq Sprott Junior Copper Miners™ Index (NSCOPJT index); U.S. Equities are measured by the S&P 500 TR Index; the Copper Spot Price is measured by LMCADY Comdty; and Commodities are measured by the Bloomberg Commodity Index (BCOM). Definitions of the indices are provided in the footnotes. You cannot invest directly in an index. Past performance is no guarantee of future results.
Market Drivers
Supply Disruptions Force Market Tightness
Copper’s rally has been driven by an abrupt shift into a supply deficit after a cluster of major disruptions forced the market to reprice faster than expected. The most significant was the September shutdown at Grasberg, where an estimated 800,000 metric tons of mud flooded the mine. Lost output through December 2026 is expected to exceed Collahuasi’s entire annual production, effectively removing the world’s third-largest mine from the market and tightening conditions overnight. The disruption was compounded by a string of setbacks across the industry. The Kamoa-Kakula complex faced flooding-related output cuts estimated at roughly 300 thousand metric tons, Teck revised guidance lower by about 60,000 metric tons across multiple operations, Codelco’s El Teniente reduced expected output by 33 thousand metric tons after an accident, and the ongoing shutdown of Cobre Panama continues to represent a loss of over 300 thousand metric tons of supply.
Major disruptions forced the copper market to reprice faster than expected.
The market impact of these disruptions is amplified by a broader truth about copper: supply reliability has always been fragile. Historically, unplanned outages average about 5% of global supply. In prior years, this could have been absorbed more easily. Today, however, it comes at a time when inventories are fragmented, and the market has less flexibility to balance regional tightness, raising the odds that even incremental disruptions push prices higher. This is why industry-wide constraints matter so much in 2026. Years of underinvestment, long development timelines and declining ore grades have slowed the industry’s ability to respond, leaving the market increasingly exposed when disruptions occur. As a result, the market is more likely to reprice the forward deficit path rather than dismiss disruptions as short-term noise. With demand growing faster than expected and supply relatively flat, the outlook now points to larger deficits ahead (Figure 2).
Figure 2. Copper Supply and Demand Imbalance May Likely Grow
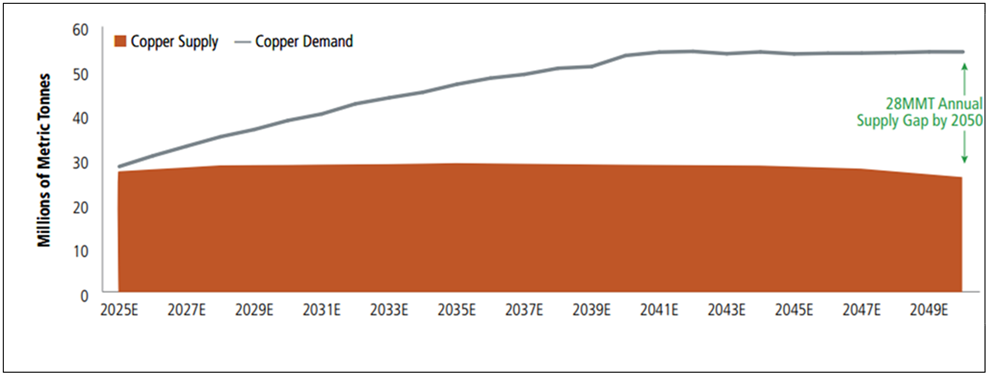
Source: BloombergNEF Transition Metals Outlook 2025. The line represents demand and the shaded area
Treatment Charges Flash Red
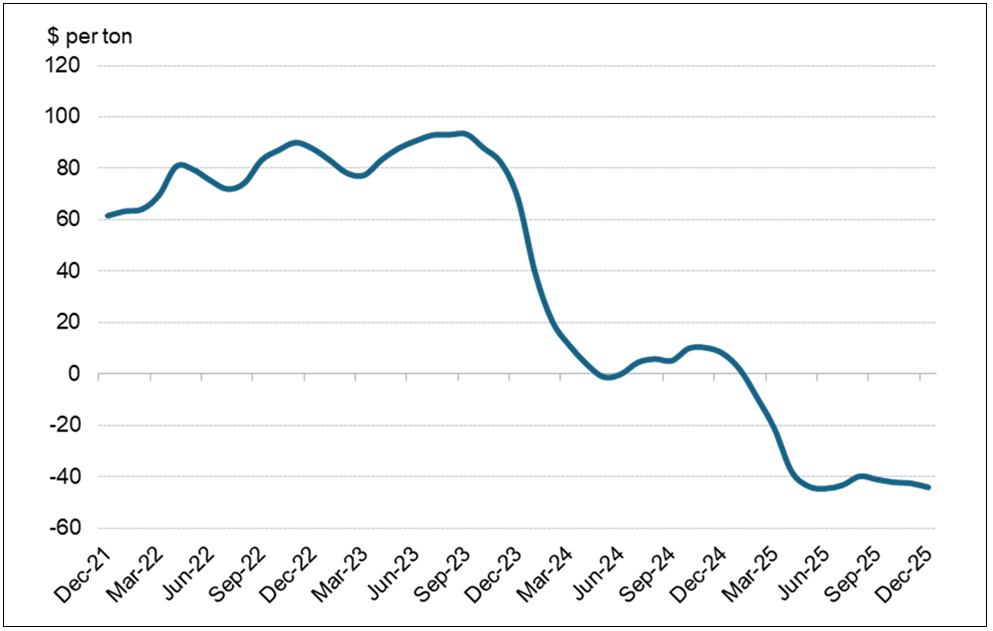
One of the clearest signs of stress in copper right now is the concentrate market, where smelters are increasingly competing for the mined feedstock that becomes refined copper. That competition shows up directly in treatment costs (TCs), the fee smelters earn for processing copper concentrate. There are two prices to watch. The annual TC benchmark is the reference level that anchors many long-term contracts for the year. It reset to $0 for 2026, down from $21.25 in 2025, which was already considered exceptionally low versus historical norms that were often in the $80s.6 The spot TCs are the day-to-day marginal price for concentrate and it has been even more extreme, falling deeper into negative territory and pushing to fresh all-time lows (Figure 3).
These TCs matter because they signal extreme stress and scarcity in mined copper. When TCs collapse, it means concentrate is in short supply relative to processing demand, and the whole chain becomes more vulnerable. In a market already tightening, that kind of upstream stress can ultimately pressure the price of refined copper higher, because the system has less flexibility to absorb disruptions or delays. It can also boost copper miners’ earnings power, as sustained tightness in concentrate typically reflects strong demand for mined copper.
Figure 3. Treatment Costs Are the Canary in Copper’s Supply Chain (2021-2025)
Source: Bloomberg. Data as of 12/31/2025. Includes inventories on the LME, SHFE, and COMEX. Included for illustrative purposes only.
Section 232 Copper Tariff Risk Remains
The July 30, 2025, Section 2327 copper proclamation imposed universal 50% tariffs on semi‑finished copper products and copper‑intensive derivative products, effective August 1, 2025. Contrary to Trump’s initial messaging and the market expectations that followed, it did not result in a tariff on refined copper. That swing, from an almost 50% tariff being priced into refined copper to 0%, created a premium for U.S. copper over the rest of the world that the market had never seen before, and participants raced to ship copper into the U.S. When refined copper was ultimately exempted, that premium fell back toward normal levels. Even so, inventories have remained concentrated in the U.S. (Figure 4), and the administration outlined a clear pathway for introducing refined copper tariffs later. The outcome could have just as profound implications for the copper spot price in 2026.
Section 232 keeps U.S. copper markets on edge, with tariff risk still unresolved.
By June 30, 2026, the U.S. Secretary of Commerce will provide President Trump with an update on domestic copper markets, so that he can determine whether imposing a phased universal import duty on refined copper is warranted. The duty path contemplated is 15% starting January 1, 2027, increasing to 30% starting January 1, 2028.
While the U.S. chose in January 2026 to forgo proposing tariffs on most critical minerals in favor of negotiating critical mineral agreements, copper remains a notable outlier given its separate treatment. Moreover, the legal environment prevents this risk from fading; if the Supreme Court constrains broader tariff strategies, the Trump administration is likely to lean more heavily on Section 232 tariffs. The practical takeaway is that Section 232 risk remains unresolved. It is evolving, and it continues to fragment inventory systems in a copper market already tightened by supply disruptions and concentrate constraints.
Figure 4. Trapped Copper in the U.S. (COMEX) (2015-2025)
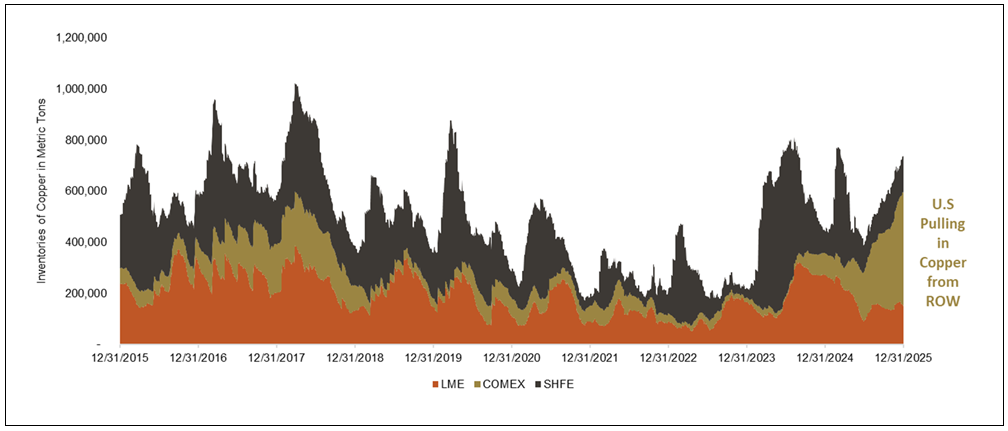
Source: Bloomberg. Data as of 12/31/2025. Includes inventories on the LME, SHFE, and COMEX. Included for illustrative purposes only.
De-Dollarization Buoys Critical Materials and Precious Metals
Copper is increasingly traded as a critical material rather than an economic gauge, as markets place greater weight on policy credibility and de-dollarization. Headlines about a criminal investigation involving Federal Reserve Chair Jerome Powell and the rising political pressure on the Federal Reserve have sharpened concerns about Fed independence, reinforcing de-dollarization dynamics and supporting the broader metals complex. That same backdrop helped underpin broad strength across metals in 2025 (Figure 5), and it remains a credible tailwind into 2026, particularly for critical materials like copper that sit at the intersection of electrification, industrial security and strategic supply-chain priorities.
De-dollarization is supporting copper and critical materials performance.
Rate expectations add another layer. Markets have been focused on the likelihood of lower rates over time, including the potential for a more dovish policy stance as President Trump appoints a successor at the Fed. A lower-rate trajectory is typically supportive for commodities through both financing conditions and currency dynamics, and it can reinforce investor demand for critical materials assets. When that tailwind converges with a market already contending with multiple others, it can keep copper well supported and raise the probability that the upside pressure extends through 2026.
Figure 5. Metals Post Strong Returns in 2025
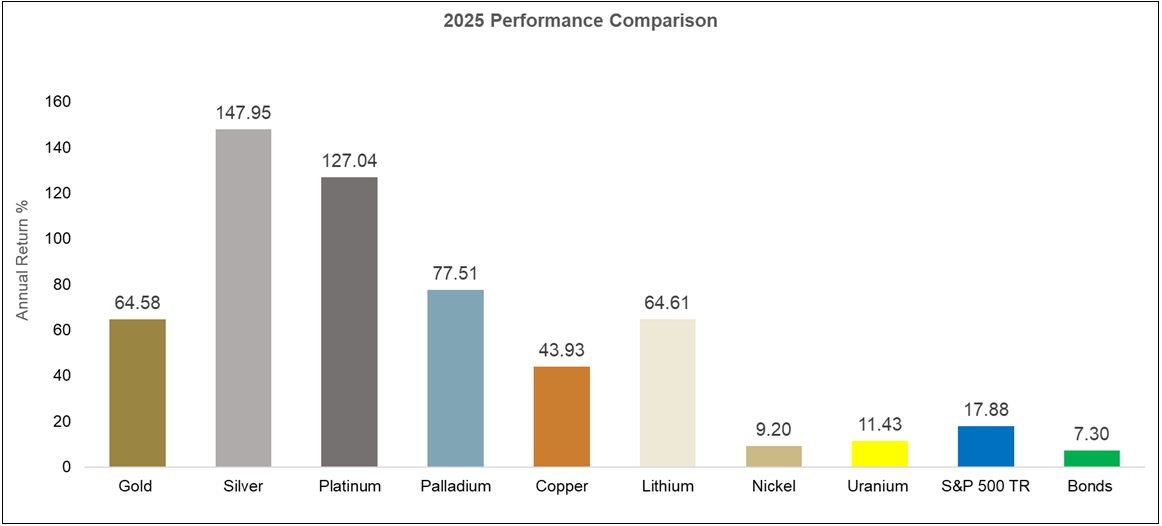
Source: Bloomberg. Data as of 12/31/2025. Gold is measured by the Gold Spot Price; Silver is measured by the Silver Spot Price; Platinum is measured by the Platinum Spot Price; Palladium is measured by the Palladium Spot Price; Copper is measured by the LME Copper Spot Price; Lithium is measured by the China Lithium Carbonate 99.5%; Nickel is measured by the LME Nickel Spot Price; the U3O8 uranium spot price is measured by a proprietary composite of U3O8 spot prices from TradeTech, UxC, S&P Platts and Numerco; the S&P 500 TR is measured by the S&P 500 Total Return Index; Bonds are measured by the Bloomberg Barclays US Agg Total Return Value Unhedged USD (LBUSTRUU Index).
Copper Demand Is Shifting Toward Strategic, Less Price‑Sensitive End Uses
Copper is increasingly being pulled by structural, strategic demand that is less price-sensitive, tied to the buildout of critical infrastructure rather than the traditional industrial cycle. Copper still faces exposure to cyclical segments, including construction-related demand, which can be influenced by China’s property downturn and uneven global growth. The difference today is that the marginal demand driver is steadily shifting toward the world’s most critical sectors, helping copper stay well supported even as parts of the conventional growth picture appear mixed.
This shift was visible in 2025. Despite China’s property slowdown and persistent concerns around global growth, copper still delivered its strongest performance in 16 years, reinforcing that the market is increasingly pricing copper on critical end uses and constrained supply responsiveness rather than on the traditional economic cycle alone. Finally, copper has further evidenced this by decisively outperforming and breaking free of its correlation with Chinese equities since 2021 (Figure 6).
Figure 6. Copper Breaks Away from Chinese Equities (2015-2025)
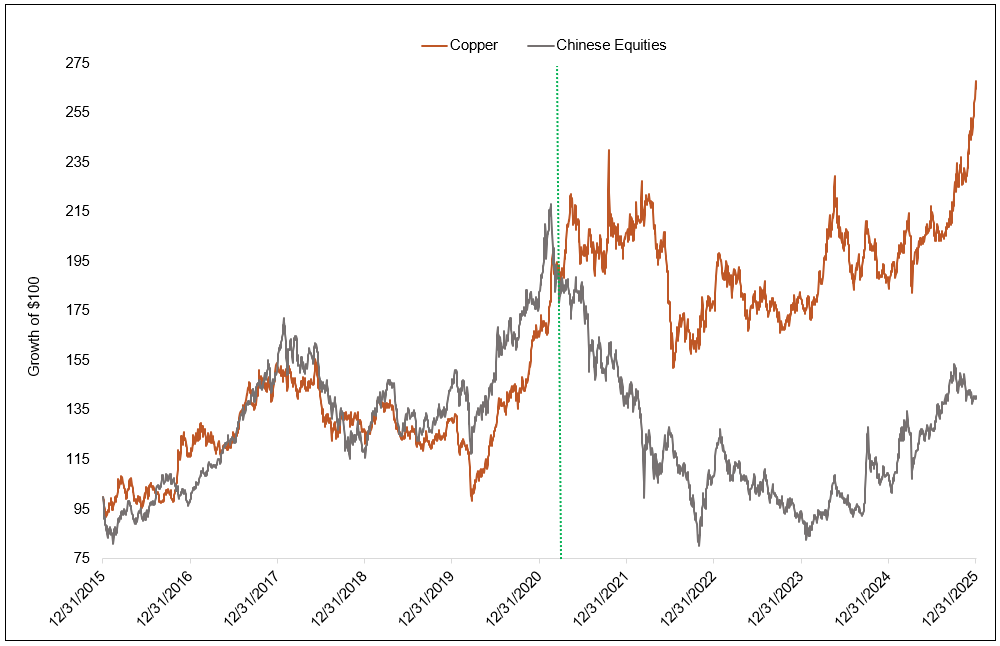
Source: Bloomberg as of 12/31/2025. Chinese equities measured by the MXCN Index. Copper measured by LMCADY Comdty.
Copper’s break from its historical correlation with Chinese equities is clearest in three demand segments that are expanding simultaneously. First, AI and data-center deployments are driving a step-change in electricity consumption, along with the copper-heavy power systems, cooling capacity, and connectivity networks required to support that load. Second, defense spending is building a more persistent layer of demand that is less sensitive to economic cycles and more aligned with national-security priorities. Third, the electricity grid is entering a long-duration modernization cycle, driven by accelerating load growth, aging infrastructure, and heightened reliability concerns.
These shifts have meaningfully reshaped copper’s demand profile. Electrical infrastructure surpassed construction as copper’s leading demand source, rising from 24% of total usage in 2020 to 30% in 2025, with further gains expected (Figure 7). A similar pattern is visible within China itself: construction-linked demand has weakened with the property downturn, yet investment in electrical infrastructure continues to more than offset this, sustaining overall demand growth. Together, these trends are linking copper more directly to strategic procurement across critical industries, supporting a constructive outlook for 2026 and amplifying upward pressure amid tight supply conditions.
Figure 7. Electrical Infrastructure Takes Over Global Copper Demand (2020-2030E)
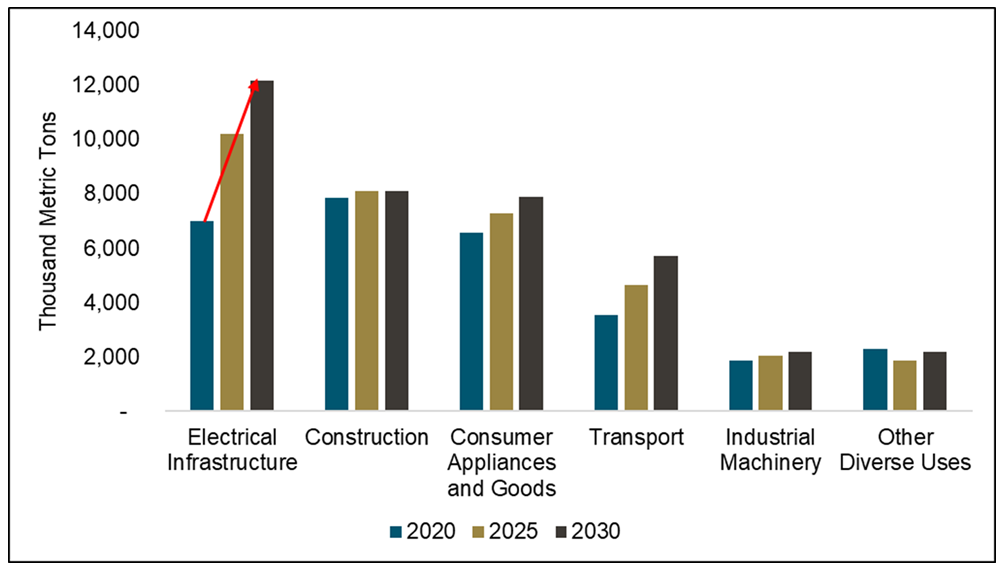
Source: Benchmark Mineral Intelligence, December 2025.
Looking Ahead: Copper’s Critical Catalysts
The copper market enters 2026 with several high-impact catalysts that should keep the outlook constructive. The most significant scheduled milestone is policy-related: under the Section 232 framework, the next key decision date is June 30, 2026, when the U.S. Commerce Secretary is expected to deliver an updated assessment of domestic copper markets.
Constrained supply and essential demand underpin copper’s strength.
Beyond policy, the market remains anchored by a supply chain that has shown how quickly it can tighten when disruptions hit and how slowly it can normalize when baseline supply growth is constrained. The key takeaway for 2026 is that the system continues to operate with limited flexibility, which supports a higher critical premium when participants compete for reliable units.
Copper demand continues to look increasingly durable because the marginal driver is shifting toward critical end uses that are harder to defer. The global push to expand and modernize electricity grids, the buildout of AI-related power infrastructure, and strategic industrial priorities are reinforcing copper’s role in essential systems. That demand mix is supportive in its own right, and it becomes even more powerful when paired with constrained supply responsiveness.
A final catalyst to watch is capital allocation across the mining industry. Mergers and acquisitions have increasingly reflected a strategic pivot toward copper, and the market is now openly entertaining transactions that could rival or exceed prior landmark deals (i.e., confirmed Rio Tinto and Glencore merger talks that would surpass the multibillion-dollar Anglo-Teck merger of 2025). Increased M&A reinforces the premium being placed on long-duration copper exposure and signals that the largest miners are likely to keep orienting portfolios toward copper, which tends to support sentiment across the copper complex.
Taken together, these catalysts leave copper’s move to all-time highs looking well grounded (Figure 8). With policy risk still active, supply responsiveness constrained, strategic demand tailwinds strengthening, and major miners continuing to reorient toward copper, the copper price can remain well supported near record territory through 2026.
Figure 8. Copper Hits All-Time Highs (2000-2025)
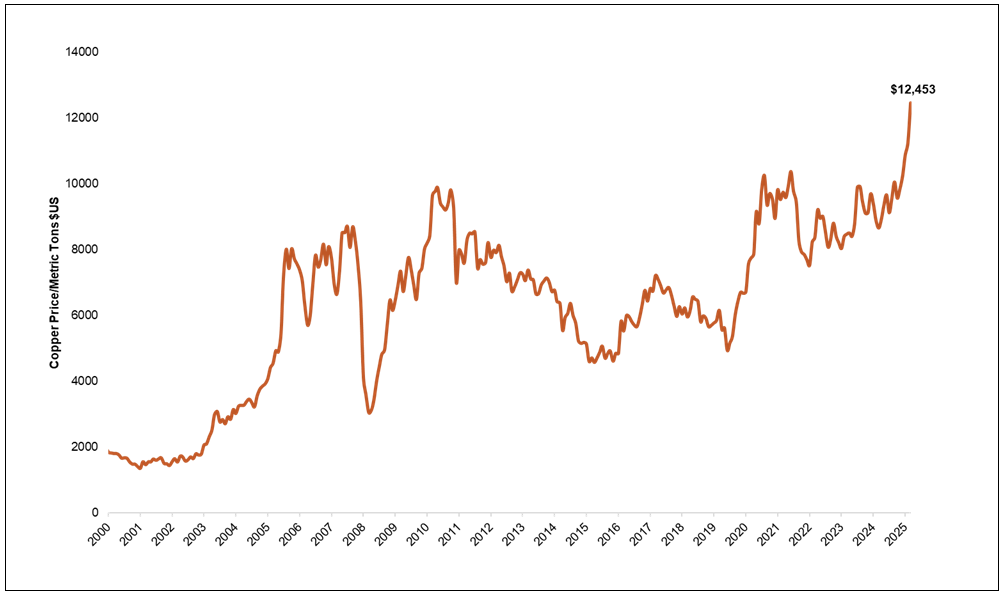
Source: Bloomberg as of 12/31/2025. Copper is measured by LMCADY Comdty. Past performance is not indicative of future results.
Footnotes
| 1 | The copper spot price is measured by the LME Copper Cash ($), Bloomberg ticker LMCADY. |
| 2 | The Nasdaq Sprott Copper Miners™ Index (NSCOPP™) is designed to track the performance of a selection of global securities in the copper industry; the Index was co-developed by Nasdaq® and Sprott Asset Management LP. |
| 3 | Nasdaq Sprott Junior Copper Miners™ Index (NSCOPJ™) is designed to track the performance of mid-, small- and micro-cap companies in copper-mining related businesses; the Index was co-developed by Nasdaq® and Sprott Asset Management LP. |
| 4 | The Bloomberg Commodity Index (BCOM) is a broadly diversified commodity price index that tracks prices of futures contracts on physical commodities and is designed to minimize concentration in any one commodity or sector. It currently has 23 commodity futures in six sectors. |
| 5 | The S&P 500 or Standard & Poor's 500 Index is a market-capitalization-weighted index of the 500 largest U.S. publicly traded companies. |
| 6 | Source: Benchmark, Chinese smelter reportedly agrees to record low copper concentrate TC/RCs. |
| 7 | Section 232 refers to a provision in the Trade Expansion Act of 1962 that allows the U.S. President to impose tariffs or other trade restrictions on imported goods if the Secretary of Commerce finds they threaten national security, initiating investigations into product imports. |


Investment Risks and Important Disclosure
Relative to other sectors, precious metals and natural resources investments have higher headline risk and are more sensitive to changes in economic data, political or regulatory events, and underlying commodity price fluctuations. Risks related to extraction, storage and liquidity should also be considered.
Gold and precious metals are referred to with terms of art like "store of value," "safe haven" and "safe asset." These terms should not be construed to guarantee any form of investment safety. While “safe” assets like gold, Treasuries, money market funds and cash generally do not carry a high risk of loss relative to other asset classes, any asset may lose value, which may involve the complete loss of invested principal.
Past performance is no guarantee of future results. You cannot invest directly in an index. Investments, commentary and opinions are unique and may not be reflective of any other Sprott entity or affiliate. Forward-looking language should not be construed as predictive. While third-party sources are believed to be reliable, Sprott makes no guarantee as to their accuracy or timeliness. This information does not constitute an offer or solicitation and may not be relied upon or considered to be the rendering of tax, legal, accounting or professional advice.