

Key Takeaways
- Copper Rallies to Resistance: Copper prices rose in May, nearly reaching US$10,000 per metric ton.
- Exchange Inventories Plunge: Scarce copper inventories are limiting the industry's buffer for demand shocks.
- Smelter Margins Collapse: Spot treatment charges plunge further into negative territory, highlighting the scarcity of mined copper and strengthening the investment case for copper miners.
- Macro Sentiment Improves: Easing trade tensions, especially temporary tariff relief between the U.S. & China, helped to support higher copper prices.
- Structural Support Remains: Copper’s strategic importance, surging energy demands and limited supply leave an escalating supply-demand imbalance.
Performance as of May 31, 2025
Average Annual Total Returns*
| Indicator | 1 MO* | 3 MO* | YTD* | 1 YR | 3 YR | 5 YR |
| Copper Price (COMEX Futures)1 | 2.58% | 3.61% | 16.17% | 1.64% | 0.85% | 14.04% |
| Copper Price (LME Spot)2 | 4.71% | 2.25% | 10.35% | -3.68% | 0.36% | 12.27% |
| Copper Mining Equities (Nasdaq Sprott Copper Miners Index TR)3 | 7.76% | 6.33% | 1.83% | -19.35% | 3.46% | 23.69% |
| Copper Junior Mining Equities (Nasdaq Sprott Junior Copper Miners Index TR)4 | 6.39% | 18.91% | 20.47% | 4.89% | 7.71% | N/A |
| Broad Commodities (BCOM Index)5 | -0.93% | -2.69% | 1.24% | -2.92% | -8.69% | 9.49% |
| U.S. Equities (S&P 500 TR Index)6 | 6.29% | -0.37% | 1.06% | 13.52% | 14.41% | 15.94% |
*Performance for periods under one year is not annualized.
Source: Bloomberg as of 05/31/2025. You cannot invest directly in an index. Past performance is no guarantee of future results.
Performance Overview: Copper Market Gains Momentum
Copper rallied 4.71% in May, building on April’s recovery, putting the metal within striking distance of the psychologically important $10,000 per metric ton mark. Copper miners magnified the move, climbing 7.76%, while junior copper miners gained 6.39%.
Year-to-date gains as of May 31 look robust across the copper complex. Copper spot is up 10.35% and in the U.S., copper has risen 16.17% YTD, leaving the U.S. trading at an 11% premium to the copper price on the LME (generally referenced as a more international benchmark). For perspective, the five-year average premium is 0.5% and last year’s short-squeeze peak reached only 8%. The current spread reflects positioning ahead of the Section 2327 national security review for copper. This national security review is the same one used to impose the current 50% duties on steel and aluminum, and the spread reflects the risk that a similar tariff on copper would lock U.S. prices at a structurally higher level, tighten supply worldwide and reprice miners with U.S. exposure.
Electrification is the dominant force fueling U.S. copper demand in 2025, while construction and manufacturing remain critical.
Copper has remained resilient due to strong fundamentals despite concerns over global trade, growth, inflation and China’s weaker economic performance. The physical tightness of the copper market is reflected by price resilience, record-low treatment charges (the fees smelters charge to process copper concentrate8 into refined copper), premiums for immediate delivery (backwardation), rising Chinese copper premiums and rapidly declining inventories. In our view, improving fundamentals, supportive technicals and easing trade tensions may collectively catalyze copper to move above key resistance levels.
Looking at longer-term performance, copper and copper miners have meaningfully outpaced equities and broader commodity benchmarks over the past five years (see Figure 1).
Figure 1. Physical Copper and Copper Stocks Have Outperformed Other Asset Classes Over the Past Five Years (5/31/2020-5/31/2025)

Source: Bloomberg and Sprott Asset Management. Data as of 05/31/2025. Copper Miners are measured by the Nasdaq Sprott Copper Miners™ Index (NSCOPPT index); U.S. Equities are measured by the S&P 500 TR Index; the Copper Spot Price is measured by LMCADY Comdty; and Commodities are measured by the Bloomberg Commodity Index (BCOM). Definitions of the indices are provided in the footnotes. You cannot invest directly in an index. Past performance is no guarantee of future results.
Copper Market Drivers
Visible Copper Supply Vanishes, Highlighting Supply Stress
Global exchange copper inventories have plunged 44% since late February, signaling a sharp tightening in supply (see Figure 2). The steepest drawdowns have come from the Shanghai Futures Exchange (SHFE) and London Metal Exchange (LME), where copper has exited warehouses at a rapid pace. This marks a stark reversal from early to mid-2024, when rising inventories weighed on prices and stalled the rally.
Exchange stocks of copper are the official, transparent inventories stored in major exchange warehouses, and are a closely watched indicator in the industry because they can act as the market’s buffer to any sudden demand requirements. Total visible copper inventories have precipitously declined to cover only six days of global copper demand, versus a long-term average of 12 days. Normally, these inventories are small compared to the world’s annual demand and are usually enough to help smooth short-term mismatches between supply and demand. With this supply cushion rapidly eroding, any modest shock may instigate price-driven rationing to balance the market.
China is investing heavily in grids, renewable energy, electronics and EVs—all of which require significant copper.
The tight copper market is already showing signs of stress. On the London Metal Exchange (LME), prices have shifted into persistent backwardation, where copper for immediate delivery costs more than for future delivery. This pricing pattern typically discourages stockpiling and encourages sellers to release material into the market. But even with that pressure, supply remains tight—a setup that has historically preceded sharp price spikes or short squeezes.
In China, the Yangshan import premium reinforces the story from the demand side. The surcharge Chinese buyers pay over LME prices jumped to a two-year high—exceeding US$100 per tonne in May—highlighting strong appetite for refined copper, particularly for grid expansion and infrastructure. When deep backwardation is paired with a surging import premium, it’s a classic signal of genuine global tightness. In such conditions, prices may need to break above the US$10,000 per metric ton mark to unlock new supply and restore market balance.
Figure 2. Copper Inventories Plummet (2015-2025)

Source: Bloomberg. Data as of 6/24/2025. Includes inventories on the LME, SHFE and COMEX.
Tariff Relief Fuels Sentiment Recovery
After April’s tariff shock, copper markets caught a reprieve in May as the U.S. and China announced a coordinated de-escalation of trade tensions. In May, both countries agreed to reduce tariffs by 115% each, bringing average rates down to 30% for U.S. imports and 10% for Chinese goods, while pausing any new measures for 90 days.9 This gave momentum to the copper markets, reigniting hopes for a more stable global trade backdrop.
May’s trade détente eased macro pressures, allowing copper to reprice on long-term electrification trends.
The tariff rollback matters for copper on multiple levels. First, it eases pressure on global manufacturing and export activity, both critical copper consumers. Second, it signals that both governments seek a workable compromise, reducing tail risk for commodity markets.10 Third, lower trade frictions mean firmer global growth prospects and a gentler inflation outlook, conditions that typically boost copper demand. While the tariffs are reduced only for 90 days, the immediate effect was a surge in risk appetite. Copper miners and juniors rallied, and equities generally rebounded.
To be clear, tariffs remain structurally higher than before Trump’s inauguration, and structural decoupling is still underway in certain sectors. However, the May détente reduced headline risk and allowed copper to showcase its decreasing reliance on global trade and economic growth in favor of structural demand increases via increasing electrification demand from data centers, emerging economies and copper-intensive technologies.
Physical Market Hit by Unexpected Supply Interruptions
Production disruptions in May added to the tightening copper backdrop, reinforcing the fragility of global supply. Most notably, Ivanhoe Mines was forced to suspend operations at the Kakula mine in the Democratic Republic of Congo following seismic activity that caused flooding.11 Although production later resumed, the company cut its 2025 output guidance for the Kamoa-Kakula complex from 520–580 kilotonnes to 370–420 kilotonnes, a substantial downward revision for one of the world’s most prominent copper mines.12
The event underscores a broader theme: the market has little cushion left to absorb the frequent supply disruptions in the copper industry. Copper supply disruptions have been frequent and can typically represent 5% of copper mine production (3.9% in 2024). As inventories plummet, each disruption exerts an outsized influence on sentiment and price expectations. The Kakula cut was one of several supply-side stressors in recent months that are steadily eroding the already thin margin between copper production and consumption.
Falling copper inventories magnify the impact of every supply disruption.
Compounding the issue is the growing complexity of bringing new copper production online. Delays to major mining projects are increasingly common, often tied to permitting, logistics or financing hurdles. Long lead times hamper the supply response, as it takes on average 17 years to move from discovery to first production, over double the 7 years it took in the 1990s.13 This includes 12.2 years for exploration, permitting and financing, 2.6 years for waiting time after feasibility studies and 2.3 years from construction to production. Meanwhile, the project deferrals and capital discipline seen across the mining sector over the last cycle continue to constrain the supply pipeline.
In this context, May’s disruptions were more than isolated setbacks—they underscored the geographic concentration and growing fragility of the copper supply chain. With physical availability already tight, even minor incidents can quickly shift market sentiment and magnify upside risk, especially if demand continues to strengthen.
Negative TCs Signal Scarcity and Boost the Case for Copper Miners
Spot treatment charges (TCs) for copper concentrate have dropped to record lows, even turning negative (see Figure 3). This means smelters—which usually charge miners to process copper—are now paying miners to secure raw material. While smelters can still be profitable by earning other revenue through byproduct metals like gold and silver, this reversal is highly unusual. The last time TCs came close to zero was during the 2020 COVID-19 supply shock—true negative TCs were almost unheard of until the past year and a half.
TCs are the industry’s barometer for raw material availability. When copper concentrate is plentiful, miners compete to place tonnage and offer higher fees. When copper concentrate is scarce, the fee sinks. A move below zero signals a shortage of concentrate and smelter overcapacity, as smelters are effectively subsidizing miners.
Large state-owned smelters in China are still running at high rates, as China prioritizes critical material output and stability, but smaller and mid-size operators have begun curtailing because negative TCs wipe out margins. With little fresh copper concentrate coming online, mined copper looks set to remain the bottleneck, potentially increasing the value of copper miners. Historically, periods of negative or near-zero TCs coincide with tightening refined-metal balances and rising prices.
Figure 3. Copper Treatment Charges Plunge to New Record Low (2022-2025)
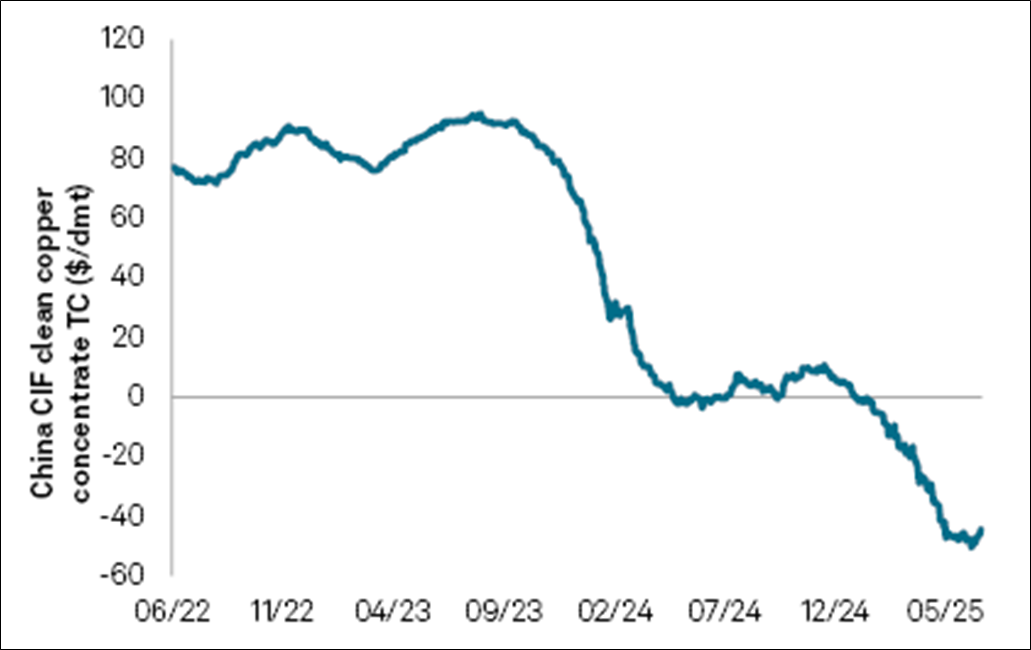
Source: S&P Global Commodity Insights. Data as of 6/20/2025. Dmt = dry metric ton. TC = treatment charge.
Looking Ahead
Copper enters the second half of 2025 with strong momentum and mounting pressure. Prices are within striking distance of the key resistance level of US$10,000 per metric ton threshold (see Figure 4). With physical market tightness now acute, another catalyst may initiate a breakthrough.
Policy clarity may be imminent, with the U.S. Section 232 investigation into copper imports looming large. If tariffs are implemented, it would mark a structural change in copper trade, reinforcing the U.S. price premium and shifting global flows.
Given the heightened policy and macro uncertainty currently driving copper markets, it’s essential to separate the short-term dislocations from the underlying fundamentals supporting copper’s long-term investment case. While recent price action has been shaped by tariff speculation, the copper market sits atop a deeper story of constrained supply and accelerating structural demand.
The growing investments in electrical grids, the rapid buildout of AI data centers, the urbanization and industrialization of emerging economies, and the energy transition all point to a sustained increase in copper demand. At the same time, copper supply remains increasingly difficult to grow, with long lead times, falling copper ore grades, declining major copper discoveries and frequent supply disruptions.
An important dynamic that may fuel this further is the emergence of “trapped copper,” metal imported into the U.S. ahead of anticipated tariffs, but not immediately consumed. This copper is often held in warehouses or tied up in collateralized financing agreements, and due to high U.S. premiums, is uneconomical to export back to global markets. In effect, it could become stranded within the U.S., unavailable to buyers in the rest of the world. This may distort physical flows, forcing Shanghai and London to compete for a shrinking pool of free-floating copper.
Figure 4. Copper Nears US$10,000 per Metric Ton (2000-2025)

Source: Bloomberg as of 6/24/2025. The copper spot price is measured by the LME Copper Cash ($), Bloomberg ticker LMCADY. You cannot invest directly in an index. Past performance is no guarantee of future results.
Please Note: "Bullish" reflects that expectation that prices will continue to rise.
Footnotes
| 1 | The COMEX copper futures are measured by the front-month (HG1) standardized contract on the CME. Source: Bloomberg ticker HG1. |
| 2 | The copper spot price is measured by the LME Copper Cash ($). Source Bloomberg ticker LMCADY. |
| 3 | The Nasdaq Sprott Copper Miners™ Index (NSCOPP™) is designed to track the performance of a selection of global securities in the copper industry; the Index was co-developed by Nasdaq® and Sprott Asset Management LP. |
| 4 | Nasdaq Sprott Junior Copper Miners™ Index (NSCOPJ™) is designed to track the performance of mid-, small- and micro-cap companies in copper-mining related businesses; the Index was co-developed by Nasdaq® and Sprott Asset Management LP. |
| 5 | The Bloomberg Commodity Index (BCOM) is a broadly diversified commodity price index that tracks prices of futures contracts on physical commodities and is designed to minimize concentration in any one commodity or sector. It currently has 23 commodity futures in six sectors. |
| 6 | The S&P 500 or Standard & Poor's 500 Index is a market-capitalization-weighted index of the 500 largest U.S. publicly traded companies. |
| 7 | A Section 232 national security review for copper refers to an investigation by the U.S. Department of Commerce under Section 232 of the Trade Expansion Act of 1962 to determine whether imports of copper threaten national security. |
| 8 | Copper concentrate is made by crushing, grinding and floating copper ore to isolate and concentrate the copper minerals. It’s an intermediate product that must be refined at a smelter to become usable metal. |
| 9 | Source: CNNBusiness.com, US and China agree to drastically roll back tariffs in major trade breakthrough, May 12, 2025. |
| 10 | In commodity markets, "tail risk" refers to the risk of rare but extreme price moves—either sharp spikes or crashes—that fall in the "tails" of a probability distribution. |
| 11 | Source: Ivanhoe Mines, Underground Mining Activities at Kakula Mine Suspended; Remediation Work Continues in Western Section of Kakula, May 26, 2025. |
| 12 | Source: Mining.com, Ivanhoe slashes 2025 copper guidance by 28% following DRC mine restart, June 11, 2025. |
| 13 | From 6 years to 18 years: The increasing trend of mine lead times, S&P Global. April 3, 2025. |


Investment Risks and Important Disclosure
Relative to other sectors, precious metals and natural resources investments have higher headline risk and are more sensitive to changes in economic data, political or regulatory events, and underlying commodity price fluctuations. Risks related to extraction, storage and liquidity should also be considered.
Gold and precious metals are referred to with terms of art like "store of value," "safe haven" and "safe asset." These terms should not be construed to guarantee any form of investment safety. While “safe” assets like gold, Treasuries, money market funds and cash generally do not carry a high risk of loss relative to other asset classes, any asset may lose value, which may involve the complete loss of invested principal.
Past performance is no guarantee of future results. You cannot invest directly in an index. Investments, commentary and opinions are unique and may not be reflective of any other Sprott entity or affiliate. Forward-looking language should not be construed as predictive. While third-party sources are believed to be reliable, Sprott makes no guarantee as to their accuracy or timeliness. This information does not constitute an offer or solicitation and may not be relied upon or considered to be the rendering of tax, legal, accounting or professional advice.