

Key Takeaways
- Gold Breakout: Gold, up 31% year-to-date through August, looks to be breaking out from a months-long consolidation phase. Since closing the month at $3,347.95 per ounce, gold has topped another all-time high, rising above $3,600 per ounce.
- Stagflation Risks: Financial markets are signaling stagflationary fears as the Trump administration continues to attack the autonomy of the U.S. Federal Reserve and elevated tariffs (and tariff uncertainty) work their way through the U.S. economy.
- Policy-Driven Inflation: As the long end of the Treasury curve softens and the U.S. dollar remains weak, there is a growing risk that inflation will be driven not by demand but by monetary and fiscal policy, which is bullish for gold.
- Silver Momentum: Silver has surged 37% YTD through August to its highest price since 2011. Silver’s bull case is accelerating, fueled by record YTD gains, a structural supply deficit, shrinking inventories, tariff-driven dislocations and growing ETF demand.
Performance as of August 31, 2025
| Indicator | 8/31/2025 | 7/31/2025 | Change | Mo % Chg | YTD % Chg | Analysis |
| Gold Bullion1 | $3,447.95 | $3,289.93 | $158.02 | 4.80% | 31.38% | All-time high monthly close. |
| Silver Bullion2 | $39.72 | $36.71 | $3.01 | 8.19% | 37.43% | Highest monthly close since August 2011. |
| NYSE Arca Gold Miners (GDM)3 | 1,764.03 | 1,450.11 | 313.92 | 21.65% | 84.41% | All-time high monthly close. |
| Bloomberg Comdty (BCOM Index)4 | 102.79 | 101.18 | 1.60 | 1.58% | 4.08% | Rangebound since mid-2023. |
| DXY U.S. Dollar Index5 | 97.77 | 99.97 | (2.20) | -2.20% | -9.88% | Unable to rally, downtrend resuming. |
| S&P 500 Index6 | 6,460.26 | 6,339.39 | 120.87 | 1.91% | 9.84% | Fourth straight up month, all-time high close. |
| U.S. Treasury Index | $2,392.78 | $2,367.79 | $24.99 | 1.06% | 4.48% | Best year-to-date performance since 2020. |
| U.S. Treasury 10 YR Yield* | 4.23 | 4.37 | (0.15) | -15 BPS | -34 BPS | Year-to-date, mostly rangebound. |
| Silver ETFs** (Total Known Holdings ETSITOTL Index Bloomberg) | 806.00 | 789.15 | 16.85 | 2.14% | 12.54% | Best year-to-date performance since 2020. |
| Gold ETFs** (Total Known Holdings ETFGTOTL Index Bloomberg) | 93.28 | 91.72 | 1.56 | 1.70% | 11.86% | Best year-to-date performance since 2020. |
Source: Bloomberg and Sprott Asset Management LP. Data as of August 31, 2025.
* BPS stands for basis points. **ETF holdings are measured by Bloomberg Indices; the ETFGTOTL is the Bloomberg Total Known ETF Holdings of Gold Index; the ETSITOTL is the Bloomberg Total Known ETF Holdings of Silver Index.
Gold Market: Stress-Driven Gains
In August, spot gold increased $158.02 per ounce (or 4.80%) to close the month at $3,347.95, an all-time closing high. Spot gold was up 31.38% year-to-date at the end of August, its best year-to-date performance since 1979. Gold is well on its way to being one of the strongest-performing asset classes for another year. After a sharp rise into April's tumultuous tariff-driven market stress, gold went into a time correction pattern (see Figure 1) as risk assets rallied, but gold holders held onto their positions. With equity positioning now reaching the upper end of likely allocations, in our view, and risk headlines building, gold has broken out of its consolidation range. The technical chart pattern can be viewed as a bullish7 flag breakout, a pattern that typically sees a sharp rise.
Gold is well on its way to being one of the strongest-performing asset classes for another year.
Over the summer, the U.S. Federal Reserve shifted from a holding pattern on interest rates to easing. Political pressure from the Trump administration has led to one Fed board governor's resignation and another's firing on allegations of fraud (although there are legal challenges to the firing). The erosion of Fed autonomy and a surge in tariffs have heightened stagflation8 risks and amplified market uncertainty.
Tariffs have surged to levels not seen in over a century, with broad-based levies now estimated to be well above 15% and rising. While the extreme risks of an all-out trade war or embargoes have receded, the stagflationary consequences are becoming more apparent. Tariff pass-through is evident in rising producer prices and constrained consumer spending, contributing to sticky inflation even as economic growth slows. The Fed has signaled that it will likely cut interest rates at the September meeting of the Federal Open Market Committee (FOMC).
Labor market data has also signaled a slowdown as July nonfarm payrolls were heavily revised downward, and participation rates declined. Inflation data was mixed. The July CPI (Consumer Price Index) remained tame, but the PPI (Producer Price Index) surged, revealing pipeline pressures that could feed into future price increases. Financial markets are reflecting these pressures. The long end of the Treasury curve is weakening, and the U.S. dollar remains soft and has failed to mount a sustained rally. These developments underscore the growing risk that inflation will be driven not by demand but by monetary and fiscal policy, which is positive for gold.
Figure 1. Gold Looks to Break Out (2024-2025)
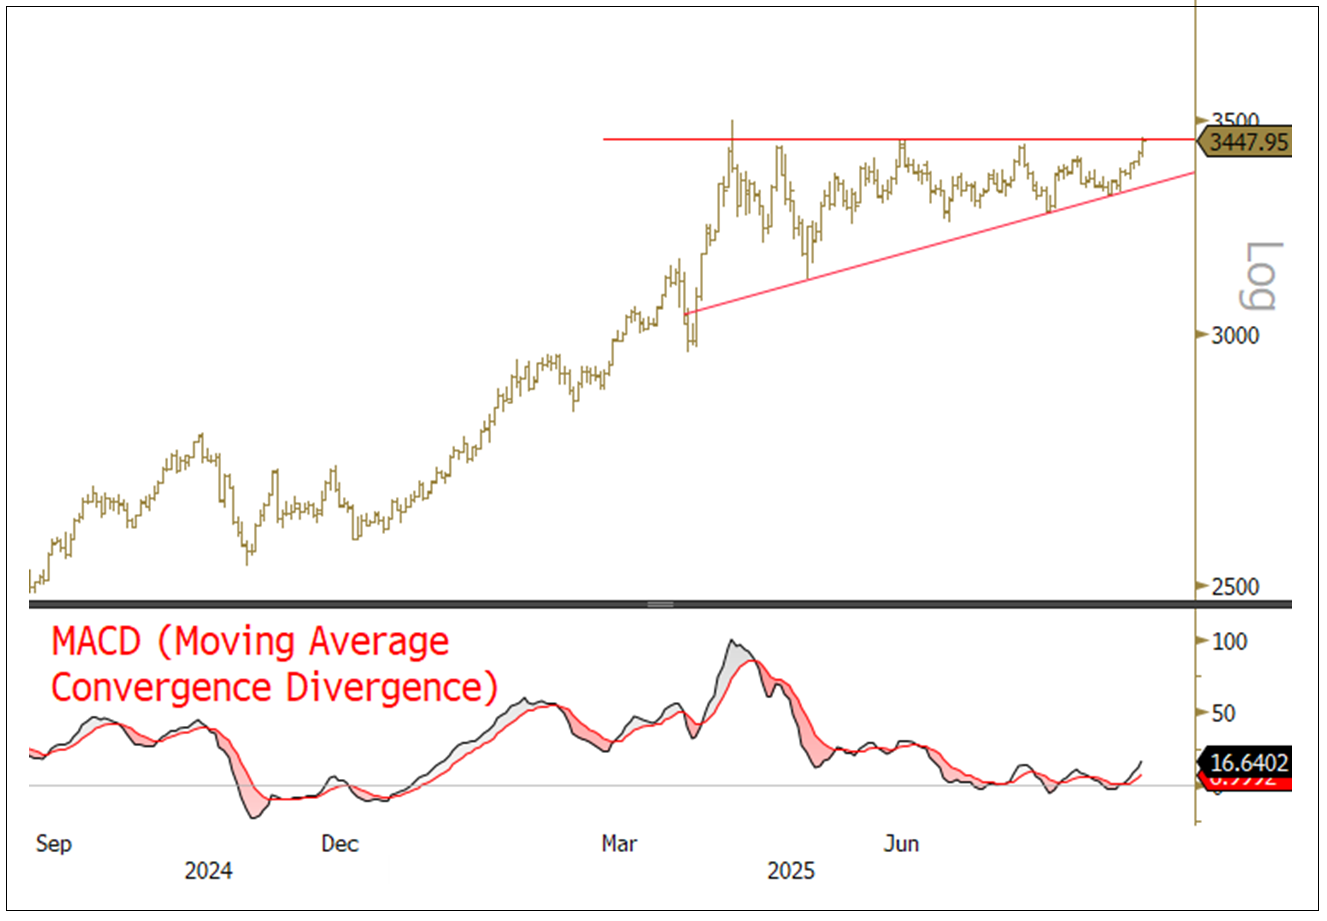
Source: Bloomberg. Gold bullion spot price, U.S. dollar/oz. Data as of 8/31/2025. Moving average convergence/divergence is a trend-following momentum indicator that shows the relationship between two exponential moving averages.
Battle for the U.S. Federal Reserve
President Trump’s plan to fire Fed Governor Lisa Cook on grounds of mortgage fraud raises unprecedented legal and constitutional questions about presidential authority and central bank independence. Markets have reacted with higher gold prices, a weaker U.S. dollar and a steeper yield curve, signaling elevated risk. Overall reaction so far is relatively muted since this process is very early in its development.
A president has not removed a member of the Federal Reserve Board of Governors since 1913. The Federal Reserve Act allows removal only “for cause,” historically limited to inefficiency, neglect of duty or malfeasance in office, not private misconduct predating service. Allegations of mortgage fraud tied to loans made before Lisa Cook was appointed to the board appear to lack evidence of intent or formal investigation, making them questionable grounds. Cook’s lawyers have sought a federal injunction for her reinstatement.
While a recent Supreme Court ruling expanded presidential removal power for other agencies, it provided a carve-out that the Fed may be an exception. The White House appears to be manufacturing “cause,” potentially forcing the Court to clarify the law. Beyond interest rates, White House control of the Fed’s balance sheet could enable monetary expansion without Congress, aligning with the administration's push for easy credit and deregulation, policies that risk bubbles, over-leverage and an inflationary boom-bust cycle.
The White House has no direct vote in setting interest rates, but by shaping the Board of Governors and influencing Reserve Bank leadership through approvals, it can gradually steer the Fed’s direction.
The Federal Reserve was built to operate independently of short-term politics. However, its structure still leaves room for political influence through appointments, approvals and leadership designations, especially during key reappointment cycles.
The Federal Reserve's governing structure distributes power between its national Board of Governors and 12 regional Reserve Banks, making it harder for politics to dominate monetary policy. The Board of Governors has seven members, each serving staggered 14-year terms. These governors are nominated by the President and confirmed by the Senate. They include a Chair and Vice Chair, each serving a four-year leadership term. Gaining control of the Board of Governors through appointments and leadership designations is the White House’s most direct lever of influence.
The regional Reserve Banks have their own boards, and the Board of Governors appoints the Class C directors and designates each bank's Chair and Deputy Chair. These directors, along with Class B directors, select the Reserve Bank presidents, but every appointment or reappointment requires Board approval. Reserve Bank presidents serve five-year terms that all end in February of each year ending in “1” or “6,” creating synchronized review points. The New York Fed presidency is especially important because this role is a permanent voting member of the FOMC and oversees market operations.
The FOMC sets interest rates and balance sheet policy and has 12 voting members: up to seven governors, the New York Fed president and four rotating regional presidents. The White House has no direct vote in this process, but it can gradually steer the Fed's direction by shaping the Board of Governors and influencing Reserve Bank leadership through approvals. This influence becomes more significant during primary reappointment cycles, such as the one coming in February 2026.
Raising the Autonomy Stakes
The fight for control of the Federal Reserve is about more than interest rate cuts; it is a strategy to secure a Board majority and influence the FOMC well beyond 2025. Stephen Miran, Chair of the Council of Economic Advisers, has been nominated to replace Adriana Kugler, and two current Board members, Christopher Waller and Michelle Bowman, are considered already aligned with Trump. So, removing Lisa Cook could create a 4–3 Board majority. Waller and Bowman cast dissenting votes for a cut in July, the first dual dissent in decades, which shows how Board Chairman Jay Powell’s flexibility is narrowing. If Cook’s removal stands, it sets a precedent for future dismissals, raising the stakes for Fed independence.
A politicized Fed risks turning the world’s most powerful central bank into a White House lever.
The Fed is one of the most powerful institutions in the U.S. It sets interest rates, manages a $6.6 trillion balance sheet and controls bank regulation. These tools can accelerate credit, allocate risk and even bypass Congressional appropriations through monetary expansion. A White House seeking an economic boom could use these levers to push easy credit, deregulation and liquidity—policies that risk causing asset bubbles and inflation.
This is potentially dangerous for many reasons, including:
- Control of the Price of Money
Interest rates set the cost of credit across the economy (essentially, the price of money). Political interference could lead to short-term stimulus and long-term pain, as seen when President Nixon pressured the Fed in the 1970s, fueling inflation that Fed Chairman Paul Volcker later had to crush with extreme tightening. - Unlimited Balance Sheet Power
The Fed’s current balance sheet is about $6.6 trillion, down from a $9 trillion peak, and has no statutory cap. A politicized Fed could expand quantitative easing (QE),9 slow quantitative tightening or even adopt yield curve control to pin long rates. These moves could inflate asset prices and suppress risk premiums but make exits harder and crises more likely. - Regulatory Leverage Over Banks
The Fed controls capital ratios, liquidity rules and stress tests for U.S. banks. Loosening these could spark a credit boom and asset inflation while raising systemic leverage and fragility in the banking system. - Global Dollar as a Political Tool
The Fed’s U.S. dollar swap lines were a critical liquidity instrument to stabilize financial market crises in 2008 and 2020. Politicizing access to U.S. dollar swap lines could trigger a global dollar liquidity crisis, widen funding gaps and push foreign central banks to reduce dollar reliance (dedollarization), thereby undermining U.S. financial dominance. - Market Plumbing Risks
Tools like the Standing Repo Facility, overnight repos and the discount window keep short-term funding flowing smoothly. If they are used for political purposes, they could throw money markets off balance and disrupt smooth functioning, making Treasuries harder to trade and adding fuel to inflation and financial stress.
Reading the Yield Curve for Gold Signals
In our view, gold prices are poised to resume their upward momentum and move significantly due to a confluence of macroeconomic and political dynamics. One of the primary drivers is inflation risk. With tariffs taking effect, the cost of goods is expected to rise, especially as post-tariff inventory reaches consumers. This inflationary pressure typically boosts demand for gold, which serves as a hedge against purchasing power erosion.
In a world increasingly defined by trade wars, geopolitical risk and financial system stress, gold stands out as a safe-haven asset independent of financial systems.
Interest rate uncertainty further supports gold. The Fed has signaled it may cut rates at the upcoming September FOMC meeting. However, political pressure is mounting for deeper cuts. If these cuts occur while inflation remains elevated, real interest rates could decline, an environment historically favorable for gold.
Political instability also plays a role. Escalating tensions between the Fed and the Trump administration, including presidential threats to dismiss key Fed officials and gain control of monetary policy, have introduced institutional uncertainty and risk. Gold tends to perform well in such climates, offering a safe haven store of value amid political turbulence.
In a world increasingly defined by trade wars, geopolitical risk and financial system stress, gold stands out as a safe-haven asset independent of financial systems. It provides protection and diversification, especially as concerns grow over the potential end of Fed independence. This scenario aligns with the “debasement trade,” where a weakening U.S. dollar drives investors toward hard assets like gold.
The steepening yield curve is flashing bullish signals for gold.
The 2s30s Treasury yield curve10 continues to steepen aggressively as two-year yields have fallen while 30-year yields climb. Markets are pricing in policy rate cuts even as long-term inflation and credibility premia rise on concerns about restrictions on Fed independence. Historically, when the Fed begins its rate-cutting cycle, long-end yields fall, but last year, when the Fed cut rates, long-end yields rose, which may repeat. This backdrop revives chatter about yield curve control (YCC). If term premia prove sticky, pressure builds to cap the long end despite the Fed’s stated preference to shorten WAM (weighted average maturities) and avoid new LSAPs (large-scale asset purchases such as QE).
Gold appears to be breaking out of a bullish flag. A two-year regression of the 2s30s Treasury yield curve versus spot gold shows a tight relationship (R² ≈ 0.89), with the fit strengthening recently (see Figure 2). Overall, the steepening yield curve is flashing bullish signals for gold: two-year yields falling on the prospect of lower policy rates ahead, while 30-year yields rise on the threats of persistent inflation risk, higher term premiums and potential fiscal dominance. If uncontrolled steepening pushes policymakers toward YCC, forcing nominal yields below inflation, we expect monetary assets (e.g., Treasury bonds and the U.S. dollar) to erode in real terms, steering flows toward hard assets such as gold.
Figure 2. Gold Hugs the 2s30s Treasury Yield Curve

Source: Bloomberg. Data as of 8/31/2025.
Gold’s Long-Term Support Factors
In contrast, Advanced Economies (AEs) have shown a softening stance on several traditional reasons for holding gold. Between 2024 and 2025, AEs reported meaningful declines in relevance for categories such as geopolitical risk (down 21%), no default risk (down 16%) and gold's liquidity (down 16%). The only stable support reason remained the "historical position" category, which rose to 92% in 2025, suggesting that for many AEs, gold's role is an ongoing, secure legacy.
This passive approach may stem from the relatively stable institutional and financial environments in developed markets, where the necessity to rethink reserve assets is less urgent. However, it also may indicate a possible underestimation of broader systemic shifts occurring globally, especially if these shifts continue to reshape trade and currency alliances. Gold reserve activity in the EMDEs suggests that this cohort is far more vulnerable than the AEs to these risks.
In our July 7 gold commentary (Gold and Silver Bull Run Continues), we noted that to manage rising debt and fiscal constraints, U.S. policymakers would need to embrace domestic financial repression. This would mean supporting bond markets through monetary easing and boosting demand via fiscal policy, while accepting a weaker dollar as the trade-off. Influencing or controlling the Fed would facilitate the task enormously.
Here is a quick summary of our main points in that commentary:
- Policy Shift Toward Supporting Treasuries Over the Dollar
U.S. policymakers are facing a worsening debt trajectory, exacerbated by the recent One Big Beautiful Bill Act, the 2025 U.S. budget reconciliation law. With no political appetite for spending restraint, fiscal and monetary strategy must prioritize protecting the Treasury bond market at the expense of the U.S. dollar. Measures such as urging the Fed to cut interest rates, relaxing the enhanced Supplementary Leverage Ratio (eSLR)11 and steering domestic savings into government bonds all point to an effort to support bond prices while allowing the dollar to weaken. - Bond Markets Come First
The bond market is central to fiscal stability. About 30% of marketable debt matures or reprices annually, so even a modest rise in yields could significantly increase interest expenses. Stable bond prices also protect the balance sheets of banks and insurers, which hold more than $5 trillion in U.S. Treasuries and agency MBS (mortgage-backed securities). Moreover, keeping real interest rates below zero helps reduce the debt burden quietly, as voters are more sensitive to market volatility than to gradual currency depreciation. A weaker U.S. dollar also aids in inflating away debt and improving trade competitiveness. - Fiscal Dominance and Financial Repression
The U.S. fiscal situation leaves little room to maneuver. With annual U.S. government interest payments nearing $1 trillion and entitlement programs costing over $2.5 trillion, roughly equal to total tax revenue, monetary policy is increasingly subordinated to fiscal policy needs. This state of fiscal dominance means the Fed must accommodate Treasury funding requirements. Persistent negative real yields and structural dollar weakness are likely outcomes. Administration control of the Fed would reinforce this dynamic. Policymakers are exploring several options to increase domestic demand for U.S. Treasuries. These include modifying eSLR rules to allow banks to hold more government bonds at lower regulatory cost, promoting stablecoins backed by Treasury bills (T-bills), offering tax incentives for long-bond holdings and potentially mandating pension funds to increase their Treasury bond exposure. These measures shift duration risk from foreign to domestic holders and deepen financial repression, where savers earn below-inflation returns and are pushed into government debt. Control of the Reserve Banks in the Fed system would help facilitate bank regulation to meet these goals. - Currency Implications: A Weaker U.S. Dollar
Financial repression and fiscal dominance would have direct consequences for the U.S. dollar. Suppressed yields reduce the real return on U.S. assets, weakening the currency's appeal. Stablecoins backed by T-bills expand the supply of dollar-like instruments without increasing demand for actual dollars, diluting their scarcity premium. With fewer foreign investors anchoring the market, the dollar could lose its stabilizing role during global risk-off events. Ultimately, the dollar could become the release valve for stress in the new funding model.
Gold Increasingly Valued as a Neutral Reserve Asset
As the U.S. moves toward fiscal dominance, we believe monetary policy will become increasingly subordinated to Treasury funding needs, eventually leading to persistent negative real interest rates. This dynamic would likely erode the value of the U.S. dollar and Treasury bonds, potentially making gold more attractive as a store of value. Financial repression through regulatory easing, incentives for domestic institutions to absorb more Treasuries and similar measures could further suppress returns on traditional assets, driving investors toward hard assets like gold.
If yield curve control is introduced to cap long-term rates, it would deepen negative real yields and reinforce gold’s role as a hedge.
Simultaneously, the weakening U.S. dollar would likely amplify gold’s appeal. A cheaper dollar would boost inflation, inflate away debt and undermine the real return on U.S. assets, while stablecoins backed by T-bills would dilute the currency’s scarcity premium.12 If yield curve control is introduced to cap long-term rates, we believe it would deepen negative real yields and reinforce gold’s role as a hedge. Together, these mechanisms—financial repression, structural dollar weakness and suppressed yields—would create a powerful bullish setup for gold.
Under this condition, the current dollar-centric global financial system will likely become less sustainable. Using the U.S. dollar as a store of value forces the U.S. to run persistent deficits, undermining its industrial base, a situation that is currently politically unviable. The three core functions of the U.S. dollar (or any currency)—store of value, medium of exchange and unit of account—would come under pressure, with the store of value function possibly migrating to a neutral reserve asset like gold.
In our view, gold is uniquely positioned for this role. Central banks already hold significant gold reserves, and gold boasts a deep and liquid market and thousands of years of history to give it unmatched credibility. Globally trusted more than fiat currencies, as evident by rampant central bank buying, gold offers a stable alternative in an evolving monetary landscape.
Figure 3. Central Banks Continue to Increase Gold Buying (1970-2025)
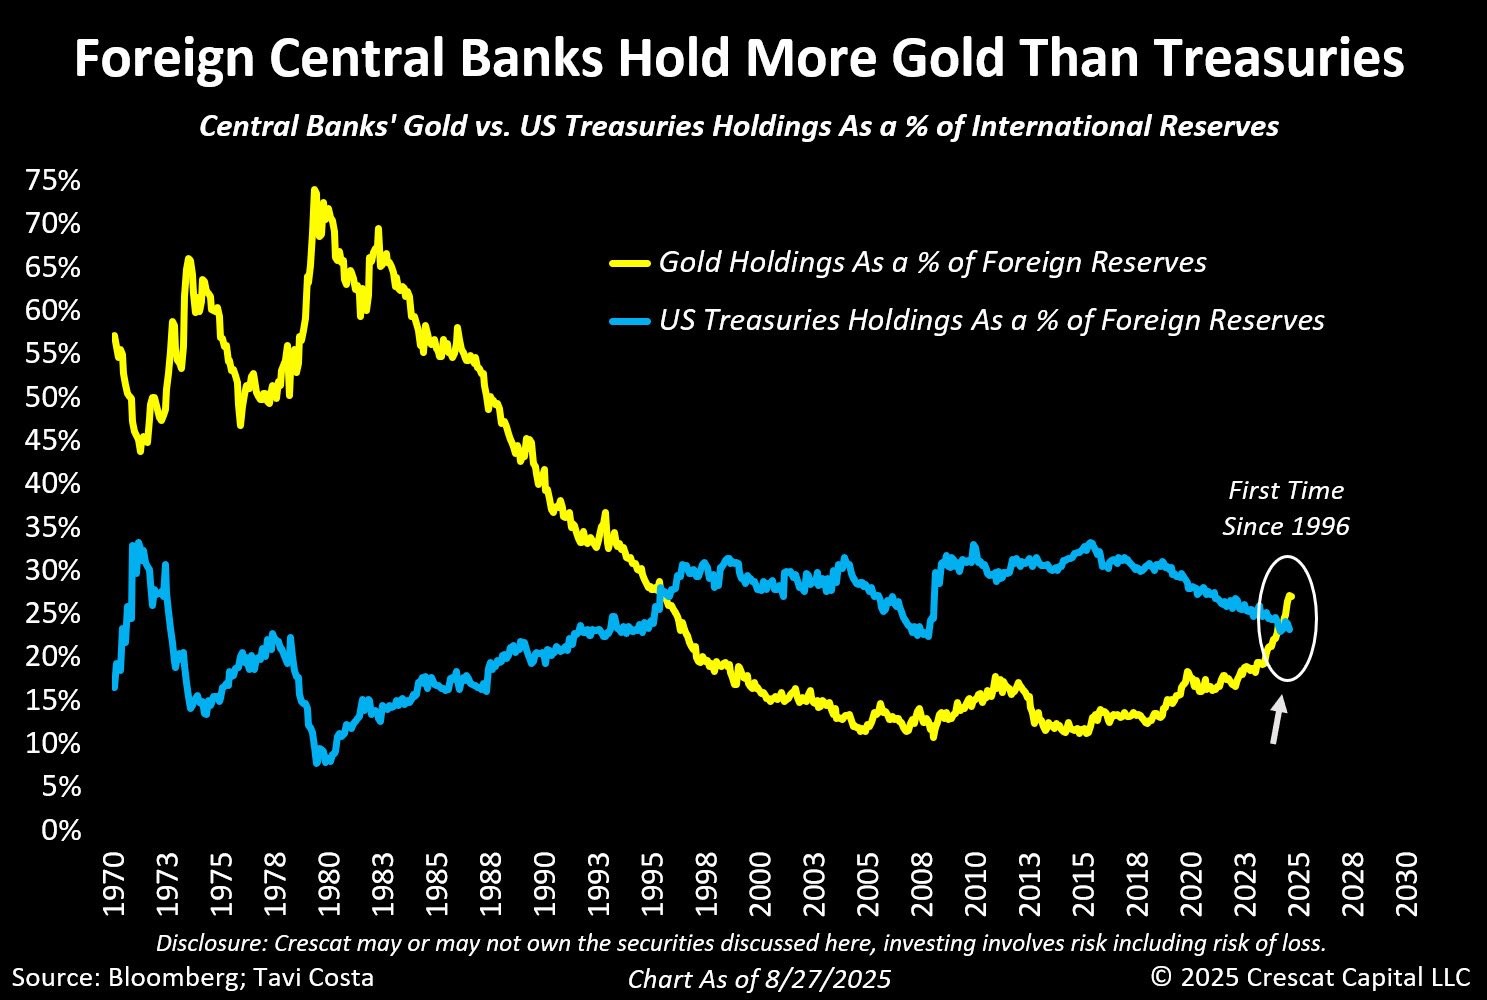
Source: Bloomberg, Tavi Costa.
Silver Market: Recapping the Bull Case
During August, spot silver increased $3.01 per ounce (or 8.19%) to close the month at $39.72, its highest closing price since August 2011. Spot silver was up 37.43% year-to-date at the end of August, its most impressive YTD performance since 2020.
As of this writing, silver has broken above $41 per ounce.
Like gold, silver is one of the strongest-performing asset classes this year. Silver had a short-lived drawdown in early August as copper sold off due to tariff news. Given its industrial demand, silver has a high correlation with copper, and many commodities highly correlated with copper saw a reduction in positions. The selling in silver was short-lived as ETF buyers accelerated buying on the pullback. As seen in Figure 4, silver broke above resistance on the last day of August trading.
Figure 4. Silver’s New Price Range (2024-2025)
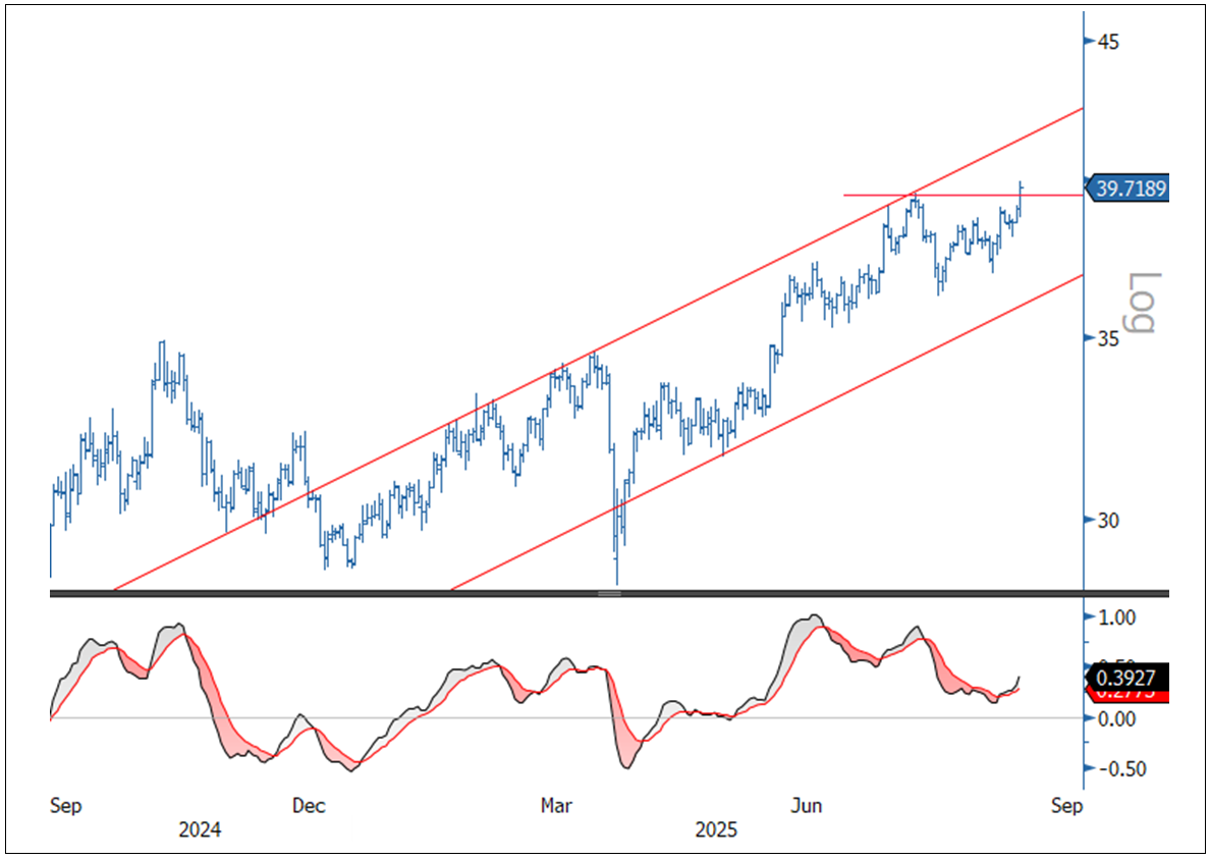
Source: Bloomberg. Silver spot price, U.S. dollar/oz. Data as of 8/31/2025. Moving average convergence/divergence is a trend-following momentum indicator that shows the relationship between two exponential moving averages.
In our April 4 commentary (Gold's Strength Amid a Crisis of Confidence), we highlighted that silver’s fundamentals are underpinned by powerful structural and macroeconomic forces that suggest a prolonged bullish view.
Here is a quick recap of that argument:
- Structural Supply Deficit
Silver supply (mine production and recycling) has been flat for over a decade, even as industrial demand, especially from solar, continues to surge, creating a persistent structural deficit. - Inventory Drain and Tight Physical Market
London Bullion Market Association (LBMA) inventories have plunged a third from their 2021 peak (Figure 5). This tightening physical market signals growing liquidity pressure, often a precursor to sharp price moves.
Figure 5. LMBA Silver Inventories Plunge (2017-2025)

Source: LBMA. Data as of 7/1/2025.
- Tariff-Driven Market Dislocations
Tariff fears have spurred arbitrage flows from London to Comex13, pushing 2025 average lease rates to around 2.3% compared to about -0.3% in 2024. Comex inventories have now reached an all-time high of 518 million ounces. Recently, silver was added to the draft of the United States Geological Survey’s critical minerals list, raising fears of possible tariffs. These disruption risks are reinforcing U.S. demand and supporting prices. - ETF Speculative Positioning
ETF silver holdings sit at 806 million ounces, well below the peak of one billion ounces. A rebound toward prior highs could strain liquidity and accelerate price gains. Speculative flows remain a potential catalyst for volatility. - Macro Tailwinds
The U.S. accounts for 20% of global industrial silver demand, with growth in photovoltaics and electronics far outpacing growth in gross domestic product. Tariff escalations and reshoring trends add further supply chain pressure, strengthening the bullish case.
When Comex copper sold off in early August on tariff news, it triggered the liquidation of positions in some correlated commodities, such as silver. The chart in Figure 5 shows the latest drawdown of CFTC non-commercial long positioning14 (converted into millions of ounces). The arrows show how silver long positioning has been reduced to its recent lows. Meanwhile, silver in ETFs (lower panel) has continued to build. With the amount of free trading silver in inventory (using Figure 4’s LBMA silver inventory as a proxy), we would expect a squeeze higher in silver prices as CFTC non-commercial traders rebuild long positions. If this occurs, it will provide further credence to our view that silver is quickly approaching the limits of its available free-trading inventory, and further price squeezes are likely.
Figure 5. Speculative Silver Long Positions at Lows (2023-2025)

Source: Bloomberg. Data as of 9/2/2025.
Footnotes
| 1 | Gold bullion is measured by the Bloomberg GOLDS Comdty Index. |
| 2 | Silver bullion is measured by Bloomberg Silver (XAG Curncy) U.S. dollar spot rate. |
| 3 | The NYSE Arca Gold Miners Index (GDM) is a rules-based index designed to measure the performance of highly capitalized companies in the gold mining industry. |
| 4 | The Bloomberg Commodity Index (BCOM) is a broadly diversified commodity price index distributed by Bloomberg Indices. |
| 5 | The U.S. Dollar Index (USDX, DXY, DX) is an index (or measure) of the value of the United States dollar relative to a basket of foreign currencies, often referred to as a basket of U.S. trade partners' currencies. |
| 6 | The S&P 500 or Standard & Poor's 500 Index is a market-capitalization-weighted index of the 500 largest U.S. publicly traded companies. |
| 7 | Bullish or bull market indicates investors are confident and prices are rising, often driven by strong economic growth or positive market sentiment. |
| 8 | Stagflation is when prices keep rising (inflation) but the economy slows down and unemployment increases at the same time. |
| 9 | Quantitative easing is when a central bank pumps money into the economy by buying financial assets to encourage spending and keep interest rates low. Quantitative tightening is essentially the opposite. |
| 10 | 2s30s Treasury yield curve refers to the difference between the interest rates (yields) on 2-year and 30-year U.S. government bonds, showing how short-term and long-term borrowing costs compare and helping investors gauge economic expectations. |
| 11 | The enhanced Supplementary Leverage Ratio (eSLR) is a capital requirement imposed by U.S. financial regulators on large banks that are systemically important to the financial system. It requires these banks to maintain a minimum level of capital relative to their total leverage exposure, which includes off-balance sheet items. The eSLR is designed to serve as a backstop to risk-based capital requirements, helping to stabilize the banking system by encouraging banks to hold low-risk assets. |
| 12 | A scarcity premium is the increased price or value that occurs when something becomes rare or difficult to obtain, driven by high demand and limited supply. |
| 13 | COMEX is the world's largest futures and options market for metals like gold, silver and copper. It is a division of the CME Group and operates out of New York. |
| 14 | This refers to long positions taken by non-commercial traders as defined by the Commodity Futures Trading Commission (CFTC), such as individual investors and hedge funds, who buy futures contracts primarily for speculation and do not have a direct business interest in the commodities they trade. |


Investment Risks and Important Disclosure
Relative to other sectors, precious metals and natural resources investments have higher headline risk and are more sensitive to changes in economic data, political or regulatory events, and underlying commodity price fluctuations. Risks related to extraction, storage and liquidity should also be considered.
Gold and precious metals are referred to with terms of art like "store of value," "safe haven" and "safe asset." These terms should not be construed to guarantee any form of investment safety. While “safe” assets like gold, Treasuries, money market funds and cash generally do not carry a high risk of loss relative to other asset classes, any asset may lose value, which may involve the complete loss of invested principal.
Past performance is no guarantee of future results. You cannot invest directly in an index. Investments, commentary and opinions are unique and may not be reflective of any other Sprott entity or affiliate. Forward-looking language should not be construed as predictive. While third-party sources are believed to be reliable, Sprott makes no guarantee as to their accuracy or timeliness. This information does not constitute an offer or solicitation and may not be relied upon or considered to be the rendering of tax, legal, accounting or professional advice.