

Key Takeaways
- Copper Near Record Levels: Copper prices and mining equities remain near all-time highs, with major miners up 26.72%% and juniors 24.79%.
- Demand Shifting Toward Strategic Uses: Growth is increasingly driven by long-term, priority projects such as electrical grid modernization, AI infrastructure, and defense.
- Price Inelasticity and Market Resilience: Strategic, mission-critical demand reduces price sensitivity, supporting sustained copper pricing even amid macroeconomic softness.
- Decoupling From Traditional Cyclical Indicators: Copper’s performance is diverging from oil, iron ore and China-linked equities, reflecting its repositioning as a strategic material.
- Supply Constraints and Policy Risk: Supply chain stress, inventory location, and U.S. Section 232 trade policy heighten sensitivity to disruptions and near-term deliverability.
Performance as of February 28, 2026
| Metric | 1 MO* | 3 MO* | YTD* | 1 YR | 3 YR | 5 YR |
| Copper Spot Price1 | 1.73% | 18.34% | 6.75% | 42.36% | 14.09% | 7.77% |
| Copper Mining Equities (Nasdaq Sprott Copper Miners Index TR)2 | 8.59% | 47.62% | 26.72% | 131.03% | 36.14% | 19.66% |
| Copper Junior Mining Equities (Nasdaq Sprott Junior Copper Miners Index TR)3 | 3.84% | 44.96% | 24.79% | 186.30% | 50.61% | 25.92% |
| Broad Commodities (BCOM Index)4 | 0.81% | 10.21% | 10.93% | 18.43% | 4.65% | 7.36% |
| U.S. Equities (S&P 500 TR Index)5 | -0.76% | 0.74% | 0.68% | 16.99% | 21.80% | 14.17% |
*Performance for periods under one year is not annualized.
Source: Bloomberg as of 2/28/2026. You cannot invest directly in an index. Past performance is no guarantee of future results.
Performance Overview: Strength at Record Levels
Copper’s resilience near record highs reflects a market being repriced around strategic electrification, AI-powered infrastructure and defense-driven demand, rather than the old cyclical “Dr. Copper” framework tied mainly to the health of the global economy.
Copper has remained firmly in a strong uptrend, hovering near record levels after hitting all-time highs in early 2026. This price action has differed from a typical cyclical rally that fades as growth narratives wobble, and instead reflects tightening fundamentals and a shift in how the market views copper’s demand profile. Investors are increasingly recognizing copper as a critical material with strategic end uses rather than a simple macroeconomic barometer.
Copper performance reflects strong underlying demand and a market repricing copper as a strategic, not cyclical, play.
Copper mining equities responded with strength in January and February, delivering operating leverage to the underlying commodity move. As of February 28, 2026, Copper miners returned 26.72% year-to-date, and junior copper miners returned 24.79%; both have more than doubled over the past year. These moves reinforce that equity markets continue to assign greater value to copper exposure as the probability of sustained incentive pricing increases. The forces driving both copper prices and copper equities are closely aligned: demand is moving toward more durable, less discretionary sectors. At the same time, supply remains slow to respond and is susceptible to disruption. We believe this combination supports a market environment in which copper can remain well supported near highs even when parts of the traditional growth picture appear mixed.
Over the longer term, this shift is evident in copper’s performance. Over the past five years, both physical copper and copper mining equities have meaningfully outperformed broader equities and commodity benchmarks, respectively (see Figure 1).
Figure 1. Physical Copper and Copper Stocks Have Outperformed Other Asset Classes Over the Past Five Years
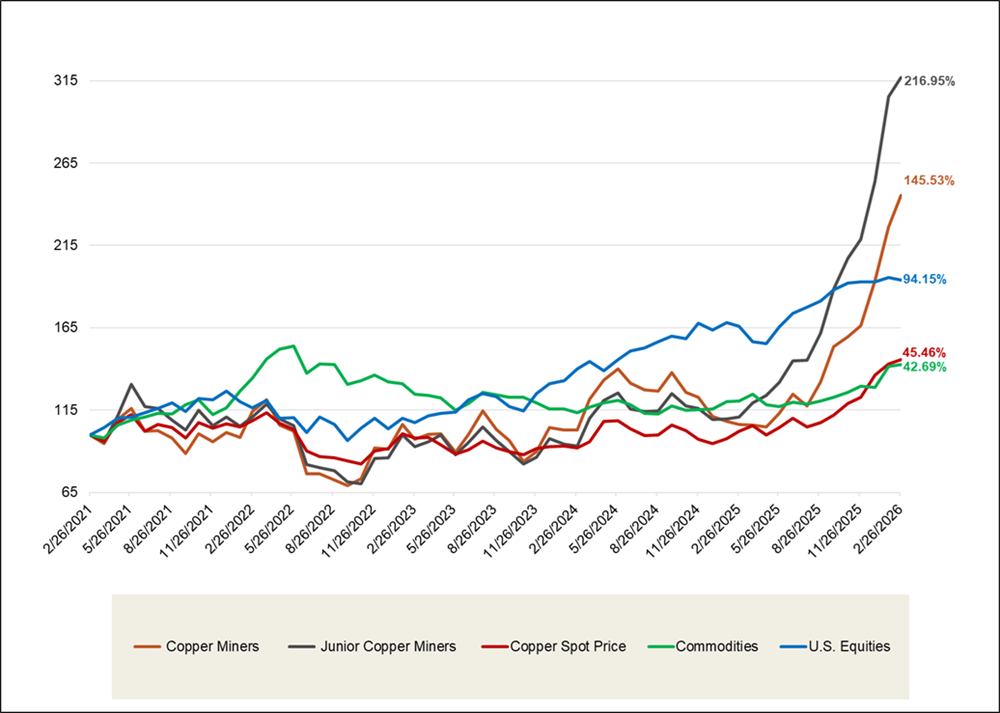
Source: Bloomberg and Sprott Asset Management. Data as of 2/28/2026. Copper Miners are measured by the Nasdaq Sprott Copper Miners™ Index (NSCOPPT index); Junior Copper Miners are measured by the Nasdaq Sprott Junior Copper Miners™ Index (NSCOPJT index); U.S. Equities are measured by the S&P 500 TR Index; the Copper Spot Price is measured by LMCADY Comdty; and Commodities are measured by the Bloomberg Commodity Index (BCOM). Definitions of the indices are provided in the footnotes. You cannot invest directly in an index. Past performance is no guarantee of future results.
Sprottlight: Goodbye “Dr. Copper”
Copper’s Critical Electric Role Set to Dominate
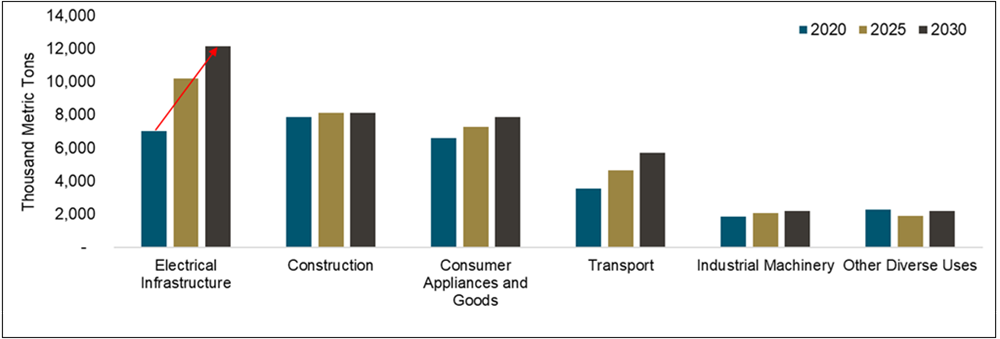
Understanding the copper market begins with demand trends. Copper has always been essential, but the mix of end uses is evolving, increasingly influencing price dynamics. Electrical infrastructure has emerged as the dominant source of demand, surpassing construction and widening its lead, highlighting the strategic role copper plays in today’s economy.
Electrical infrastructure is now the top source of copper demand.
In 2020, electrical infrastructure accounted for 24% of copper demand. By 2025, that share had risen to 30%, with the trajectory pointing toward further gains through 2030 (see Figure 2). This shift is significant because electrical infrastructure projects are typically anchored in long-term capital plans, making them harder to delay than many discretionary construction cycles. Investments in grids, power transmission and system reliability are increasingly treated as strategic priorities, especially as electrification accelerates and tolerance for outages declines.
With electrical infrastructure now the top source of copper demand, we believe copper will be well supported even when traditional cyclical signals appear uneven. In past cycles, copper was often treated as a proxy for global construction activity, with China’s property sector serving as the dominant driver. Today, the marginal unit of copper demand is increasingly linked to the buildout and modernization of electrical systems, driven not only by clean energy integration but also by load growth from new technologies and industrial policy. Even in China, where construction-related demand has slowed amid pressures in the property sector, investment in electrical infrastructure continues to more than offset the drag, sustaining overall demand growth. The result is a demand profile that is becoming more strategic, less cyclical and more closely tied to multi-year public and private capital plans.
Figure 2. Electrical Infrastructure Takes Over Copper Demand (2020-2030)
Source: BMI, December 2025. Included for illustrative purposes only.
Demand Shifting Is Increasing Price Inelasticity
A key shift is that incremental copper demand is increasingly linked to strategic, priority-driven end uses, which are generally less price-sensitive than traditional cyclical categories. Over the coming years, growth is expected to be led by segments such as defense, AI and data centers, and the energy transition, while core economic uses are likely to expand more slowly. Collectively, these strategic segments could account for 45% of copper demand by 2040, up from 32% in 2024, with growth rates well above the broader base (see Figure 3). Defense demand is forecast to grow at a 7.1% compound annual rate, while AI, data centers and the energy transition are expected to grow at 5.7% and 4.6%, respectively, and are substantially higher than the 1.6% projected for core economic uses. These trends significantly strengthen the overall copper demand outlook.
Copper’s traditional role as “Dr. Copper” is diminishing.
Copper’s shifting demand profile is particularly important given its impact on copper's price sensitivity at all-time highs. When demand is driven by discretionary construction and consumer-linked cycles, higher prices can more easily ration demand through deferrals at the margin. When demand is driven by priority projects, the dynamics can change. AI and data center buildouts are fundamentally about power density, reliability and uptime. Defense procurement is shaped by security priorities that are rarely postponed because of input cost inflation. Grid modernization is increasingly treated as a critical infrastructure investment, and aging systems are being upgraded even as new demand sources expand. In such a framework, copper demand can become more durable because the marginal driver is linked to mission-critical buildouts, policy-supported buildouts, or both.
Copper’s traditional role as “Dr. Copper” is diminishing. Historically viewed as a barometer for global growth, copper’s price movements are increasingly decoupled from short-term economic cycles. With marginal demand now driven by strategic, priority-focused end uses, we believe the copper market is positioned to remain resilient and potentially reach new highs, even amid temporary macroeconomic uncertainty.
Figure 3. Copper Demand Is Shifting Toward Strategic, Less Price-Sensitive End Uses
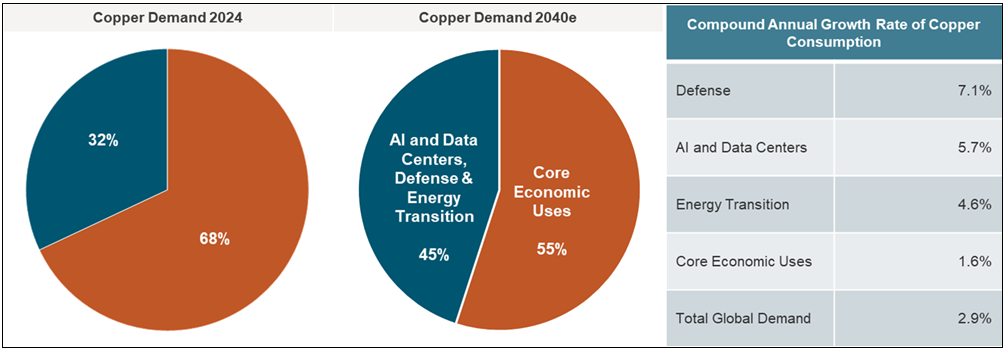
Source: S&P Global, January 2026. 2040e refers to estimated demand forecasts.
Copper Has Already Decoupled From Other Economic Commodities
The shift in copper’s demand composition is increasingly reflected in its trading behavior relative to commodities more closely linked to the economic cycle. Historically, copper moved in step with iron ore and oil, given their widespread use across the global economy. Today, however, copper’s rally is being propelled by structural demand drivers, leading to a pronounced divergence from both oil and iron ore over the past several years (see Figure 4).
Copper’s performance divergence is significant because iron ore and oil remain closely tied to traditional industrial cycles. By contrast, copper is increasingly being repriced at the intersection of physical tightness and strategic demand, rather than simply mirroring broad macroeconomic trends. That distinction becomes particularly important in risk-off environments: while copper can still participate in broad selloffs driven by macro narratives, its structural drivers tend to reassert themselves quickly—especially when supply is constrained and deficits emerge earlier than anticipated.
Copper’s record-setting behavior has coincided with a growing focus on supply chain dynamics and policy risks. The market is responding not just to overall supply-demand balances, but also to constraints on deliverability, inventory positioning and regulatory uncertainty. These factors influence where copper is available and how quickly it can reach end users. When these frictions intensify, copper can trade at a higher critical premium.
Figure 4. Copper Diverges from Iron Ore and Oil (2016-2026)
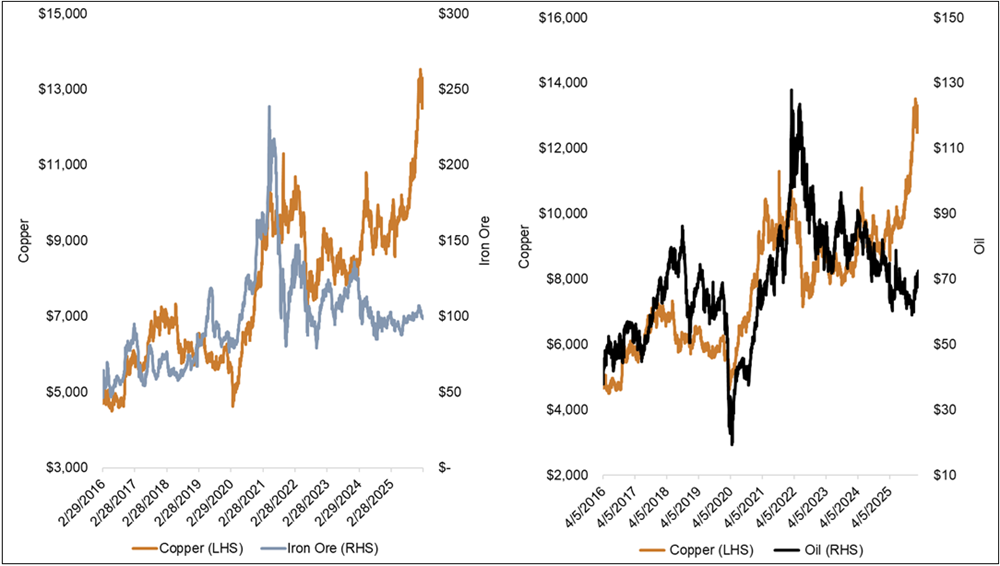
Source: Bloomberg as of 2/28/2026. Copper is measured by LMCADY Comdty. Iron ore is measured by the ISIX62IU Index. Oil is measured by CO1 Comdty (Brent crude oil).
Copper Is Also Less Correlated to China
A key implication of copper’s evolving demand profile is its gradual decoupling from China-centric sentiment indicators. China remains the largest consumer, representing roughly 55–58% of global refined copper demand, and policy and economic activity there will continue to influence the market. However, incremental demand growth is increasingly global and strategically driven, reducing the extent to which China-focused metrics alone can explain copper’s performance.
Copper is decoupling from China-centric sentiment indicators.
Copper has broken away from Chinese equities, reflecting a declining correlation that has been apparent since 2021 (see Figure 5). The shift aligns with the rise of strategic end-use demand, shifting the copper story from a narrow focus on property and construction to a broader narrative driven by the global buildout of electrical systems and critical infrastructure.
For investors, this changes how copper should be interpreted during periods of weakness in Chinese equities or negative headlines on the property sector. Under the old regime, such developments often disproportionately influenced copper sentiment. In the evolving market, they remain relevant but now coexist with demand drivers that are less directly tied to China’s equity cycle. As copper demand becomes increasingly anchored in electrification and strategic procurement, the metal can remain well supported even when China-linked risk assets falter, particularly in a market characterized by tight supply and limited flexibility to respond to disruptions.
Figure 5. Copper Breaks Away from Chinese Equities (2015-2026)
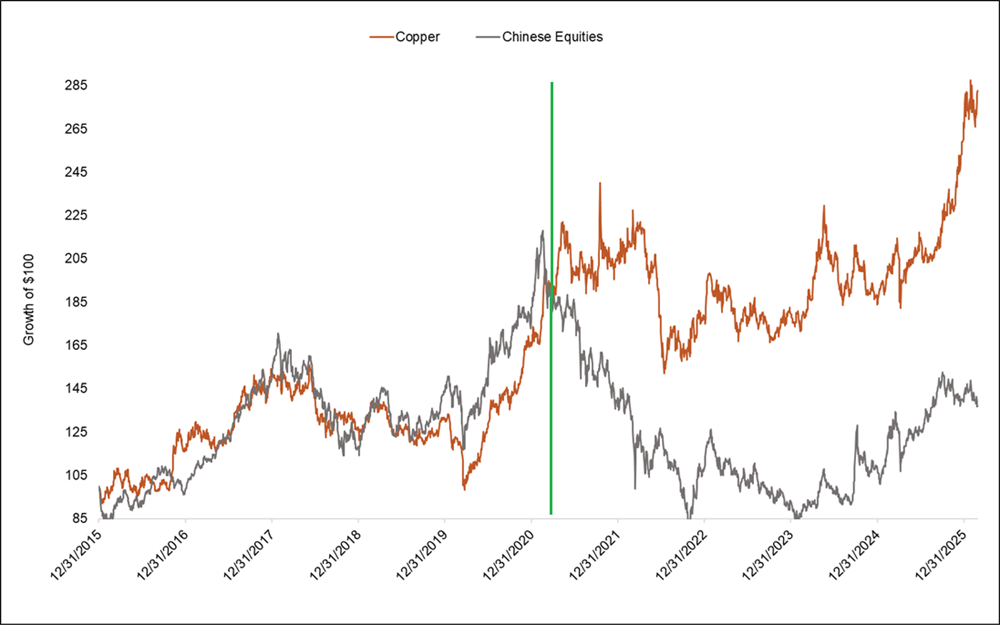
Source: Bloomberg as of 2/28/2026. Chinese equities are measured by the MXCN Index. Copper is measured by the LMCADY Comdty.
Looking Ahead: The Next Drivers of the Strategic Premium
Rather than the traditional cyclical playbook, copper enters 2026 with a setup that remains constructive but is increasingly shaped by policy risk, inventory positioning and upstream stress signals. The most important near-term catalyst is U.S. trade policy under the Section 2326 pathway, where ongoing updates and decisions could sway both market sentiment and physical flows in an already tight market.
In this environment, the location of copper inventories can matter as much as the headline totals. Policy uncertainty often prompts precautionary behavior, concentrating copper supplies in specific regions and tightening availability elsewhere, even if overall stockpiles appear ample. This fragmentation heightens the market’s sensitivity to small shifts in deliverability and near-term supply conditions.
At the same time, copper supply chain stress remains a key signal, especially in the concentrate market. Treatment charges have served as a pressure gauge for mined supply, and persistent tightness would indicate limited flexibility to absorb disruptions or adjust quickly if demand holds firm. This matters because the market has repeatedly demonstrated its ability to rapidly reprice when upstream constraints persist.
On the demand side, copper’s structural transformation continues to deepen. Incremental copper demand is increasingly tied to multi-year, priority-driven buildouts such as grid expansion and modernization, AI-era power infrastructure and defense-related procurement. These categories are harder to defer, helping underlying consumption remain resilient even amid softer macro conditions. Copper is increasingly being priced as strategic infrastructure, and when durable demand meets constrained supply responsiveness, the setup can support both copper prices and copper mining equities through 2026.
Figure 6. Copper Hits All-Time Highs (2000-2026)
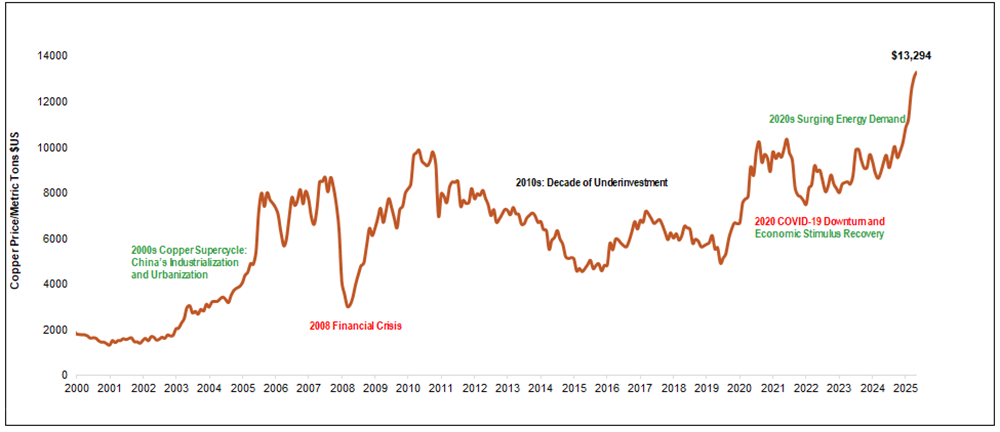
Source: Bloomberg as of 2/28/2026. Copper is measured by LMCADY Comdty. Past performance is not indicative of future results.
Footnotes
| 1 | The copper spot price is measured by the LME Copper Cash ($), Bloomberg ticker LMCADY. |
| 2 | The Nasdaq Sprott Copper Miners™ Index (NSCOPP™) is designed to track the performance of a selection of global securities in the copper industry; the Index was co-developed by Nasdaq® and Sprott Asset Management LP. |
| 3 | Nasdaq Sprott Junior Copper Miners™ Index (NSCOPJ™) is designed to track the performance of mid-, small- and micro-cap companies in copper-mining related businesses; the Index was co-developed by Nasdaq® and Sprott Asset Management LP. |
| 4 | The Bloomberg Commodity Index (BCOM) is a broadly diversified commodity price index that tracks prices of futures contracts on physical commodities and is designed to minimize concentration in any one commodity or sector. It currently has 23 commodity futures in six sectors. |
| 5 | The S&P 500 or Standard & Poor's 500 Index is a market-capitalization-weighted index of the 500 largest U.S. publicly traded companies. |
| 6 | A Section 232 national security review for copper refers to an investigation by the U.S. Department of Commerce under Section 232 of the Trade Expansion Act of 1962 to determine whether imports of copper threaten national security. |


Investment Risks and Important Disclosure
Relative to other sectors, precious metals and natural resources investments have higher headline risk and are more sensitive to changes in economic data, political or regulatory events, and underlying commodity price fluctuations. Risks related to extraction, storage and liquidity should also be considered.
Gold and precious metals are referred to with terms of art like "store of value," "safe haven" and "safe asset." These terms should not be construed to guarantee any form of investment safety. While “safe” assets like gold, Treasuries, money market funds and cash generally do not carry a high risk of loss relative to other asset classes, any asset may lose value, which may involve the complete loss of invested principal.
Past performance is no guarantee of future results. You cannot invest directly in an index. Investments, commentary and opinions are unique and may not be reflective of any other Sprott entity or affiliate. Forward-looking language should not be construed as predictive. While third-party sources are believed to be reliable, Sprott makes no guarantee as to their accuracy or timeliness. This information does not constitute an offer or solicitation and may not be relied upon or considered to be the rendering of tax, legal, accounting or professional advice.