View the monthly commentary on Copper, Lithium and Nickel.
View Critical Materials April 2024 Performance Table
Key Takeaways
- The expansion of AI technologies and data centers is paving the way for a dramatic increase in electricity usage, presenting both obstacles and prospects for global energy networks.
- As AI technologies require more stable and substantial power sources, nuclear energy emerges as a prime candidate, offering sustainable, reliable energy that supports global clean energy goals.
- Rising electricity demand could further exacerbate the existing structural deficit in copper markets, which we believe are entering a new supercycle.
- Despite the recent rally driven by supply curtailments, lithium prices need to rise further to incentivize new supply.
April in Review
The Nasdaq Sprott Energy Transition Materials (NSETM) Index increased by 57.57 points, or 5.99%, in April to close the month at 1,018.09. As of the end of April, the NSETM Index is up 3.26% year-to-date. Copper miners posted another solid month while uranium miners continued to hold a high-level consolidation trade range. Nickel miner stocks are now following rebounding nickel prices. Lithium miner stocks remain very oversold but are showing signs of basing. The NSETM Index has spent the past two years in a high-level bullish consolidation (see Figure 1). With the main index groups either advancing, rebounding or consolidating, there are signs that the index is emerging from its lengthy consolidation.
Figure 1. Nasdaq Sprott Index: Consolidation with Emerging Base (2019-2024)
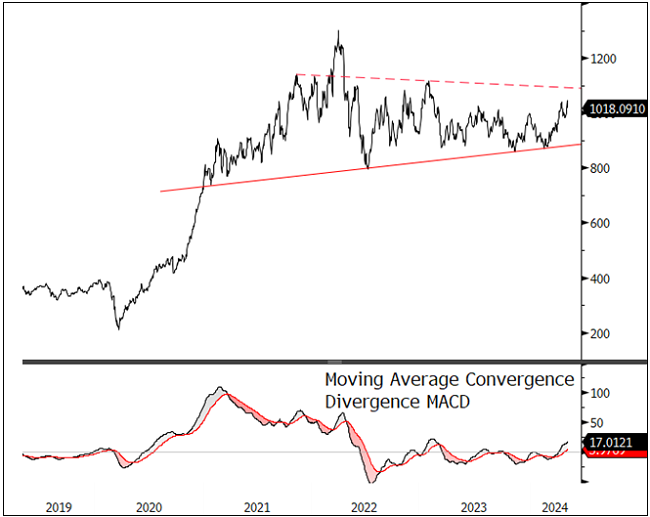
Source: Bloomberg. Nasdaq Sprott Energy Transition Materials Index. Data as of 4/30/2024. Moving average convergence/divergence is a trend-following momentum indicator that shows the relationship between two exponential moving averages (EMAs), calculated by subtracting the 26-period EMA from the 12-period EMA. Past performance is no guarantee of future results.
April witnessed stronger-than-expected U.S. economic data (non-farm payrolls, core CPI, retail sales, etc.). As a result, the market lowered its expectations for U.S. Federal Reserve interest rate cuts in 2024 from three cuts to fewer than two. The 10-year U.S. Treasury bond yield rose to close the month at 4.68%, near its high in the fourth quarter of 2023. Unlike late 2023, when yields moved higher due to persistent fears of funding stress, challenging most assets, the current rise in yields reflects persistent economic growth alongside sticky inflation.
Commodities and resource equities performed well in April due to their leverage as reflationary assets and inflation hedges. Conversely, the S&P 500 Index fell by 4.16%, its most significant monthly decline since September 2023, as the rise in the U.S. dollar and U.S. bond yields caused market multiples to compress, especially in rate-sensitive long-duration sectors such as technology.
AI, Nuclear Power and Copper in the Modern Energy Landscape
Artificial intelligence (AI), which involves simulating human intelligence in machines programmed to think and learn, is becoming increasingly fundamental in the corporate sector. A critical backbone of AI is the data center, a highly specialized facility equipped to handle the enormous computational needs required for AI processes. These data centers are robust hubs where massive volumes of data are processed to support everything from language translation services to advanced medical diagnostics.
AI data centers are likely to demand copper-intensive electrical equipment and the stable energy offered by nuclear power.
Preliminary projections estimate that by 2026 data centers could consume over 700 TWh (terawatt hours) annually, accounting for roughly 2.2% of global electricity usage.16 This surge in energy consumption will likely present substantial challenges, stressing local and global electricity grids and escalating environmental concerns.
A novel approach to supporting rapid data center deployment is to use the existing infrastructure of U.S. nuclear power plants. These facilities can provide robust and stable power for the high-demand loads of AI servers and offer necessary cooling resources, making them ideal power sources for data centers.
The demand for copper, a vital material for electricity infrastructure, is poised to increase significantly. As data centers’ AI capabilities grow, so does the need for copper-intensive electrical equipment to efficiently handle increased power densities and reduce operational costs.
The World is Electrifying
From 1990 to 2022, the global demand for energy grew at an average annual rate of 1-2%17 as industrialization and technological advancements have increased electricity demand while improved energy efficiencies ameliorated the rise. However, this relatively subdued growth rate is set to pivot with an expected acceleration to an average annual growth rate of 2.7% through 2030, as noted by the International Energy Agency (IEA).18 This resurgence will be driven by improved economic conditions and the progressive electrification of residential and transport sectors, particularly in advanced economies.
There are three themes underpinning the growing trend of electrification:
- Decarbonization as electricity sources become greener (nuclear, solar, wind);
- Increasing electrification of transport, industrial applications, and residential and commercial heating, all more efficient and greener than their fossil fuel comparatives;
- Reshoring of industrial policy, which is spurring investment across various sectors.
The current electricity infrastructure has already shown signs of strain after decades of inadequate upgrades. The rapid trend toward electrification is further burdening it.
Data Centers Consume Massive Amounts of Electricity
The AI boom is catalyzing explosive growth in AI data centers. Alongside broader electrification efforts and continuing growth in the technology sector, AI data centers are emerging as significant consumers of global electricity.
In 2022, data centers (mostly non-AI focused) accounted for 1.2% of global electricity demand (see Figure 2), with annual consumption of approximately 340 TWh. According to various sources, by 2026 data center demand will have doubled to over 700 TWh, or 2.2% of the global electricity supply. By 2030, data center power requirements could quadruple to over 1,400 TWh, or 4.1% of global electricity supply.
Figure 2. Data Centers and the Global Electricity Supply (2022-2030E)
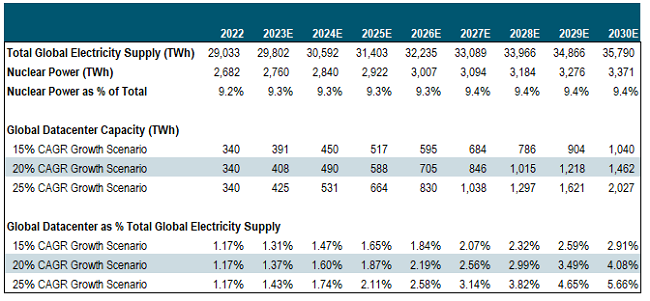
Source: IEA.org, World Energy Outlook 2023.
Power-Hungry AI Data Centers
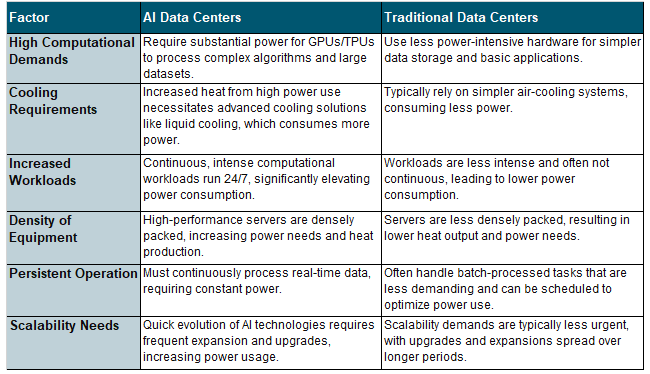
From an electrical power perspective, AI data centers are differentiated from traditional data centers by their higher need for capacity and scalability, low latency and cooling efficiency. Computing processes and cooling are the largest consumers of electricity in these facilities, each accounting for about 40% of total energy usage, with the remaining 20% attributed to other IT infrastructure. We summarize key differences in Figure 3, but note that conditions can vary considerably from one data center to another.
Figure 3. Battery Storage’s Many Uses
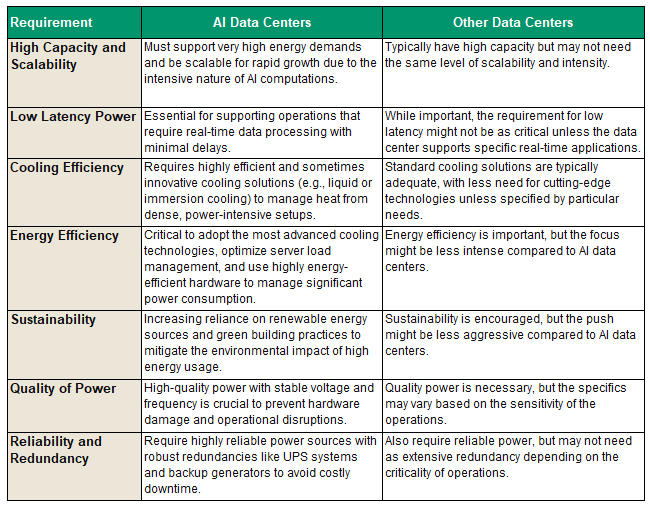
Source: Sprott Asset Management.
Data center electricity consumption depends very much on the technology and applications used, the efficiency of the infrastructure, and operational practices. Generally, AI data centers are more energy-intensive than traditional data centers. While the differences can be difficult to estimate, especially as computer densities increase, an AI data center may consume twice as much electricity as a traditional data center. We summarize key differences below.
Figure 4. AI’s Hunger for Electricity
Source: Sprott Asset Management.
*GPU, or graphics processing unit, enhances the graphical performance of a computer. TPU, or tensor procession unit, is used to accelerate machine learning computing tasks.
With the advent of advanced Nvidia GPU technologies, such as Hopper and Blackwell, the cost of computing has significantly decreased. This cost reduction has made it feasible to construct larger and more efficient data centers. As data centers become larger, the overall data center capital cost per teraFLOPS (a metric for assessing the economic viability of generative AI data centers) can be lowered, creating a higher return on capital. Growth in the industry is focused on these larger centers.
Growth in AI technologies is indeed setting the stage for a significant surge in electricity demand, creating both challenges and opportunities for global energy infrastructure.
Technology and Policy Also Drive Electricity Demand
Digital data creation is forecast to grow substantially, with global data volume expected to exceed 180 zettabytes by 2025 (23% compound annual growth rate, or CAGR, from 2020).19 Technological advancements, digital transformation and evolving user behaviors are driving this increase. Another significant demand vector is the push to achieve national strategic objectives—for example, the U.S. attempting to reshore semiconductor manufacturing and develop strategic advantages in AI technology. All this adds up to sustained growth in electricity demand and the need to expand data centers and optimize efficiency.
The EU and the U.S. have enacted measures to enhance data center efficiency and minimize their environmental impact. These measures include mandatory reporting of energy use, efficiency standards, and integrating renewable energy sources. The giant tech companies in AI development, such as Google and Microsoft, have committed to a zero-carbon footprint for their power needs, which will place greater emphasis on renewable energy.
AI and Nuclear Power: A Symbiotic Relationship
As AI capabilities expand, there is a growing need for stable power sources in data centers that manage large volumes of data and complex computations. Nuclear power plants are ideally suited to meet this demand. They offer sustainable and reliable energy that aligns with global clean energy and climate goals while providing ample cooling capabilities for servers.
A noteworthy example of the current trend is Amazon Web Services' recent acquisition of a 960-megawatt nuclear-powered data center in Pennsylvania from Talen Energy.20 Powered by the adjacent Susquehanna nuclear plant, this facility underscores the reliability of nuclear power in providing consistent energy, critical for data centers needing uninterrupted operation. The transaction aligns with Amazon's sustainability goals for reaching net-zero carbon by 2040 and fully powering operations with renewable energy by 2025.
Nuclear power also figures prominently in discussions about the role of decarbonization in a sustainable future. The U.S. administration's strategy to enhance nuclear capacity significantly by 2050 is part of a broader effort to achieve climate targets. It emphasizes nuclear power as a "clean firm" power source—carbon-free energy that provides consistent output regardless of external conditions like weather.
Despite nuclear power’s promise, the industry faces challenges such as high costs, project delays, and a lack of standardization in reactor designs. However, nuclear power is likely to become safer and more economically viable in the future with new technologies like small modular reactors (SMRs) and other innovative designs.
As AI technologies evolve, the need for sustainable, reliable and clean energy solutions will become more apparent. Nuclear power has the potential for large-scale energy production and minimal carbon emissions. Economies have consistently adapted in order to increase their computing capabilities exponentially, and nuclear energy is emerging as an ideal solution to the current challenge.
Data Centers’ Expanding Copper Needs
AI technologies are also driving demand for copper to construct and operate AI data centers and their electricity systems. The need for robust infrastructure capable of handling extensive power and cooling demands increasingly involves copper due to its superior electrical and thermal conductivity properties.
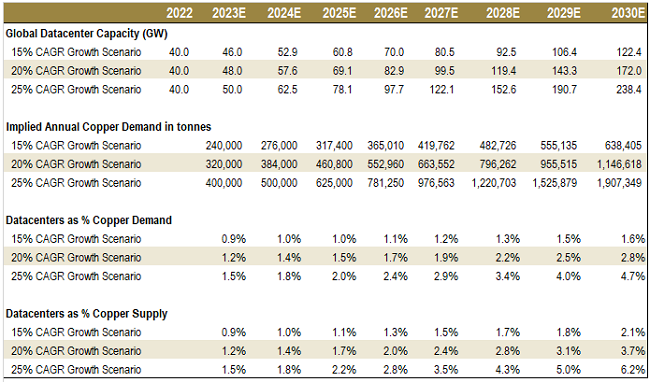
Using various data sources (see Figure 5), we have made some projections of the data center segment’s potential impact on copper supply and demand. We show three scenarios below for copper demand from data center growth—a conservative-growth 15% CAGR, a median-growth 20% CAGR and a high-growth 25% CAGR. We use a copper intensity of 40 tonnes per 1 MW capacity. We conservatively assume AI data centers consume at least twice as much electricity as conventional data centers, a figure that is expected to rise as computer density climbs. Note that our estimates refer only to copper demand directly from data centers. A rise in the number of data centers, given their electricity needs, will likely lead to ancillary copper demand from other power sources, like grid, wind, solar, storage batteries, etc.
By 2030, under the median scenario, the amount of copper required could reach about 1.1 million metric tons annually, representing roughly 2.8% of global demand. According to BloombergNEF (BNEF), in 2024 copper is already projected to be in deficit by one million tonnes, not including AI data center demand (BNEF published its latest data before AI demand expectations were known). In other words, data center demand for copper is a new demand shock element for copper markets already in a structural deficit.
Figure 5. How Data Centers Could Affect the Copper Markets (2022-2030E)
Using 40 Tonnes of Copper per MW Intensity
Sources: BNEF Copper Transition Metals Outlook 2023, JP Morgan – Copper & AI: The Coming Wave. Past performance is no guarantee of future results.
A good example of the trend is the recent shift by Nvidia, a leader in AI technology, to using copper cables instead of optical fiber for short-distance data transmission in order to reduce power consumption in its data centers. Copper cables are favored for networking GPUs over short distances because of their efficiency compared to optical solutions. Using copper also supports the deployment of liquid cooling technologies that manage heat more effectively, which enables denser GPU configurations. Nvidia estimates that the transition to copper could result in energy savings of up to 20 kilowatts per server rack.21
Accelerating demand from a high-growth non-cyclical sector like AI potentially deepens the structural supply deficit in the copper market. At the same time, miners are dealing with supply challenges that include declining ore grades and ongoing production disruptions. Major copper-producing companies, especially those in prime geographical locations, continue to command premium equity multiples, reflecting the significant challenges and opportunities ahead in scaling up copper production to meet global demand.
Updates on Critical Materials
Copper: Surging Demand Ignites Prices
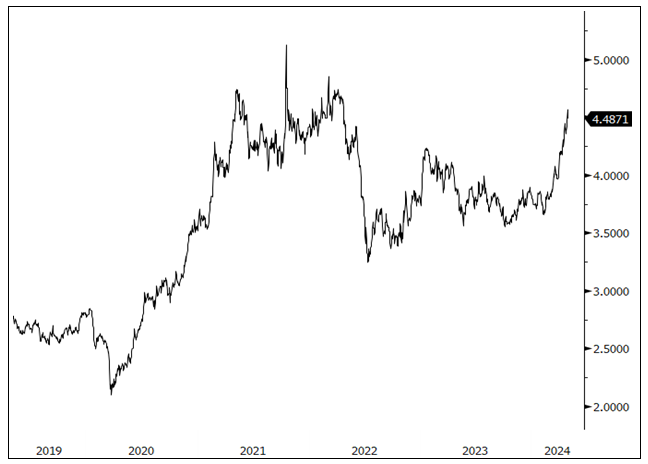
The copper spot price rose 12.84% to $4.49 per pound in April (see Figure 7), breaking through the $10,000 per metric ton level on April 29 before settling slightly lower at month-end. Copper mining stocks gained 9.38% in April following March’s increase of 17.99%, resulting in a year-to-date rise of 27.24%. Copper junior mining stocks fared similarly, increasing 9.45% in April.
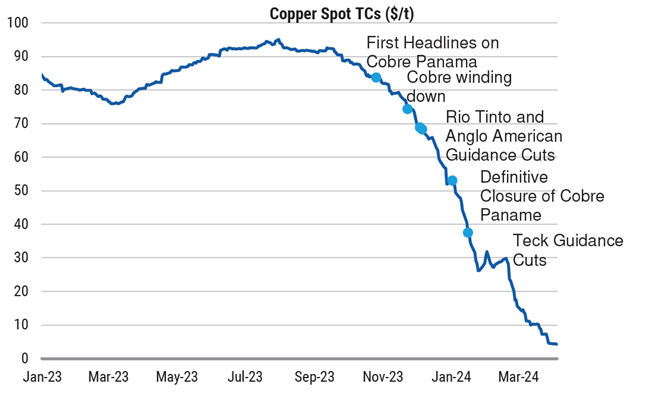
The copper markets have ignited as multiple tailwinds simultaneously came together. Kicked off by supply disruptions, the copper market is in a supply-demand deficit, and market tightness can clearly be seen in rising copper prices and plummeting treatment charges (see Figure 6).
Treatment charges are the fees smelters charge miners, and a lower fee means a smaller margin for the smelter and a tighter mine supply. These treatment charges have collapsed from >$90 per metric ton to less than $5 per metric ton. As a result, Chinese smelters, which account for around half of global refined copper production, have been moving closer to a 10% production cut. Further, it is reported that China’s copper smelter capacity was inactive on average 8.5% of the time during the first quarter of 2024.22 This represents a significant increase from 4% in the first quarter of the preceding two years.
Smelters in Zambia are also being disrupted, as the country is in the midst of an El Niño-induced power crisis and has been rationing electricity. Also, Zambian copper miners were served with notices of force majeure on the supply of electricity from Zambia’s state power utility (threatening an additional squeeze on the market).23 Finally, South Korean smelter LS Metals and Materials announced a cut in copper smelting output of 40,000 metric tons per year.24 With less smelting activity and a tight market for mined copper, refined copper prices have been pressured to the upside.
Figure 6. Copper Treatment Fees Test Historic Lows (2023-2024)
Source: Treatment Charges from Platts, Morgan Stanley Research, as of 4/17/2024. Past performance is no guarantee of future results.
The next tailwind for copper prices occurred on April 12, when the U.S. Treasury Department announced that the U.S., along with the UK, would ban the import of Russian-origin aluminum, copper and nickel produced on or after April 13, 2024. It would also limit the use of these metals on global market exchanges and in over-the-counter derivatives trading. Prices responded positively as Russia accounts for 4% of global copper production, which will likely mainly go to China. (Please see the nickel section below for more information.)
BHP, the world’s largest miner, then targeted Anglo American in a $39 billion bid, representing a 14% premium to the company’s stock price. If successful, the acquisition would create the world’s largest copper producer, controlling roughly 10% of global copper supply.25 BHP’s bid follows recent operational difficulties at Anglo American, which forced the company to reduce guidance for future copper production (see Figure 6). Anglo American rejected the bid, saying it significantly undervalued the company, but an improved deal from BHP is widely expected to follow, and other competing bids may as well (for example, Glencore was reported to be studying an approach).26
If completed, this would be the first megadeal in the sector in over a decade. That said, it does follow other multibillion-dollar copper mining deals, such as BHP’s $6.4 billion acquisition of Oz Minerals Ltd. at a 49% premium in 2023 and Rio Tinto’s $3.3 billion acquisition of Turquoise Hill Resources Ltd. at a 67% premium in 2022. It may also reinvigorate M&A activity in the copper mining space and create a tailwind, especially for pure-play copper miners (those that have >50% exposure to copper). Ultimately, when the largest miner in the world makes an unsolicited bid for increased copper mining exposure in the amount of $39 billion dollars, it builds stronger sentiment for the long-term fundamentals of the copper industry.
We believe that the copper markets are entering a new supercycle. A supply-demand deficit from increasing AI needs (see above) along with energy transition and increasing supply disruptions, has set up a positive fundamental backdrop. Further, the markets have the potential to be catalyzed by an expected pivot to easier monetary policy and a brightening outlook for the global economy. As a result of this increasingly strong outlook, we believe copper prices have more room to rise and will ultimately benefit copper miners.
Figure 7. Tailwinds Drive the Copper Market
Source: Bloomberg. Copper spot price, $/lb. Data as of 4/30/2024. Past performance is no guarantee of future results.
Lithium: Emerging from Unsustainable Lows
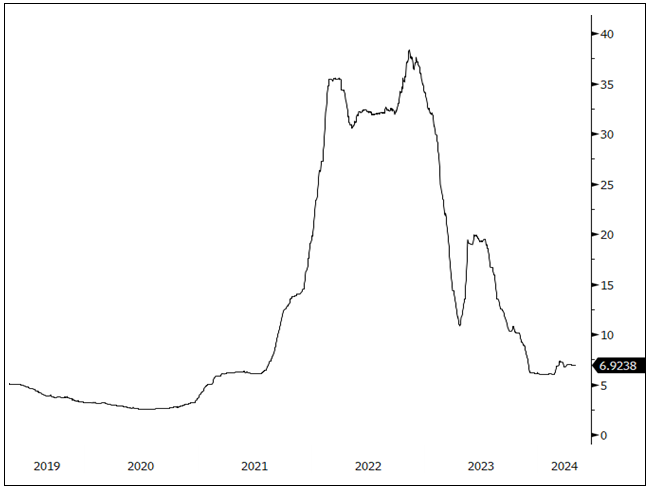
The lithium spot price was up 2.59% in April, extending its rebound and leading to a 12.30% year-to-date increase (see Figure 8). Following a period of extreme volatility, lithium has stabilized and may be set to emerge from unsustainable lows. Lithium miner stocks fell 0.21% over the month and remain oversold, although with signs of basing.
The rally in the lithium spot price has taken it to levels last seen in November 2023 on the back of supply curtailments, an environmental crackdown in China, and investors covering short positions. However, even with the recent increase, we believe lithium’s current price remains below a sustainable level to incentivize new supply in the longer term, and it will need to rise.
Figure 8. Lithium Stabilizes After Volatility
Source: Bloomberg. Lithium carbonate spot price, $/lb. Data as of 4/30/2024. Past performance is no guarantee of future results.
Electric vehicles (EVs) remain the driver of increasing lithium demand. Global EV sales are expected to power through 2024, reaching approximately 17 million units sold.27 The IEA predicts that by 2035, every other car sold globally will be electric. Nations continue to commit to electric vehicles to decarbonize transport. In China, new subsidies for trading in new energy vehicles, along with steep EV price cuts, are set to provide additional lithium demand.28 Notably, 60% of electric cars in China are less expensive than equivalent cars with internal combustion engines. Additionally, China EVs are having an impact on other emerging markets, with sales picking up in Vietnam and Thailand. The U.S. also further incentivized the EV industry by loosening some EV battery rules, making more EVs eligible for tax credits.29
Nickel: Russian Sanctions Spur Prices
In a dramatic turnaround from March’s weakness, the nickel spot price climbed 15.07% in April to end the month at $8.65 per pound (see Figure 9). Nickel mining stocks also gained ground in April, rising 9.88% during the month. For the first time in nearly a year, investment funds turned positive on nickel on the back of improving macroeconomic sentiment fueled by positive March manufacturing reports out of China and the U.S. In addition, a new ban on Russian metals in April supported nickel’s price move. On April 12, the U.S. Treasury Department announced that the U.S., along with the UK, would ban the import of Russian-origin aluminum, copper and nickel produced on or after April 13, 2024, and limit the use of these metals on global market exchanges and in over-the-counter derivatives trading.
This new ban was a collaborative move by the U.S. and the UK, both of which had previously imposed sanctions on Russia’s metals in December 2023. The London Metal Exchange (LME) stopped accepting Russian metal deliveries into its warehouses, and nickel prices responded positively. These new sanctions are not expected to cause any hardship to the U.S. economy or the nickel market as a whole. While Russia supplies approximately 20% of the world’s Class 1 nickel and 6% of total nickel, the U.S. imports less than 1% of its nickel from Russia.30 Many believe that this ban provided just a short-lived price catalyst given that China seems eager to fill the buying gap left as Western countries shun Russian metals.
China continues to dominate the global market for refining EV battery metals. This includes nickel processing, which it has achieved mainly by building industrial processing plants in Indonesia, the world’s top producer of nickel. To combat this dominance, the U.S. and the Philippines, the world’s second-largest nickel producer, have recently engaged in talks to create a rival battery powerhouse.31 The talks include a possible trilateral arrangement in which the Philippines would supply the nickel, the U.S. would provide financing capital, and a third country would offer smelting and refining technology (possibly Japan, South Korea or Australia). Nickel is key to the Biden administration’s support for greener energy and its desire to secure better access to critical materials with U.S.-based supply chains. To further bolster these goals, the U.S. Treasury released new guidance on rules incentivizing manufacturers to not use critical materials that are owned or controlled by a Foreign Entity of Concern (FEOC), which includes China, Russia, Iran and North Korea.
Figure 9. Nickel Reverses Direction
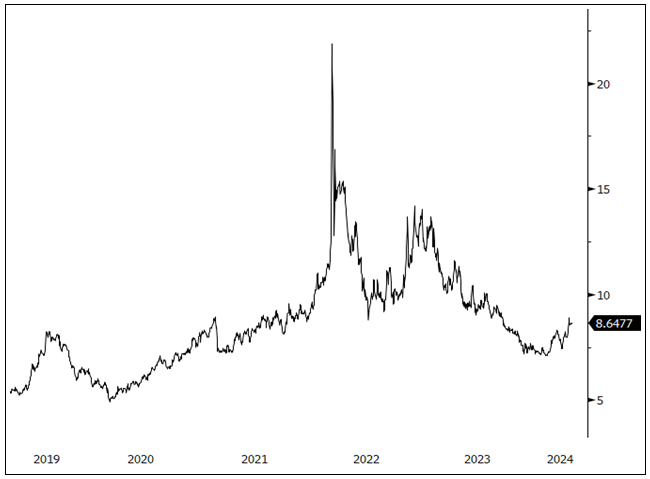
Source: Bloomberg. Nickel spot price, $/lb. Data as of 4/30/2024. Past performance is no guarantee of future results
April 2024 Performance
| Metric | 4/30/24 | 3/28/24 | Change | % Chg | YTD Chg | Monthly Comment |
| Miners | ||||||
| Nasdaq Sprott Energy Transition Materials™ Index1 | 1,018.09 | 960.53 | 57.57 | 5.99% | 3.26% |
The commodity reflation trade had another solid month in April as hotter-than-expected inflation climbed in tandem with growth expectations. Copper miners followed March's 18% increase with another 9.4% rise in April. Breadth is also expanding, with nickel now advancing. Lithium miners, while significantly oversold, are showing signs of basing. |
| Nasdaq Sprott Lithium Miners™ Index2 | 571.79 | 573.01 | (1.22) | (0.21)% | (22.36%) | |
| North Shore Global Uranium Mining Index3 | 4,036.00 | 3,944.87 | 91.13 | 2.31% | 4.93% | |
| Nasdaq Sprott Copper Miners Index4 | 1,331.28 | 1,217.09 | 114.19 | 9.38% | 27.24% | |
| Nasdaq Sprott Nickel Miners™ Index5 | 656.12 | 597.13 | 58.98 | 9.88% | (0.74%) | |
| Nasdaq Sprott Junior Copper Miners™ Index6 | 1,192.71 | 1,089.77 | 102.93 | 9.45% | 23.29% | |
| Nasdaq Sprott Junior Uranium Miners™ Index7 | 1,593.96 | 1,569.99 | 23.97 | 1.53% | 9.57% | |
| Physical Materials | ||||||
| Lithium Carbonate Spot Price $/lb8 | 6.92 | 6.75 | 0.17 | 2.59% | 12.30% |
Continues rebound from unsustainable lows. |
| U3O8 Uranium Spot Price $/lb9 | 89.89 | 88.00 | 1.76 | 2.00% | (1.32)% |
Consolidation continues. |
| LME Copper Spot Price $/lb10 | 4.49 | 3.98 | 0.51 | 12.84% | 16.88% |
Advancing under multiple tailwinds. |
| LME Nickel Spot Price $/lb11 | 8.65 | 7.52 | 1.13 | 15.07% | 16.43% |
Rebounding off Russian sanctions. |
| Benchmarks | ||||||
| S&P 500 Index12 | 5,035.69 | 5,254.35 | (218.66) | (4.16)% | 5.57% |
The broad market fell in April as expectations for Fed rate cuts fell with rising inflation numbers. Yields and the U.S. dollar rose as central bank monetary policies began to diverge due to the strength of the U.S. economy. |
| DXY US Dollar Index13 | 106.22 | 104.55 | 1.68 | 1.60% | 4.82% | |
| BBG Commodity Index14 | 101.67 | 99.49 | 2.19 | 2.20% | 3.07% | |
| S&P Metals & Mining Index15 | 3,035.44 | 3,085.70 | (50.26) | (1.63)% | (0.92)% | |
*Mo % Chg and YTD % Chg for this Index are calculated as the difference between the month end's yield and the previous period end's yield, instead of the percentage change. BPS stands for basis points.
- For the latest standardized performance of the Sprott Energy Transition ETFs, please visit the individual website pages: SETM, LITP, URNM, URNJ, COPP, COPJ and NIKL. Past performance is no guarantee of future results.
Footnotes
| 1 | The Nasdaq Sprott Energy Transition Materials™ Index (NSETM™) is designed to track the performance of a selection of global securities in the energy transition materials industry and was co-developed by Nasdaq® and Sprott Asset Management LP. |
| 2 | The Nasdaq Sprott Lithium Miners™ Index (NSLITP™) is designed to track the performance of a selection of global securities in the lithium industry, including lithium producers, developers and explorers; the Index was co-developed by Nasdaq® and Sprott Asset Management LP. |
| 3 | The North Shore Global Uranium Mining Index (URNMX) is designed to track the performance of companies that devote at least 50% of their assets to the uranium mining industry, which may include mining, exploration, development and production of uranium, or holding physical uranium, owning uranium royalties or engaging in other non-mining activities that support the uranium mining industry. |
| 4 | The Nasdaq Sprott Copper Miners™ Index (NSCOPP™) is designed to track the performance of a selection of global securities in the copper industry. |
| 5 | The Nasdaq Sprott Nickel Miners™ Index (NSNIKL™) is designed to track the performance of a selection of global securities in the nickel industry. |
| 6 | The Nasdaq Sprott Junior Copper Miners™ Index (NSCOPJ™) is designed to track the performance of mid-, small- and micro-cap companies in copper-mining related businesses. |
| 7 | The Nasdaq Sprott Junior Uranium Miners™ Index (NSURNJ™) is designed to track the performance of mid-, small- and micro-cap companies in uranium-mining related businesses. |
| 8 | The lithium carbonate spot price is measured by the China Lithium Carbonate 99.5% DEL. Source Bloomberg and Asian Metal Inc. Ticker L4CNMJGO AMTL Index. Data converted to pounds and to USD with Bloomberg FX Rates. |
| 9 | The U3O8 uranium spot price is measured by a proprietary composite of U3O8 spot prices from UxC, S&P Platts and Numerco. |
| 10 | The copper spot price is measured by the LME Copper Cash ($). Source Bloomberg ticker LMCADY. Data converted to pounds. |
| 11 | The nickel spot price is measured by the LME Nickel Cash ($). Source Bloomberg ticker LMNIDY. Data converted to pounds. |
| 12 | The S&P 500 or Standard & Poor's 500 Index is a market-capitalization-weighted index of the 500 largest U.S. publicly traded companies. |
| 13 | The U.S. Dollar Index (USDX, DXY) is an index of the value of the U.S. dollar relative to a basket of foreign currencies. |
| 14 | The Bloomberg Commodity Index (BCOM) is a broadly diversified commodity price index that tracks prices of futures contracts on physical commodities, and is designed to minimize concentration in any one commodity or sector. It currently has 23 commodity futures in six sectors. |
| 15 | The S&P Metals & Mining Select Industry Index comprises stocks in the S&P Total Market Index that are classified in the GICS metals & mining sub-industry. |
| 16 | International Energy Agency, Electricity 2024 |
| 17 | Our World in Data, Electricity Demand 2023 |
| 18 | International Energy Agency, ibid |
| 19 | Statista, Volume of data/information created, captured, copied, and consumed worldwide |
| 20 | Nuclear Newswire, “Amazon buys nuclear-powered data center from Talen,” March 7, 2024 |
| 21 | Investors Business Daily, “AI Data Centers Seen Driving Demand For Copper. These Stocks Could Benefit,” March 28, 2024 |
| 22 | Earth-i Savant, “Copper smelter inactivity rises further in Q1,” April 11, 2024 |
| 23 | Bloomberg Law, “Zambia Copper Mines Hit by State Utility’s Warning of Power Cuts,” April 17, 2024 |
| 24 | The Deep Dive, “Major Copper Smelters to Slash Output as Supply Crunch Looms,” April 17, 2024 |
| 25 | Mining.com, Bloomberg News, “BHP targets Anglo American in bid valued at $39 billion,” April 24, 2024 |
| 26 | Mining.com, Reuters, “Glencore studying an approach for Anglo American,” May 2, 2024 |
| 27 | International Energy Agency, Global EV Outlook 2024. |
| 28 | Carnewschina.com, “New trade-in scheme set to boost Chinese car market,” May 1, 2024 |
| 29 | AP, “US loosens some electric vehicle battery rules, potentially making more EVs eligible for tax credits,” May 3, 2024 |
| 30 | The Wall Street Journal, “U.S., U.K. to Ban Exchanges From Dealing in Russian Metals,” April 12, 2024 |
| 31 | Bloomberg, “US, Philippines Eye Agreement to Cut China Nickel Dominance”, April 30, 2024 |
Investment Risks and Important Disclosure
Relative to other sectors, precious metals and natural resources investments have higher headline risk and are more sensitive to changes in economic data, political or regulatory events, and underlying commodity price fluctuations. Risks related to extraction, storage and liquidity should also be considered.
Gold and precious metals are referred to with terms of art like "store of value," "safe haven" and "safe asset." These terms should not be construed to guarantee any form of investment safety. While “safe” assets like gold, Treasuries, money market funds and cash generally do not carry a high risk of loss relative to other asset classes, any asset may lose value, which may involve the complete loss of invested principal.
Past performance is no guarantee of future results. You cannot invest directly in an index. Investments, commentary and opinions are unique and may not be reflective of any other Sprott entity or affiliate. Forward-looking language should not be construed as predictive. While third-party sources are believed to be reliable, Sprott makes no guarantee as to their accuracy or timeliness. This information does not constitute an offer or solicitation and may not be relied upon or considered to be the rendering of tax, legal, accounting or professional advice.


