

Caveat Emptor
In his monograph “A Short History of Financial Euphoria”, economic historian John Kenneth Galbraith observed, "For practical purposes, the financial memory should be assumed to last, at a maximum, no more than 20 years. This is normally the time it takes for the recollection of one disaster to be erased and for some variant on previous dementia to come forward to capture the financial mind.”
For those afflicted by FMDS, we prescribe defensive positioning including high levels of cash and gold bullion.
It has been almost 20 years since the Global Financial Crisis restored a measure of sobriety to the financial markets. It is our thinking that the current cycle of market mania is due for a comeuppance. Resistance to a reality check is baked into the “buy the dip” conventional wisdom. Galbraith writes in “The 1929 Parallel” (Atlantic, 1987), “There is a compelling vested interest in euphoria even, or perhaps especially, when it verges, as in 1929, on insanity.” As noted by Walter Bagehot in Lombard Street (1873), “All people are the most credulous when they are most happy.”
Timing a financial market reversal, while imprecise, is aided by the historical fact that ebbs and flows of mass psychology are repetitive, go to extreme levels and reverse under the weight of their exhaustion. The markers of what constitute a “danger zone” are consistent. The forgotten champions of mortgage-backed securities (2007), dot-com startups (late 1990s), the “nifty fifty” stocks of the 1970s or investment trusts of the 1920s have much in common with today’s proponents of the MAG 7, crypto and the AI revolution. The signs include extreme market concentration, leverage and delusional extrapolation of the benefits of whatever happens to be the current craze.
In the following note, we prescribe for those afflicted by financial market derangement syndrome, or FMDS, a healthy dose of contrarian thinking and defensive positioning including high levels of cash and gold bullion. For those wishing for stronger countermeasures to generate positive investment returns from FMDS, we suggest significant exposure to precious metals mining equities.
Gold Equities: Still Undervalued and Under-Owned
Despite the strong year-to-date performance for gold bullion (25.35%)1 and precious metals shares (52.65% with dividends reinvested),2 investor participation remains scant. To measure current investor participation and positioning, we look to the number of shares outstanding in the VanEck Gold Miners ETF (GDX), which has declined 20.37% year-to-date and 32.86% since 2020. Mining stocks, despite an 85.47% increase in the gold price over the past five years and an even greater rise in profit margins, have lagged gold conspicuously, gaining only 51.82% over the same period.
For gold miners, the approximate industry-wide profit margin has increased from $647 per ounce in Q1 2024 to approximately $1,700 in Q2 2025, a gain of 168%.
Figure 1: Gold Miners Profitability Has Risen Significantly (2024-2025E)
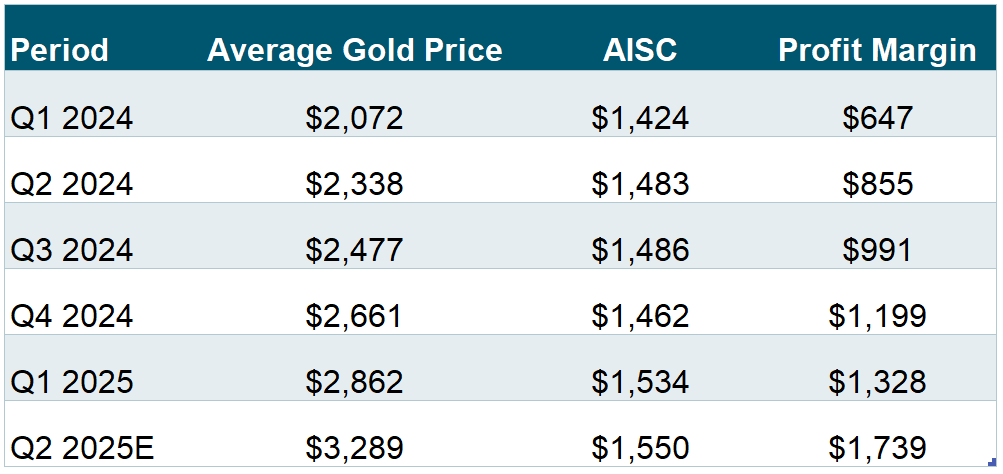
Sources: (1) Average Gold Price: Bloomberg XAU Curncy, (2) AISC: Bloomberg Intelligence (BI METG: Precious Metal Mining Dashboard), (3) Q2 2025E for AISC is based on Sprott's estimate.
Gold miners are generating record profits and cash flow. Their balance sheets are flush. Industry leaders, including Newmont Corporation and Agnico Eagle Mines Limited, are promising to return surplus capital to shareholders. Share buyback announcements and dividend hikes are listed in Appendix A. At the recent Rick Rule Symposium in Boca Raton, Agnico Eagle CEO Ammar Al-Joundi stated that he “would rather give money back” than chase marginal deals.3 Newmont has generated proceeds of $3 billion after tax from asset divestitures over the past year and announced share buybacks of $3 billion in July 2025.
The lack of interest in precious metals miners seems as inexplicable as it is unsustainable.
Blockbuster earnings reports are becoming commonplace, in many cases well above sell-side research consensus. We strongly believe there is more good news to come as the third quarter average gold price (quarter-to-date) already exceeds the second quarter average gold price by $54 per ounce. Fear of a sustained drop in the gold price, if that is the reason for the absence of investor enthusiasm, is misplaced.
Sell-side analysts continue to play catch-up with their earnings forecasts and price targets. Ingrained “bunker mentality” from a decade of poor performance in the mining sector seems to be preventing forceful advocacy of a pro-miners investment thesis from those who should be its champions.
While not standard, attention to shareholder accountability in terms of per-share metrics is increasingly evident. Useful per-share stats would include earnings, cash flow, reserves and production. Investor presentations that disclose per-share information include Wesdome Gold Mines Ltd., Alamos Gold Inc., Kinross Gold Corporation and Dundee Precious Metals Inc., to name a few. The key investment rationale for gold mining equities is leverage to the movement in the gold price. In a bull market for the metal, gold bulls want a quantification of that torque. Discussion of that connection was virtually non-existent five years ago.
The lack of interest in precious metals miners seems as inexplicable as it is unsustainable. Strong fundamentals, along with extreme investor disinterest, suggest that mining stocks are likely to continue to outperform all other S&P sectors, as they have over the past twelve months. It is the table we have been pounding, endlessly it seems, since the most recent leg of the gold bull market commenced during the throes of the COVID-19 pandemic.
Figure 2: Gold Miners Have Outperformed All S&P Sectors over the Past 12 Months as of 6/30/2025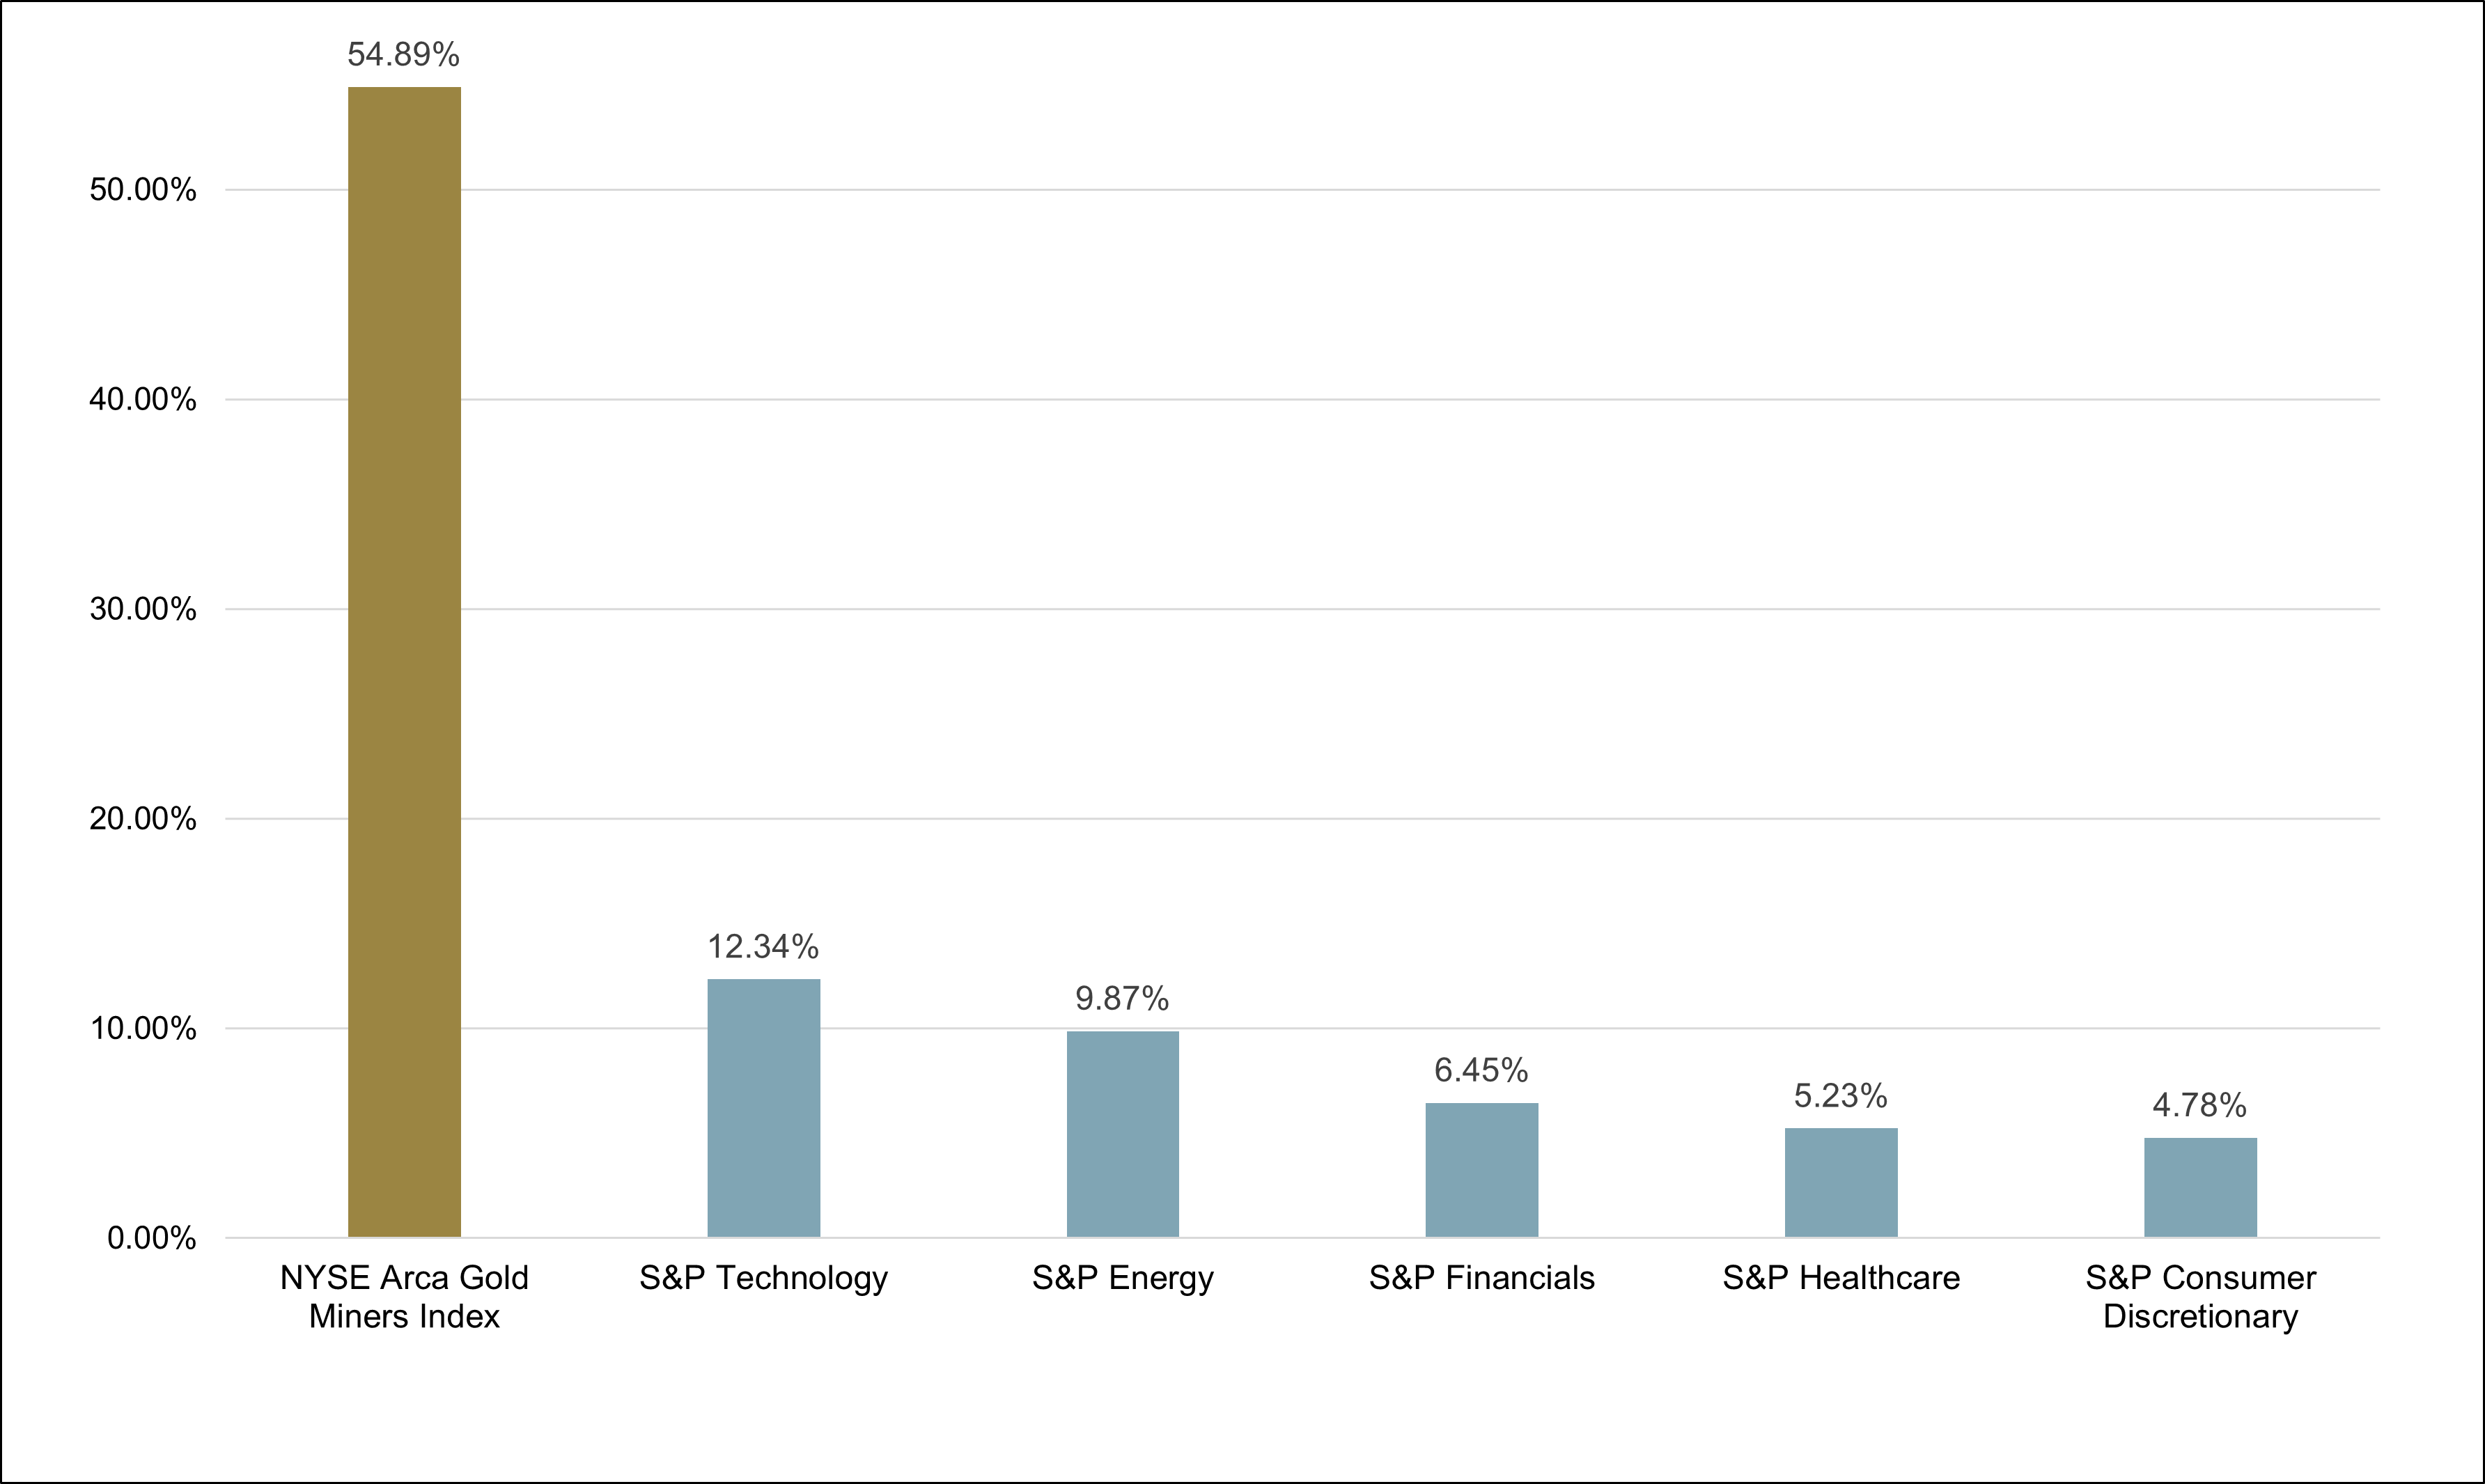
Source: Bloomberg. Data as of 6/30/2025.
Gold Bullion vs. Miners
The investment case for gold bullion, in its least controversial form, rests on the prudence of portfolio diversification. Those benefits are amply demonstrated by dispassionate historical analysis. It is a sensible argument that appeals to conservative, adult instincts. Accessibility, once challenging, has been eased for equity investors by the profusion of ETF wrappers.
Mining stocks, a logical subset of the diversification tool kit, get failing grades when it comes to judicious exposure. The bad rap includes a (now ancient) history of juvenile capital allocation decisions, volatility, illiquidity and a business model that disturbs the planet’s surface, not to mention mainstream aversion to the rationale for a gold bull market’s very existence. Bullion is to gold miners as hamburgers are to abattoirs. "Portfolio diversification” is just a polite euphemism for protection against currency depreciation and bear markets. While bullion may provide a safe haven, the miners could provide torque to events for which the markets are improperly positioned.
The Next Gold Price Catalyst: Financial Market Dysfunction
A token gold allocation of 2% to 3% is, in our opinion, just a "CYA" acknowledgement of the possibility of market adversity while remaining asleep as to any likelihood or timing. Predicting the precise turning point in the bull equity market is, of course, a hazardous exercise with many past misfires by well-regarded observers. In our opinion, however, there is strong evidence suggesting the onset of a bear market is nigh including extremes of valuation, technical analysis, investor psychology and behavior, and hyperactive retail participation.
A token 2% to 3% gold stake is just hitting the snooze button on a looming bear market alarm.
A multitude of valuation red flags is covered here (Grant’s Interest Rate Observer, 7/16/2025):
The charging-bull crowd can surely use such continued operating momentum, with the S&P 500 Index changing hands at 22.3 times forward earnings, compared with 5-year and 10-year average valuations of 19.9 and 18.4 times, respectively. Other indicators point to an historically stretched market, with the S&P 500 Index perched at 3.29 times trailing sales, the highest since at least 1990 and nearly one full turn above that seen at the peak of the dot-com bubble. The free cash-flow yield crouches at 2.76%, near February’s post-Lehman Brothers low of 2.71% and compared with a 4.19% average reading over the past 10 years, while the 1.23% dividend yield undercuts the 1.26% yield seen during risk appetite on record. In turn, average cash levels have ebbed to 3.9% from 4.2% in June, approaching February’s 3.5% (which marked the lowest reading on record dating to 2010) and triggering a sell signal from BofA’s in-house trading model."
More broadly, the FT Wilshire 5000 Index4 commands an aggregate market value near $62 trillion, equivalent to just over 208.1% of U.S. GDP. Famously dubbed the Buffett Indicator,5 that metric elicited the following commentary from the Oracle of Omaha to Forbes in December 2001: 'If the ratio approaches 200%—as it did in 1999 and a part of 2000—you are playing with fire.' The stock market’s sterling post–Liberation Day rebound has given a new boost to market morale, as Tuesday’s release of the latest Bank of America Global Fund Manager Survey shows the biggest three-month rise in Don’t look down.
A valuation red flag not mentioned in Grant’s is depicted in the Zero Hedge chart in Figure 3.
Figure 3. Return to Historic Heights
The percentage of global stocks trading above 10x EV/Sales has reached the highest level in history, surpassing both the Dot-Com Bubble and the 2021 meme mania.
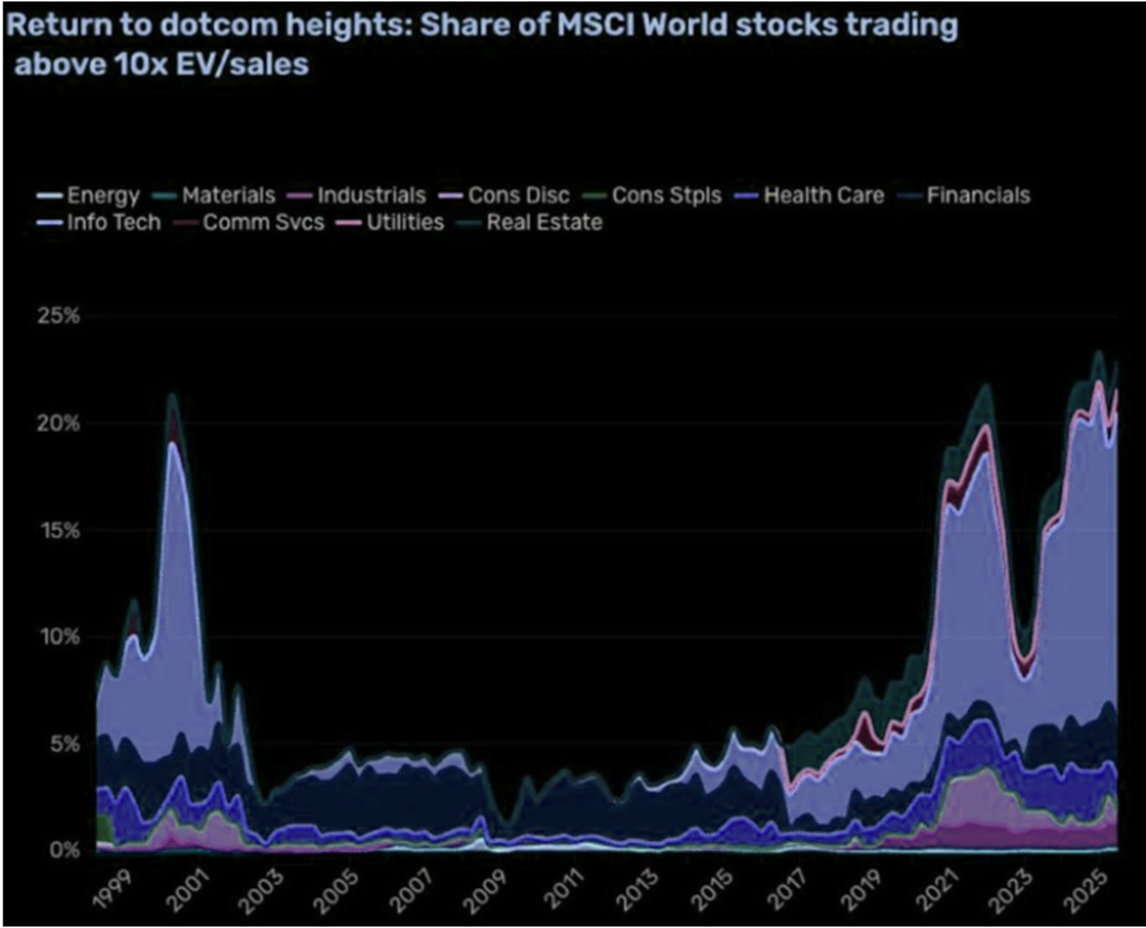
Source: Barchart/Man.
Thanks to David “Haymaker” Hay of Substack for Figure 3 and the context provided. Stocks trading at 10 times sales are generally considered to be in bubble territory. The illogic of paying this type of valuation for most, but not all, equities was famously articulated by Sun Microsystem’s co-founder and then-CEO Scott McNealy in March 2002.* This was after its stock price had been obliterated in the wake of the first tech bubble’s implosion.
*McNealy quoted in BusinessWeek, 2002:
At 10 times revenues, to give you a 10-year payback, I have to pay you 100% of revenues for 10 straight years in dividends. That assumes I can get that by my shareholders. That assumes I have zero cost of goods sold, which is very hard for a computer company. That assumes zero expenses, which is really hard with 39,000 employees. That assumes I pay no taxes, which is very hard. And that assumes you pay no taxes on your dividends, which is kind of illegal. And that assumes with zero R&D for the next 10 years, I can maintain the current revenue run rate. Now, having done that, would any of you like to buy my stock at $64? Do you realize how ridiculous those basic assumptions are? You don’t need any transparency. You don’t need any footnotes. What were you thinking?
There is a good case based on technical analysis that the equity market is skating on thin ice. Highly respected chartist Carter Worth suggests that the S&P 500 Index has run out of upside potential based on well-defined historical trend lines:
Figure 4. S&P 500 20-Year Trendline (2006-2025)
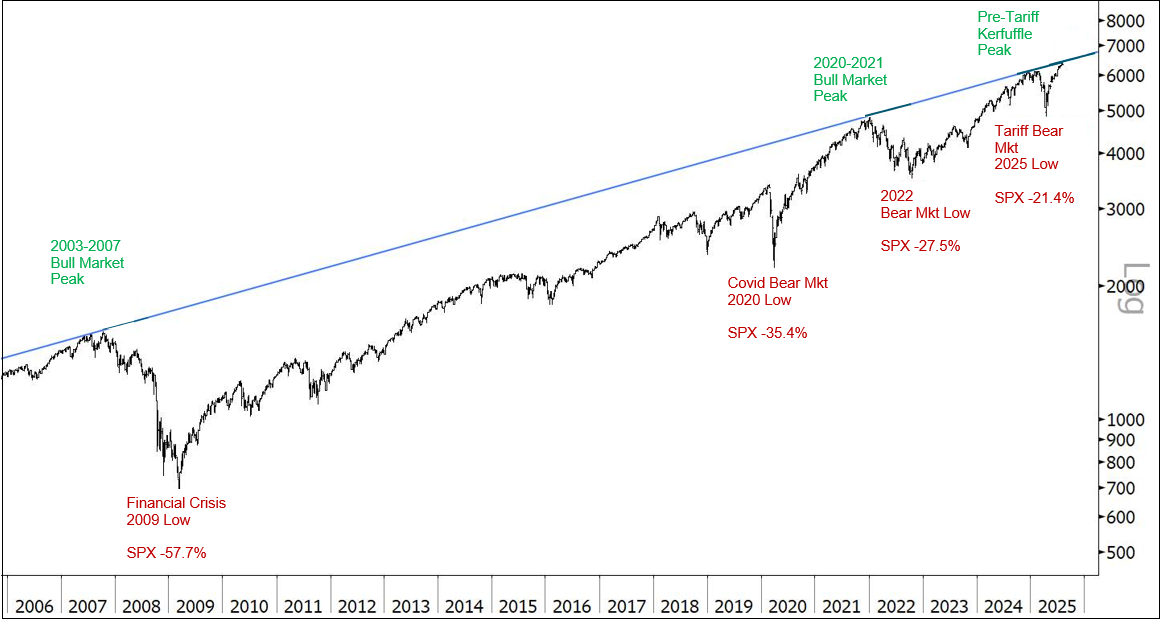 Source: Worth Charting as of 7/31/2025.
As to the danger signals emitted from euphoric psychology, special thanks go to Bitcoin Magazine (August 1, 2025) for this gushing explanation of the rationale for crypto trusts:
Strategy (formerly MicroStrategy)6 delivered a second-quarter earnings call that demonstrated more than financial results; it revealed a robust and deliberate treasury architecture designed to make Bitcoin the centerpiece of shareholder value creation. The call was dense with insight into how a public company can re-engineer its balance sheet, capital structure, and market signaling to outperform traditional fiat-based treasuries.
An excellent discussion of the proliferation of bitcoin trust issuance (Bitcoin TreasuryCos: Lessons From The 1929 Crash) suggests analogies to the investment trusts of the 1920s or mortgage-backed securities that preceded the 2007-2008 Global Financial Crisis (GFC).
Additional grist for the bearish mill includes the recent preponderance of insider selling. The Kobeissi Letter (@KobeissiLetter) posted on X at 3:28 PM on Tuesday, Aug 05, 2025:
Figure 5. 
Source: https://x.com/KobeissiLetter/status/1952844058721730881.
Yet another sign of a market top is hyperactive retail trading in zero-day options. Zero-day options are options contracts that expire on the same day they are traded. These have become increasingly popular among traders due to their potential for quick profits and high leverage. Retail investors account for over half of all zero-day options trading flow, and recently, zero-day options surged to an all-time high, comprising 61% of total S&P 500 volume.7
What, Me Worry?
For all but the few investors that pay close attention to gold macros, it seems the consensus expectation is for minimal upside versus considerable downside risk. Figure 6 depicts Wall Street’s bearish consensus expectation. Investor hesitation to position gold stocks most likely is directly connected, in our opinion, to the resolute bullishness that props mainstream equity positioning. Until real economic adversity sets in, interest in gold and gold stock exposure will likely continue to be a case of “Who needs it?” Alfred E. Neuman is alive and well.

Figure 6. Consensus Forecasts on Gold Prices to 2028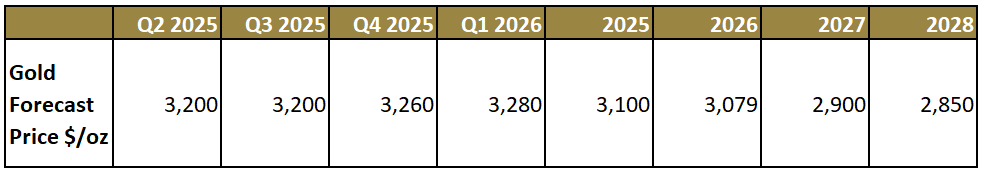
Source: Bloomberg. Data as of 6/30/2025.
Is gold nonetheless a “crowded” trade? As reported by the June 2025 Bank of America (BofA) Global Fund Manager Survey, 41% of respondents think so. However, BofA also reported that investors had allocated just 3.5% of their portfolios to gold. Sentiment is bullish, as reflected by Market Vane (Figure 7), but below the “Tariff” peak of Q1 2025 and the COVID peak of 2019. The steady liquidation of GDX gold mining shares suggests investor aversion to gold exposure.
Figure 7. GDX Shares vs. Market Vane Sentiment Index8 (2018-2025)
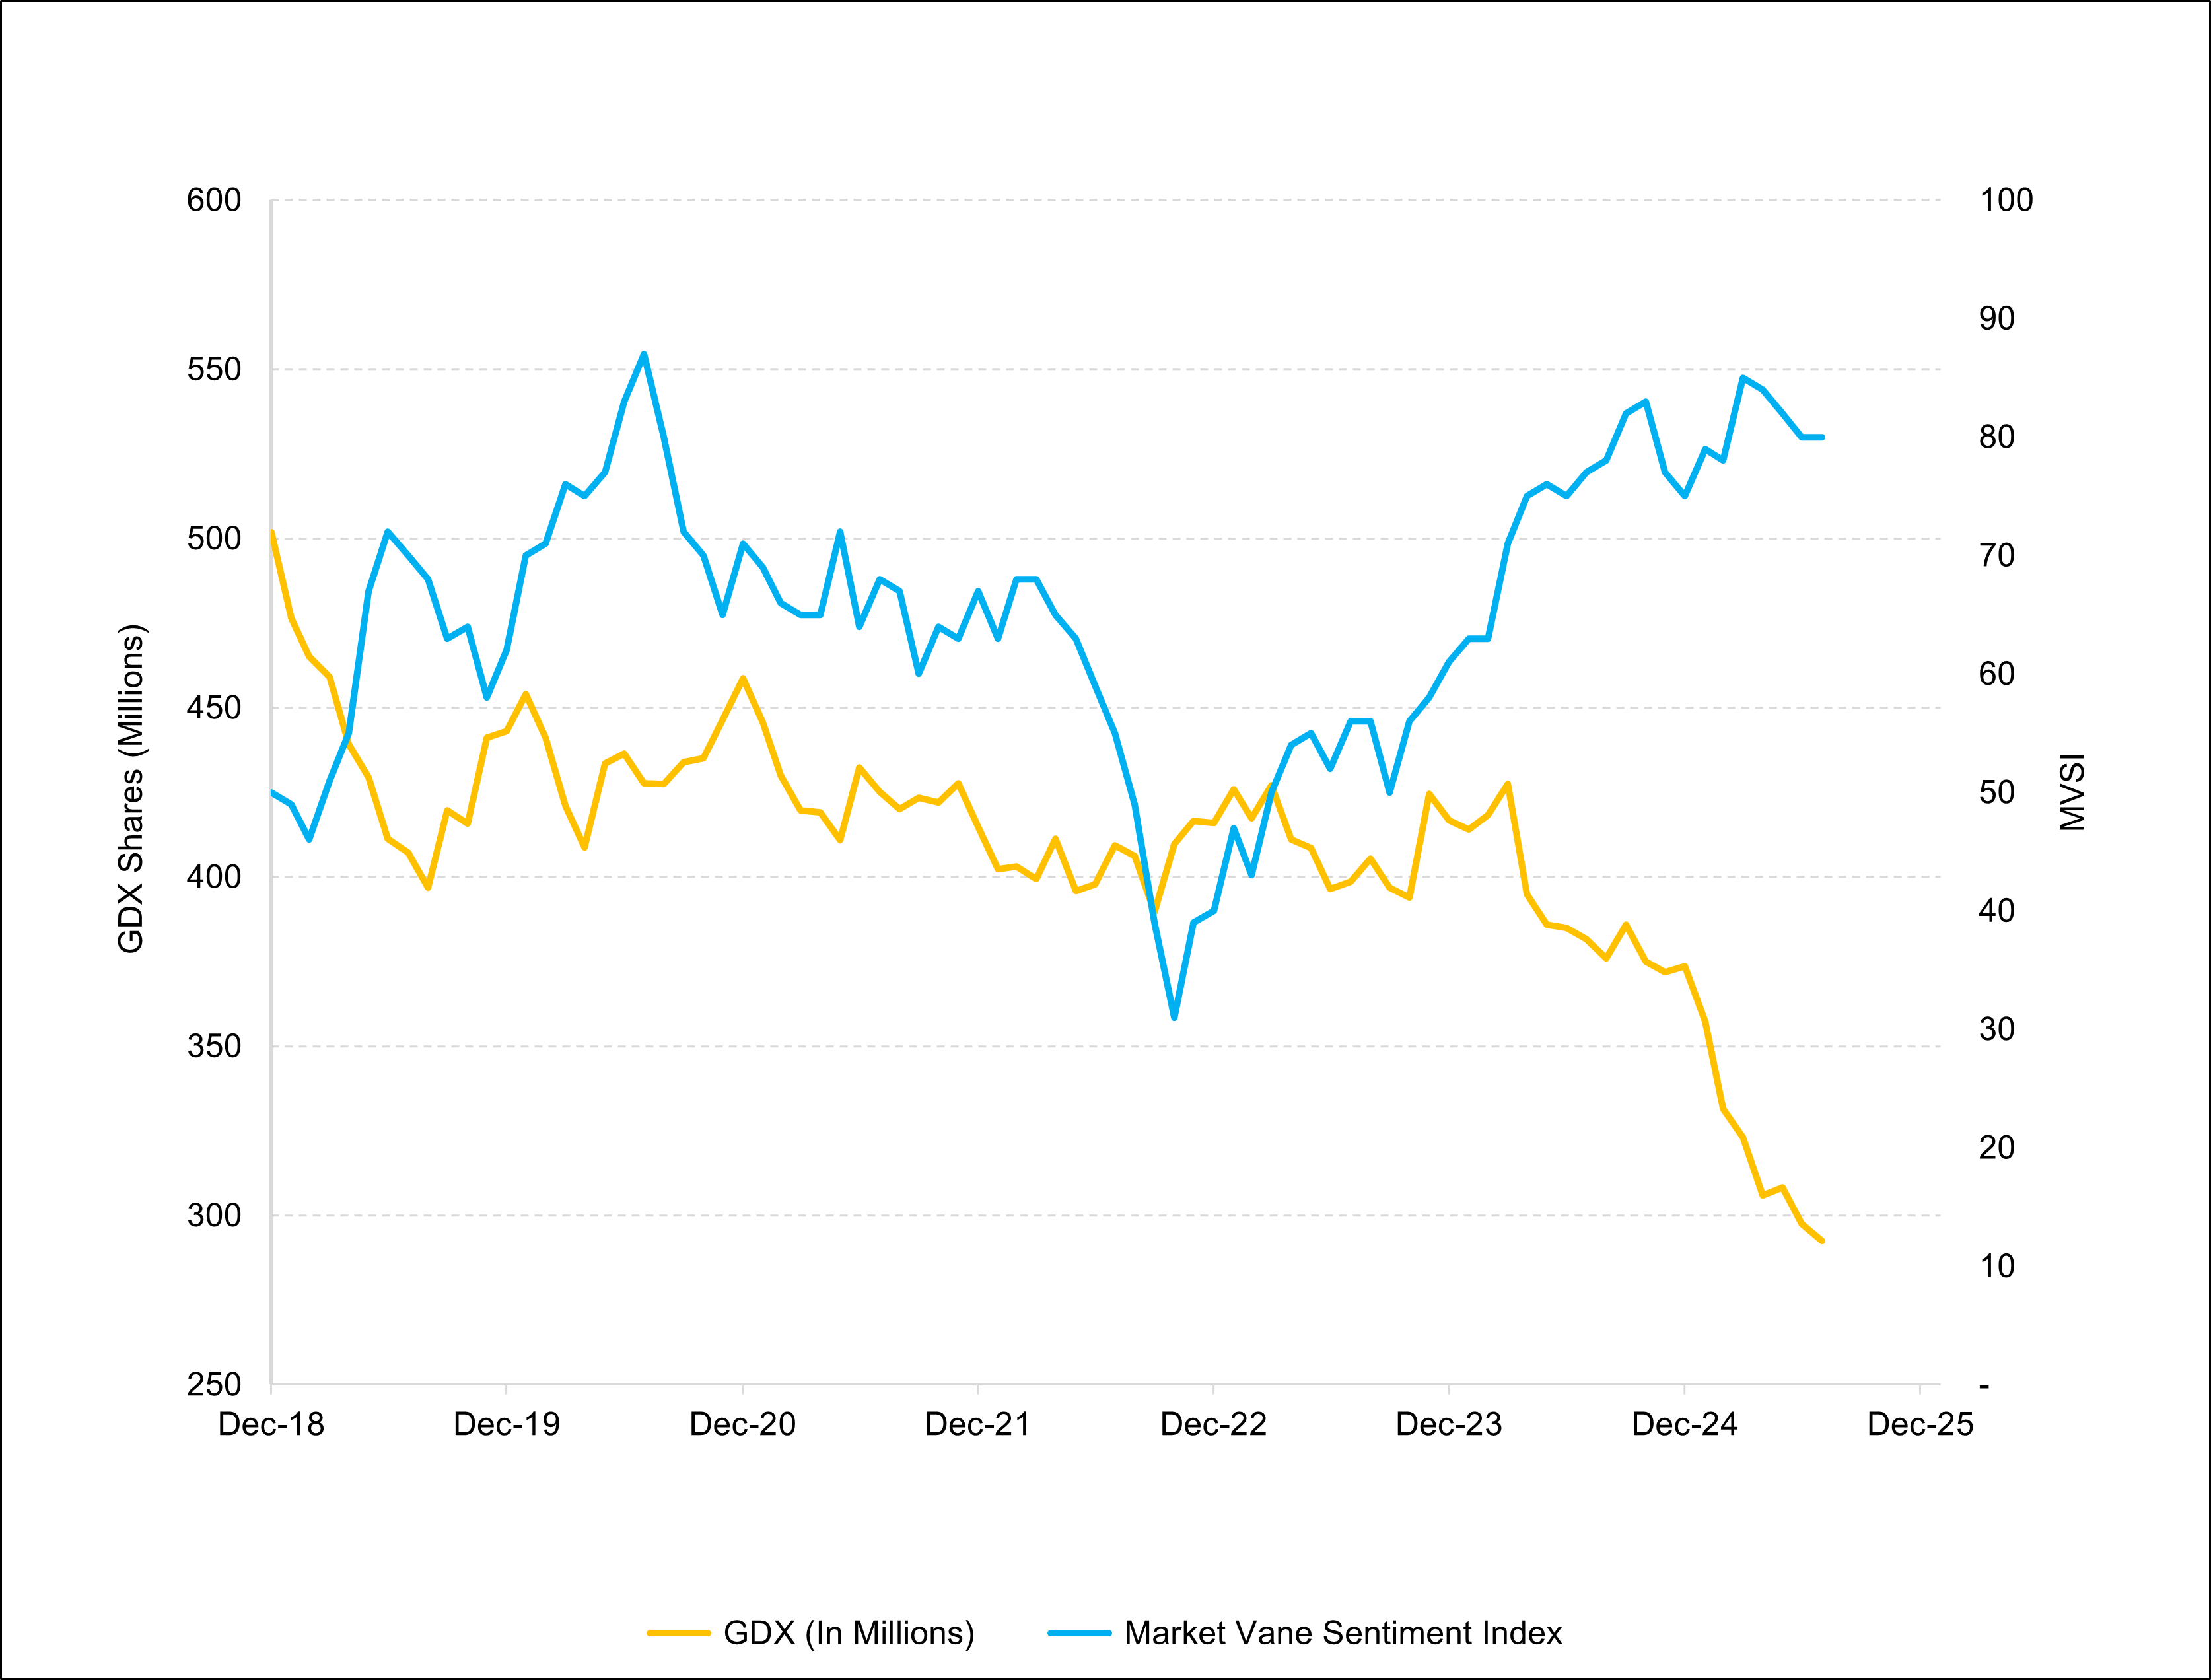
Sources: Bloomberg and Market Vane. Data as of 8/13/2025.
In our view, gold is consolidating its April 2025 spike to $3,500 per ounce. The many factors that launched gold to that temporary peak, including central bank buying, de-dollarization, concerns over the U.S. fiscal situation and geopolitical risk have continuing latency and explain why gold is trading effortlessly in the current range of $3,200 to $3,400. They have been extensively discussed, however, and one might say already “priced in” to the current trading range. What we believe has not been priced in, however, is a significant decline in equities.
Mainstream Support for Gold
In The Strategic Case for Gold and Oil in Long-Run Portfolios (5/28/2025), Goldman Sachs co-head of Commodity Research Daan Struyven states:9
Following the recent failure of U.S. bonds to protect against equity downside and the rapid rise in U.S. borrowing costs, investors seek protection for equity-bond portfolios. During any 12-month period when real returns were negative for both stocks and bonds, either oil or gold has delivered positive real returns
It is one thing for those already convinced of gold's merit to suggest, but quite another for Goldman Sachs, that the time-honored risk mitigation portfolio strategy provided by a 40% weighting in bonds no longer functions.10 Even more attention-grabbing is Goldman’s call to substitute gold for bonds. Words from Goldman amount to gospel for investment fiduciaries managing assets of trillions that have little or no gold exposure. The message has been delivered, but the investment response has barely started, in our opinion. Even a slight reallocation as a percentage of global financial assets would have a disproportionate percentage impact on the gold price.
Goldman says gold, not bonds, is the safe haven now.
The catalyst least discussed but, in our view, most likely to power gold's breakout into new high territory would be a general loss of confidence, either sudden or gradual, in financial assets. Gold is under-owned and highly illiquid relative to potential capital market flows. That limited illiquidity was discussed at length in our previous Sprott Gold Report, The Return of Exter’s Inverted Pyramid.
Exter’s Pyramid, conceived by economist and Fed Governor John Exter in the 1960s, is a visual representation that categorizes assets based on their liquidity and risk. The assets at the bottom of the pyramid are considered more liquid and less risky, while the assets at the top are less liquid and more risky. During times of prosperity and high confidence, capital flows towards riskier assets at the top of the pyramid, such as equities, corporate bonds and derivatives. By contrast, during times of financial crises, investors seek refuge in “safer” assets toward the bottom of the pyramid, including cash and gold.
However, Exter in all likelihood did not imagine that his pyramid would become sufficiently top heavy with derivatives and debt to nullify the liquidity of gold that he posited. We would, with respect, add to Exter’s conception the proviso that: “Where there is liquidity there is no value, and where there is value there is no liquidity.” During periods of high confidence, risky assets appear highly liquid, an illusion that rapidly dissipates when the music stops.
Figure 8. Exter's Pyramid in the 21st Century
Source: Antiquesage.com.
Got Gold?
A swing in the pendulum of confidence, as it seeps into investment psychology, has the potential to destroy illusory wealth, disrupt the economy and possibly destabilize political order. The case for allocating a meaningful slice of liquid assets to unlevered positions in physical metals has never seemed stronger. Why tiptoe around the edges of a plausible reset of macro expectations with token exposure? The potential influx of liquid assets into gold could, in our opinion, double the U.S. dollar price within a year or two. Should this occur, profits of many mid- and small-capitalization miners could exceed their current equity market capitalization. Gold mining equities are still stuck at bargain basement valuations. We unabashedly continue to pound the table for precious metals equities and bullion alike.
Appendix A.
| 1 | Gold bullion is measured by the Bloomberg GOLDS Comdty Index. |
| 2 | Gold mining equities are measured by the NYSE Arca Gold Miners Index (GDM), a rules-based index designed to measure the performance of highly capitalized companies in the gold mining industry. |
| 3 | Source: The Northern Miner, Agnico Eagle CEO vows to return unused cash, not chase weak deals, July 18, 2025. |
| 4 | The FT Wilshire 5000 Index Series is a comprehensive, float adjusted measure of the U.S. stock market, designed to reflect the performance of all U.S. equity securities that have readily available prices. |
| 5 | The Buffett indicator (or the Buffett metric, or the Market capitalization-to-GDP ratio) is a valuation multiple used to assess how expensive or cheap the aggregate stock market is at a given point in time. |
| 6 | Strategy is the world's first and largest Bitcoin Treasury company, and the largest independent, publicly traded business intelligence company. |
| 7 | The Cboe Volatility Index® (VIX® Index) is considered by many to be the world's premier barometer of equity market volatility. The VIX Index is based on real-time prices of options on the S&P 500® Index (SPX) and is designed to reflect investors' consensus view of future (30-day) expected stock market volatility. The VIX Index is often referred to as the market's "fear gauge". |
| 8 | Market Vane is a sentiment trading indicator used by traders to gauge market direction based on the collective investor sentiment of individual and institutional traders. |
| 9 | Strategy is the world's first and largest Bitcoin Treasury company, and the largest independent, publicly traded business intelligence company. |
| 10 | Goldman Urges Investors to Buy Gold and Oil as Long-Term Hedges - Bloomberg. |


Investment Risks and Important Disclosure
The exact percentage of physical gold and gold equities in an investment portfolio depends on several factors including an investor’s risk tolerance, investment objectives, time horizon, income requirements and overall financial situation. Investing in gold and gold equities involves additional risks like the possibility for substantial price fluctuations over a short period of time and a relatively limited and unregulated market. Sources of gold are concentrated in countries with the potential for political instability.
Relative to other sectors, precious metals and natural resources investments have higher headline risk and are more sensitive to changes in economic data, political or regulatory events, and underlying commodity price fluctuations. Risks related to extraction, storage and liquidity should also be considered.
Gold and precious metals are referred to with terms of art like "store of value," "safe haven" and "safe asset." These terms should not be construed to guarantee any form of investment safety. While “safe” assets like gold, Treasuries, money market funds and cash generally do not carry a high risk of loss relative to other asset classes, any asset may lose value, which may involve the complete loss of invested principal.
Past performance is no guarantee of future results. You cannot invest directly in an index. Investments, commentary and opinions are unique and may not be reflective of any other Sprott entity or affiliate. Forward-looking language should not be construed as predictive. While third-party sources are believed to be reliable, Sprott makes no guarantee as to their accuracy or timeliness. This information does not constitute an offer or solicitation and may not be relied upon or considered to be the rendering of tax, legal, accounting or professional advice.
Company names (including those in Appendix A) should not be construed as investment recommendations to buy, sell or hold any particular security. There is no guarantee that the companies were or will be profitable and reference to them is meant only to broadly illustrate the relative financial situation of gold mining companies as generally indicated by share buyback announcements, dividend hikes, or both, year-to-date.